
KB Home: Wraps Industry Rebound Year, Exiting on Upswing
We look at KB Home’s final FY 2023 numbers and some industry context in equities and relative value in credit.


We dig into KB Home (KBH) numbers as FY 23 wraps up with a stronger balance sheet, a solid outlook, strong order book, and a more streamlined building cycle at lower per unit costs.
The built-to-order model used by KBH was more challenging during the mortgage rate volatility, but the company navigated it in style and heads into what the consensus sees as a friendlier market for mortgage rates after the 2023 8% scare.
Between favorable secular demographic demand trends and issuer-specific attributes, KBH should be heading toward investment grade by 2025 even if the rating agencies lag with an interim upgrade in 2024 to the high BB tier.
In bonds, we see KBH as an overweight for medium grade tier buyers who can step down across the speculative grade divide.
In this commentary, we update our view of KBH, which carries a mid-BB tier composite rating with spreads trading in the tighter end of the BB tier range. We looked in detail at KBH earlier in mid-2023 in a Credit Profile (see KB Home: Credit Profile 6-24-23), and the trends are favorable. The KBH story since then has improved in terms of balance sheet health, its order book, and the mortgage rate backdrop after it banked another round of seasonal peak numbers.
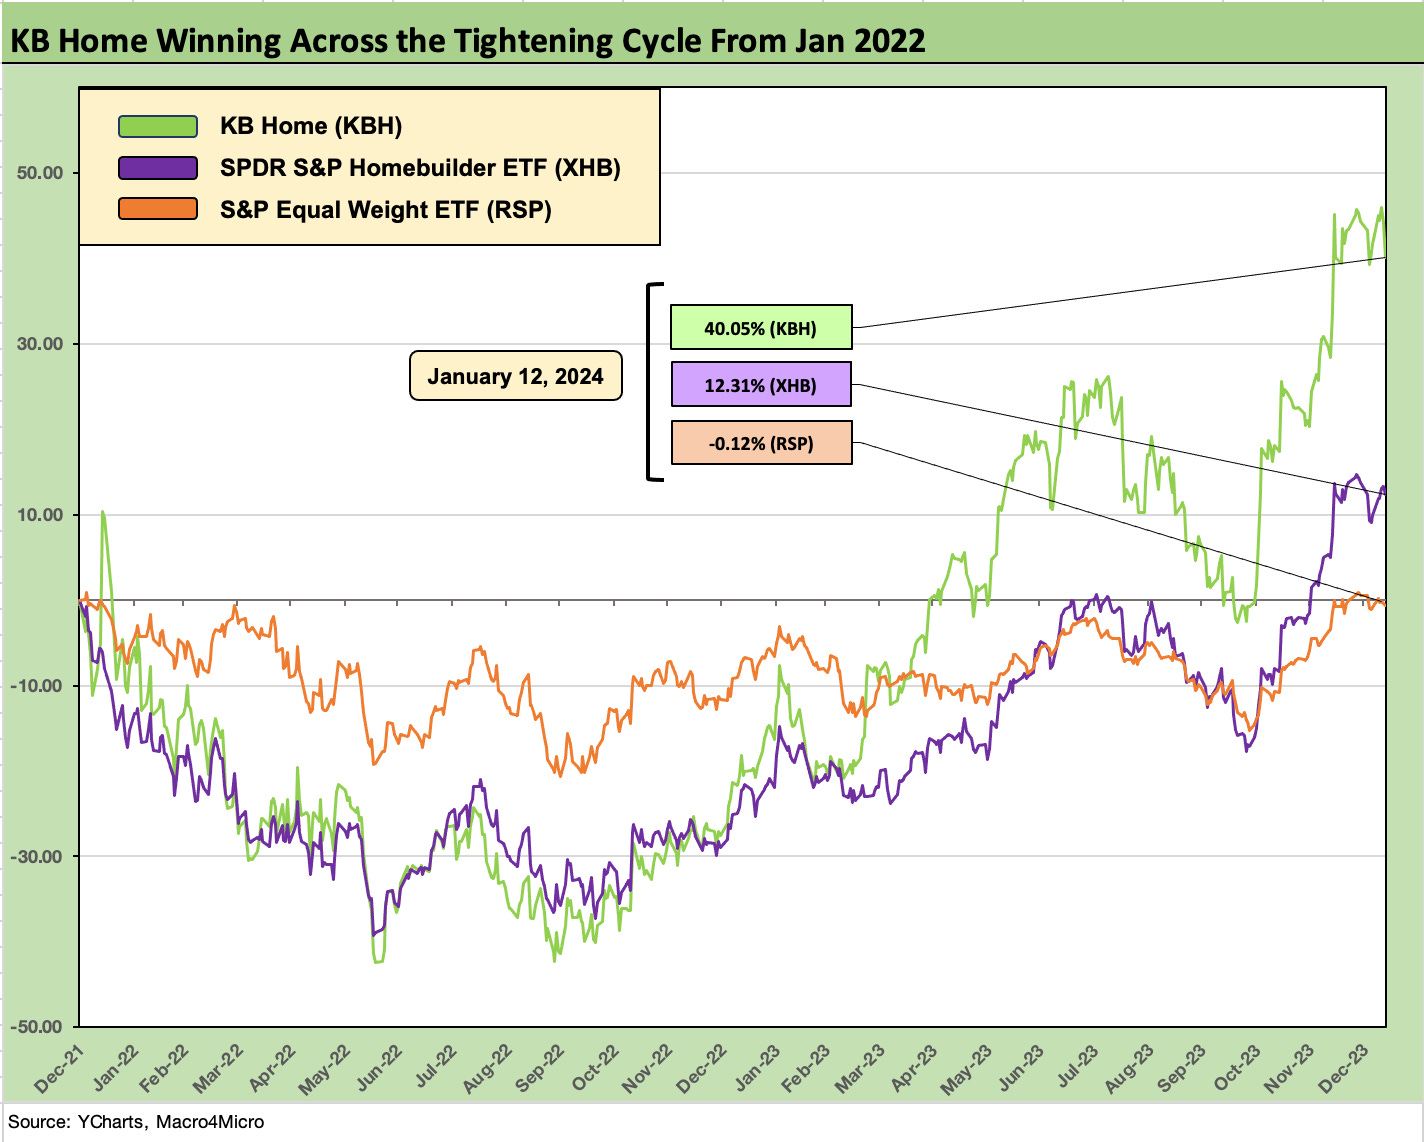
The stock chart at the top of the piece shows the solid performance of KBH vs. the Builder ETF (XHB) and the equal weighted S&P 500 index (RSP) since the start of 2022 to this past week. The UST curve was already steepening in 2021 as the economy rebounded, but the Fed was dragging on ending ZIRP until mid-March 2022. We use the equal-weighted S&P 500 ETF (RSP) as a useful guide to mitigate some of the wild swings in 2022 and 2023 for the tech names and those market cap leaders that became better known as the Magnificent 7.
The short form version is that KBH outperformed the rallying builder peer group in impressive fashion since the UST curve pain and tightening cycle started. The same is true of the broader market after the banner year for builder equities in 2023. In the next chart, we look at more time horizon comparisons across builders and benchmarks and rank them in order of trailing 1-year returns.
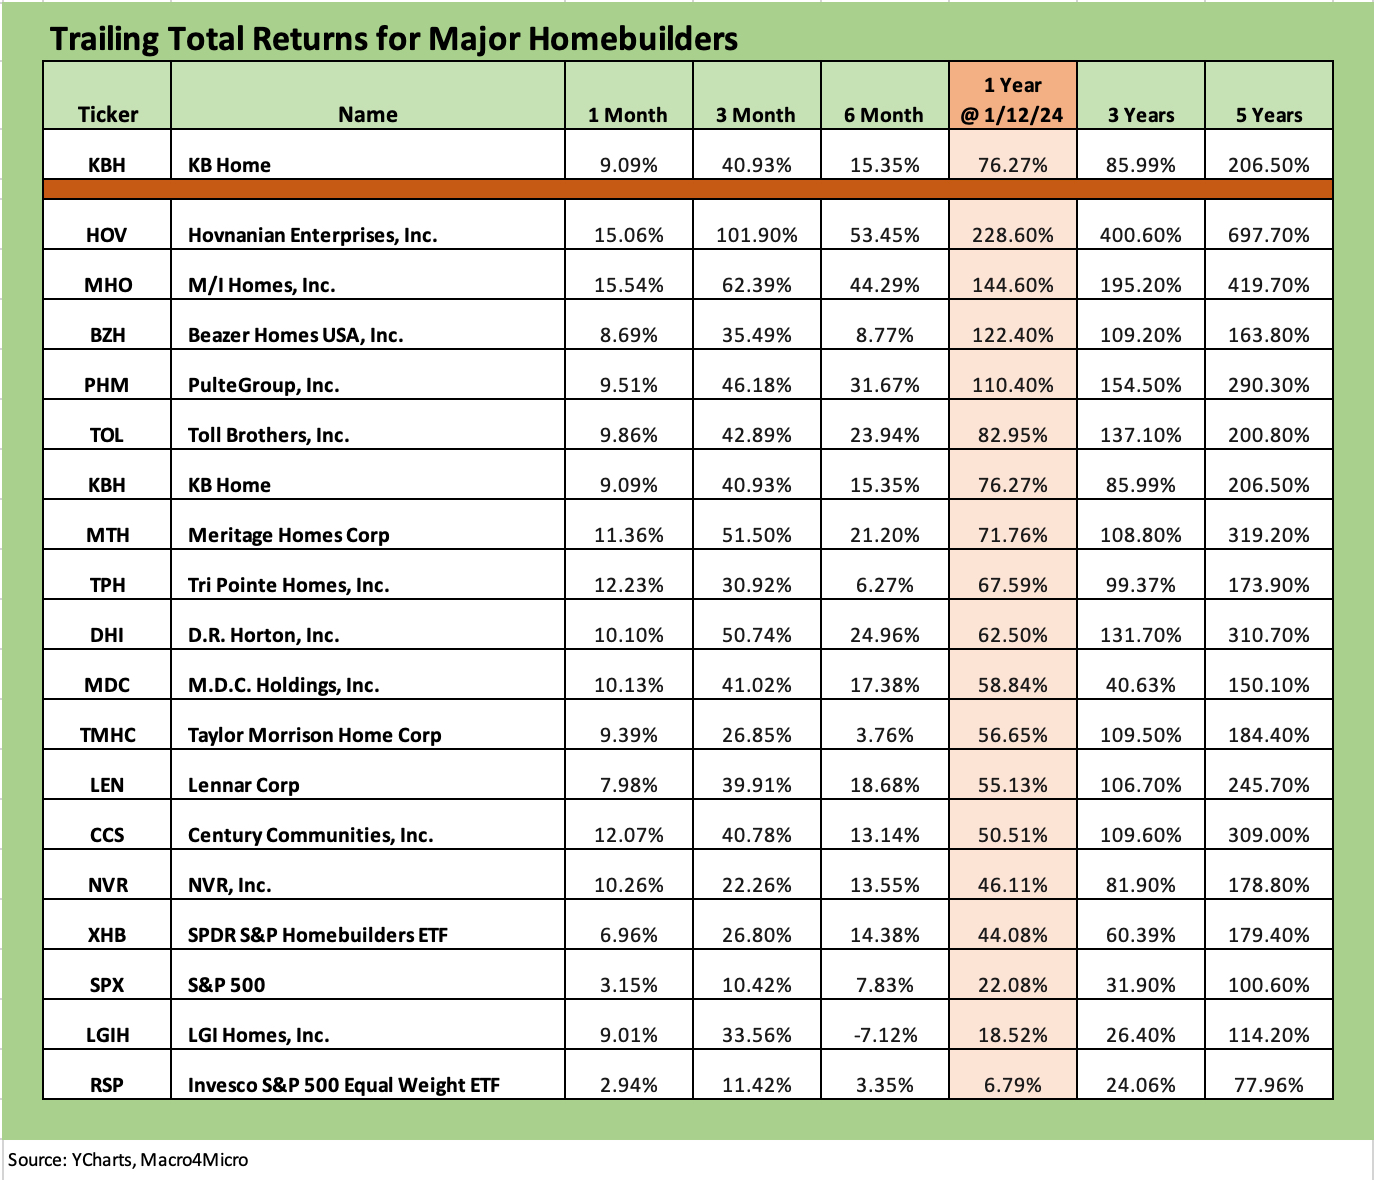
The top 3 returns (HOV, MHO, BZH) were generated by smaller operators or more financially troubled operators in the case of Hovnanian. After those three, we see Pulte, Toll, and KBH leading the larger cap names. This is good company for KBH, who is quickly followed in the rankings above by such midsize comps as Meritage and Tri Pointe. Pulte and Toll rank in the Top 5 builders in market cap and KBH is #8 behind MTH and TMHC. We see 6 of the Top 8 by market cap in the BBB tier with TMHC and KBH on deck. We see 7 of the Top 10 in the BBB tier.
As we covered in our 2023 asset return recap (see Footnotes & Flashbacks: Asset Returns 1-1-24), the Builder ETF (XHB) took the crown at #1 just ahead of the Tech ETF (XLK) and a group of tech-centric and Magnificent 7 heavy benchmarks and ETFs in #2 through #6 before the BDC ETF (BIZD) took #7. The Magnificent 7 heavy S&P 500 took #8 (Note: the equal weighted S&P 500 ETF (RSP) climbed to #14 with a strong finish over 4Q23).
The builders made for quite a story during 2023 by demonstrating their ability to operate in a rising UST market with very wide spreads on mortgages. Credit rating upgrades ran alongside major stock buybacks in the industry. KBH is overdue for an upgrade.
The only builder in the chart above to underperform the S&P 500 (market cap weighted with the full Magnificent 7 effects) was LGI Homes. The lag in LGIH can in part be attributed to the fact that it had been awarded a growth multiple in the market over the past cycle and was going to have a harder time making that case in a high mortgage rate market with its typical homebuyer customer profile. The weakened affordability metrics on monthly mortgage payments also fell more heavily on its entry level and first time buyer base with LGIH posting some of the lowest ASPs in the peer group.
Relative value in bonds…
We see KBH bonds as a very sound crossover name for BBB buyers that dip down across the line into BBs. KBH may not make it to IG until 2025 without an interim upgrade to high BB, but it certainly merits upgrades in 2024. IG quality is easy enough to foresee in the numbers even if that goal line drags into 2025. If we look at gross margins, net debt/cap, and inventory coverage of total debt, it is an easy name to get comfortable with.
As we have covered in our other research, some of the solid BBB names such as D.R. Horton and Lennar have a profile more in line with single A tier bonds (see links at bottom). Habits die hard and ratings move slow in the case of the builders and the rating agencies.
We reviewed the trading levels in the context of the low BBB composite cusp and fellow travelers in the mid-BB range such as Taylor Morrison and Tri Pointe. KBH has 4 bonds that run the gamut in coupons from 4.0% on the 2031 bonds to 7.25% on the 2030 bonds issued in mid-2022 at the peak of the inflation anxiety. We like the 7.25% bond for cash income-oriented buyers with a similar rationale seen over in high coupon legacy bonds at Pulte.
The PHM bonds had call protection (see Pulte: Relative Value Meets “Old School” Coupons 11-15-23) as legacy IG long bonds from long ago. In contrast, the KBH 7.25% 2030 bonds are callable in July 2025 at 103.625 and in 2026 at 101.813 before dropping to par in 2027. We would expect rates and improved credit quality will see those bonds refinanced, extended, and gone by 2025.
We looked at recent indications from our data sources and recent trades with spreads running from the high 100 bps range on small recent trades for the 2027 and 2029 bonds vs. mid 200 bps on the 7.25s. The range shown across the data sources made this one more art than science. With UST moving lower again on the short end as of Friday after PPI, this comes down to what you pay for an improving high quality BB tier 7.25% bond into mid-2025, when it is likely to get refinanced. The 2031 bond appeared to be trading tight to the BB tier composite but not close to the BBB tier yet. We noted a +210 bps area level for the 2031s.
The marks and trading expectations can be debated for KBH, but there is no questioning the 7.25% coupon in a low-risk BB tier name. Credit quality is on an upward trajectory, and KBH is well positioned.
Positive event risk symmetry and the middle tier market caps…
As a middle-of-the-pack player in scale and market cap among the public builder peer group, KBH offers an interesting position in the consolidation theme the industry has seen since the credit crisis. KBH offers favorable event risk symmetry in terms of how any such deal would be financed. Consolidation in the sector has been active and prudently financed.
A logical deal would see equity heavy financing in any speculative merger of midsized names such as Meritage or Taylor Homes. That could be a throwback to the Pulte-Centex merger during the housing crisis (see Credit Crib Note: PulteGroup (PHM)11-15-23). Lennar used all stock in its transformational acquisition of CalAtlantic back in early 2018. A more recent example among the mid-tier public names was the THMC acquisition of William Lyon for $2.5 bn (closed Feb 2020) that was 90% equity and 10% cash.
The largest players in the BBB tier include D.R. Horton and Lennar, but LEN has historically been the more acquisition-oriented of the two. D.R. Horton has been the unstoppable force over the years even without big-bang M&A (see D.R. Horton: Credit Profile 4-4-23).
As we detail in the LEN Crib Note (see Credit Crib Note: Lennar (LEN) 11-22-23), LEN had materially expanded through a series of acquisitions and especially in expanding its presence in the West with the CalAtlantic deal. LEN is now stronger than it has ever been in terms of balance sheet metrics (cash in excess of homebuilder debt) with high free cash flow generation. The #2 builder can basically do whatever it wants if it finds a willing seller.
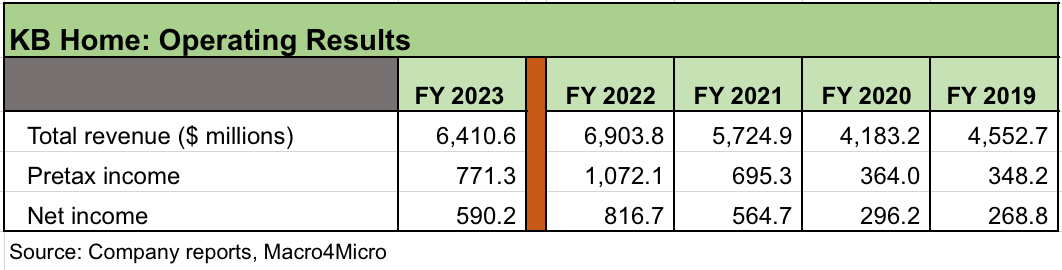
The above chart frames how far KBH has come since 2019 and the pre-COVID period as volumes and prices have risen sharply. Gross margins are also higher in FY 2023 than 2019 and 2020. The peak revenue and earnings year was FY 2022 since KBH was like numerous major builders benefiting from the lag effects of homes under contract.
KBH is one of the players that had focused on a built-to-order business model and the mix is now shifting back more in that direction again. At 4Q23, KBH has only 30% of its homes under production unsold with the remainder under contract. The low mortgage rates, rising prices and post-COVID flight to the suburbs in 2020-2021 spilling into early 2022 are part of an old theme at this point for the post-2019 period.
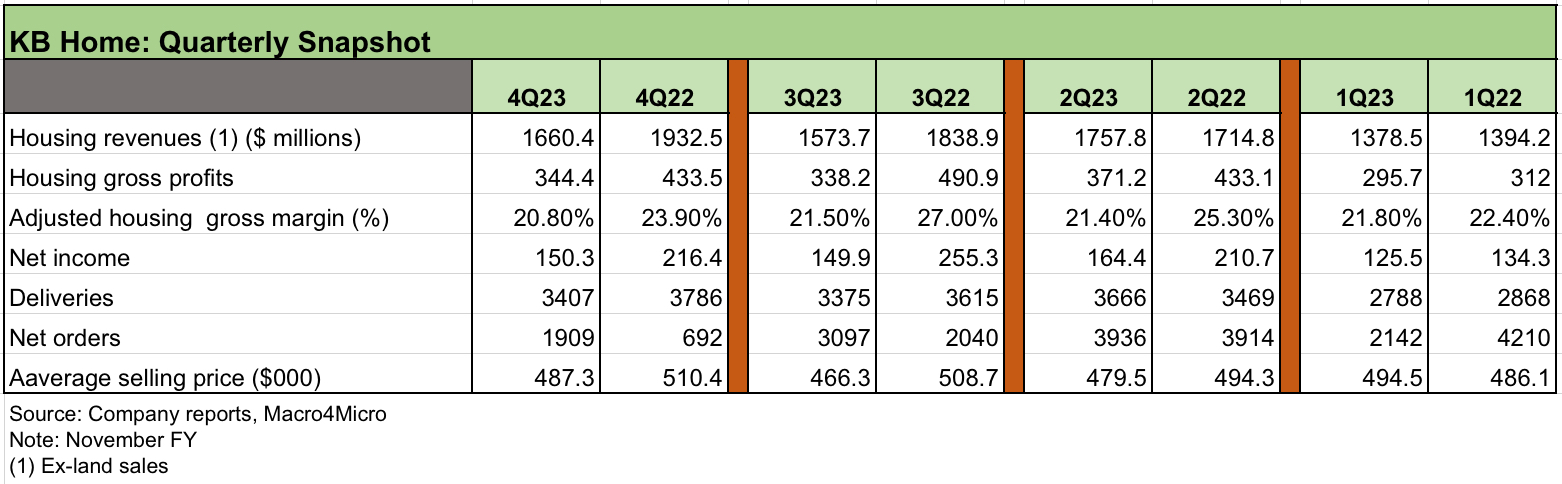
The above chart breaks out the running quarterly metrics across the tightening year of 2022 and on into the homebuilder rally year of 2023 as the reality on the ground in starts vs. existing home sales really drove home the competitive edge of the builders in operating in such a backdrop. The net order YoY increases for 4Q23 vs. 4Q22 offers a clear indication of trends. YoY net order variances turned decidedly favorable in 3Q23 and 4Q23.
The 2023 period saw mortgage rates peak with around 60% of the 4Q23 orders including “some form of mortgage concession.” The use of mortgage incentives was a common theme across the major builders that gave them the edge vs. existing home sales inventory.
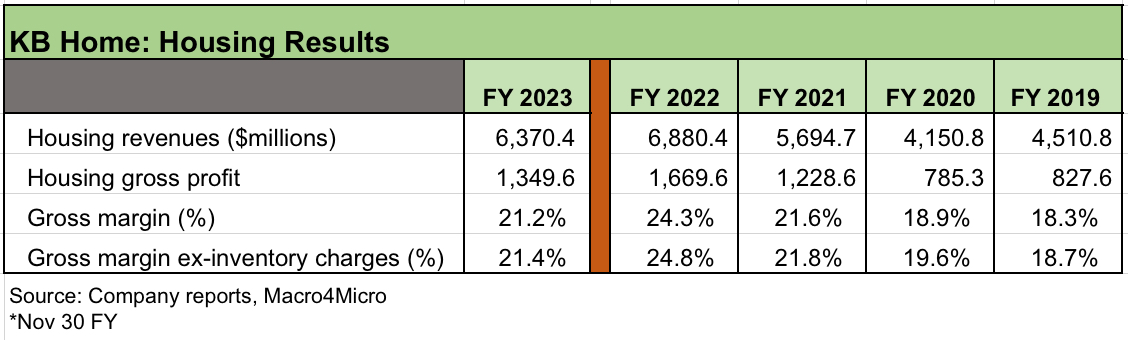
The above chart looks more narrowly at the gross margin trend line for KBH from FY 2019 to FY 2023. The combination of lower prices in 2023 vs. the peak in 2022 and higher costs of funding communities flows into lower gross margins. Given the volatility of supplier chains that are now operating more efficiently, employment rising to a record high payroll count, and moderating ASP moves have set the table for a more normal seasonal pattern in 2024.
After dislocated supply-demand balances and the more recent dramatic rise in mortgage rates in 2023, KBH results reflect an impressive and relatively narrow range for gross margins across the timeline. Gross margins above 20% are quite favorable in longer term homebuilding industry context.
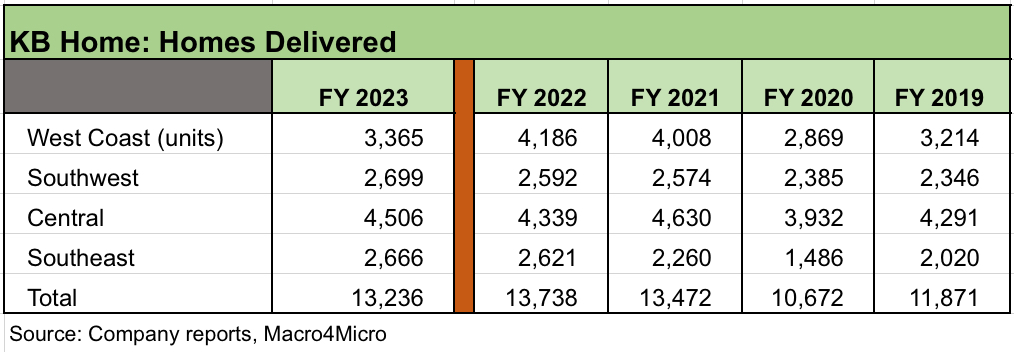
The above chart breaks out the volume trends by geographic segment. Weakness in the West was the main problem for volumes. We saw 3 of the 4 regions post increased volumes. FY 2023 saw major headwinds hit the industry, but the total volumes were well ahead of 2019-2020.
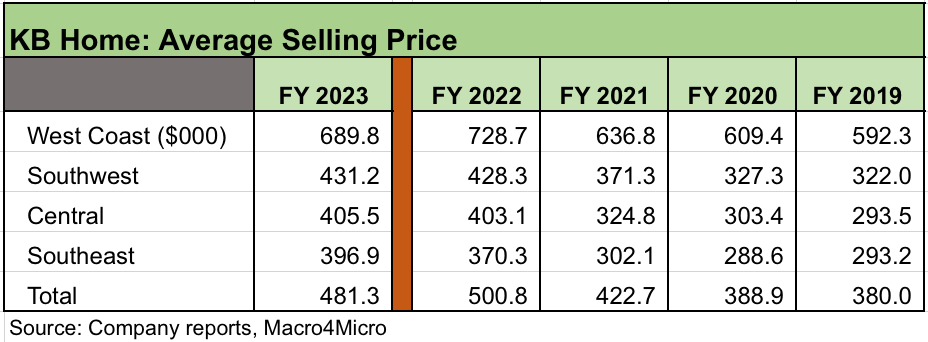
The above chart updates the average selling prices for KBH in total and by region. The mix across regions can make a material difference given the high mix of West Coast exposure and notably with the high prices in California. Even within California, one can find a high variance across metro areas out through the much longer commuting distances.
The increase to over $481K in FY 2023 marks an increase of almost 27% since FY 2019 but a modest tick down in total ASPs from FY 2022 on the West Coast decline. We see 3 of 4 regions posting higher ASPs. Higher prices and eroding affordability on the combination of higher home prices and higher mortgage rates is a consistent theme in housing.
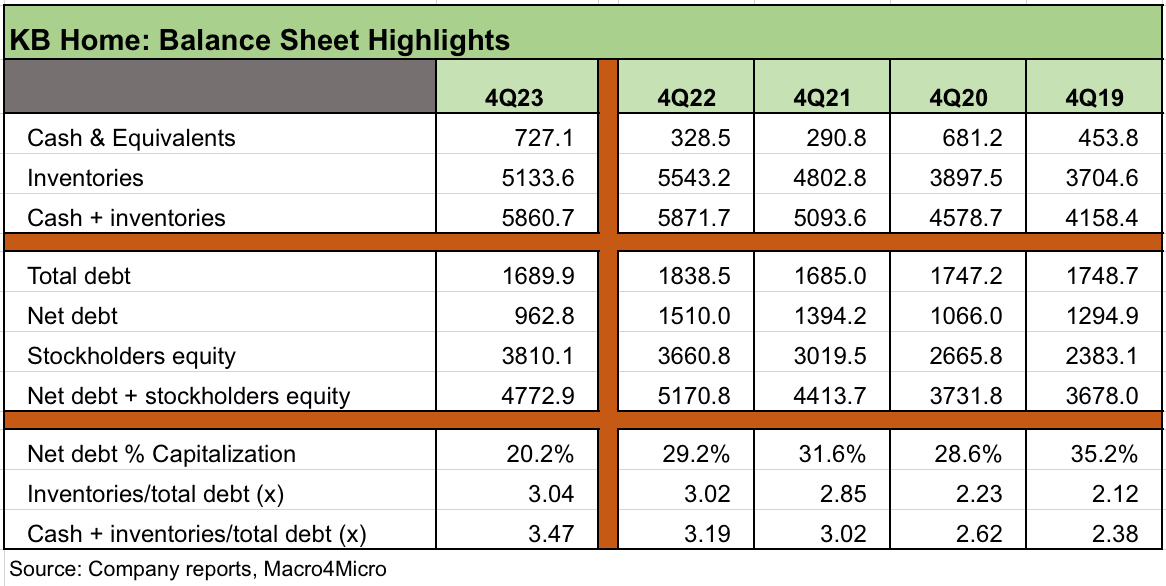
The balance sheet story is clean enough at KBH, and we see it as investment grade caliber whether on a debt to cap basis or based on cash and inventory coverage of debt. We see leverage at new multiyear lows and well below 2019 even with KBH being aggressive in buying back shares at 11% of total shares. Cash + inventory is at a new high at 3.5x total debt and inventory at 3.0x total debt.
As we have covered in other builder commentaries, balance sheet and funds-flow-based analysis of leverage has more relevance than debt/EBITDA metrics.
Banks will typically take a book value leverage test in tandem with interest coverage as a means of framing financial risk in their covenant package. The gross margins and inventory coverage give comfort on how much latitude the builder has to absorb impairments.
As with most builders, interest is capitalized into the home construction process and gets built into the cost of selling a home. Cash and equivalents climbed to $727 million at the end of FY 2023 from $329 mn at FY 2022.
The liquidity of the homes under contract and completed homes highlight the support of the working capital liquidation dynamic (i.e., liquidate inventory and generate cash). The liquidity resilience of homebuilders has been tested and proven across a credit crisis and now an inflation fighting war.
With so many builders in the bond markets (see links at the bottom of this piece) paying down debt with cash and reducing total debt and leverage, the financial risk profile of the homebuilding business is more appreciated in this backdrop of UST curve migration. The stock market certainly has shown its appreciation. Easing the credit ratings criteria has not been as supportive.
See also:
Nov 2023 New Homes Sales: Feeling the Volume Fade 12-22-23
Nov 2023 Existing Home Sales: Avoids New Lows 12-20-23
Housing Starts Nov 2023: Foot by Foot, Row by Row 12-19-23
Lennar 4Q23:Buyer Buzz, Curve Support 12-15-23
Credit Crib Note: Lennar (LEN) 11-22-23
Pulte: Relative Value Meets “Old School” Coupons 11-15-23
Credit Crib Note: PulteGroup (PHM) 11-15-23
Credit Crib Notes: Toll Brothers (TOL) 9-11-23
KB Home: Credit Profile 6-24-23
D.R. Horton: Credit Profile 4-4-23