
Lennar 4Q23: Buyer Buzz, Curve Support
We look at Lennar 4Q23 earnings as a microcosm of housing sector trends.


The UST curve level and shape the market is hoping for in 2024 after the FOMC news is supposed to generate some relief for lower tier buyers while also unlocking some move-up buyers.
The ability to tailor the home to the target homebuyer segment and still tap into mortgage incentives presents a solid homebuilder outlook ahead with demographic tailwinds and high employment still helping the story.
While we see some gross margin compression again just as we saw in 3Q23, volume growth and higher order rates combined with lower average sale prices (ASPs) to bring a strong bottom line as LEN has built a balance sheet with cash well in excess of debt and free cash flow that can retire more debt and buy back stock.
LEN is a cash flow machine as the company navigates the mix of moving parts from the macro level of housing supply-demand and mortgage rates down to the planning level by region, product tiers, supplier chains, and land strategies.
As the #2 US homebuilder behind D.R. Horton and well ahead of #3 Pulte, LEN offers a very good microcosm of the state of housing. The strong earnings and cash flow continue even if gross margins and homebuilder earnings are down from the FY 2022 peak. We looked at the Lennar credit story in one of our recent commentaries (see Credit Crib Note: Lennar (LEN) 11-22-23), and the 4Q23 quarter and fiscal year end (11-30) continued along the same path.
Lennar is positioned as a very strong BBB tier name with financial strength that punches above its credit rating with debt in excess of cash by an even greater extent than in 3Q23. We see cash higher and total debt lower and now a more favorable set of UST curve expectations being embraced by the market.
The overall trend line in 2023 remains favorable with deliveries higher and strong orders. The big picture themes do not change much over the quarters with mortgage rates on the short list of key drivers along with employment and demographics as the high-level tailwinds for the housing sector broadly.
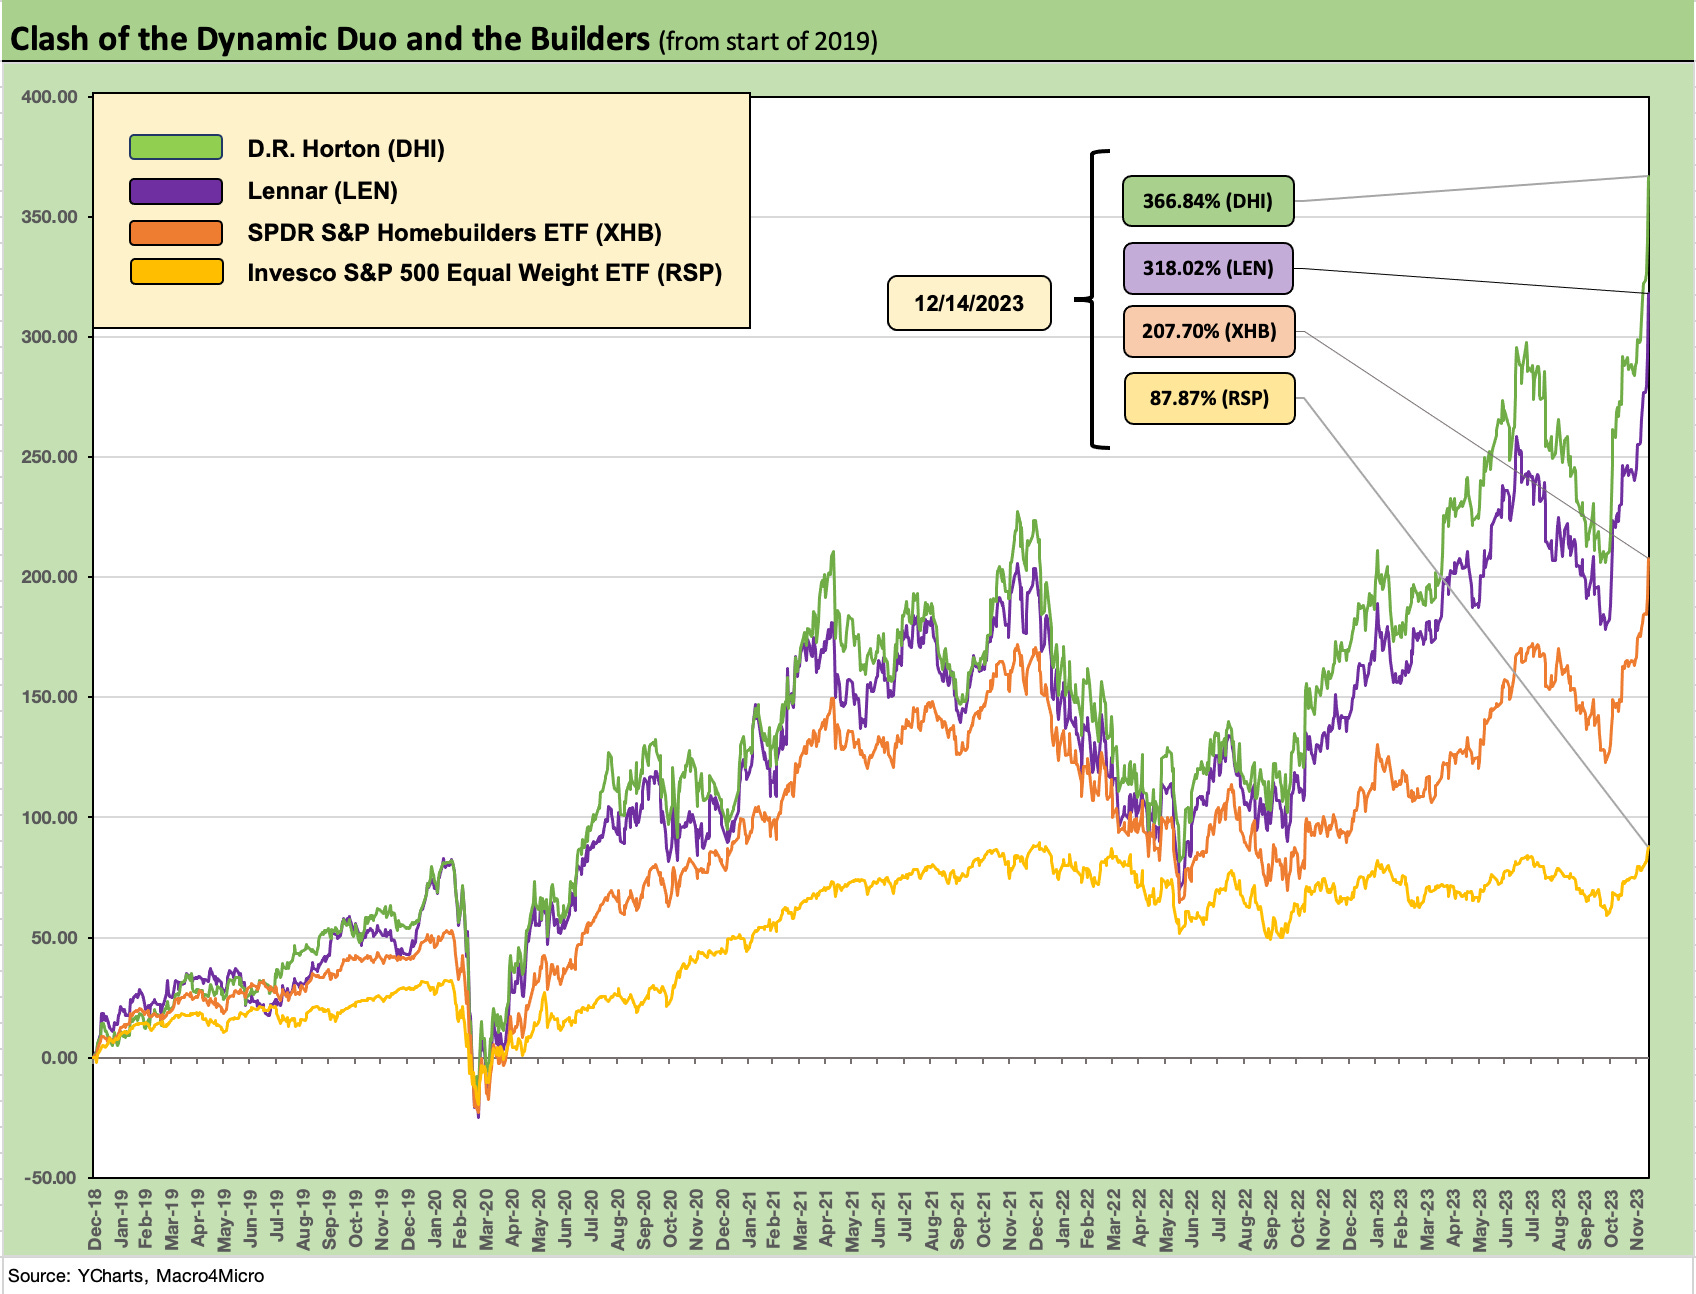
The sharp rally in homebuilder equities has unfolded for good reason in 2023 and just accelerated. The likelihood of a fresh pop higher for builders this week was obvious enough after the FOMC news worked its way through the market. Lower rates should signal higher activity that would come with lower mortgage rates.
We see D.R. Horton and Lennar in the above chart with the largest national scale and below median ASPs, and both have been exceptional performers since the pre-COVID period. We plot them against the Homebuilder ETF XHB (which includes suppliers). DHI, LEN, and XHB have crushed the benchmarks. We include the equal weighted S&P 500 ETF (RSP) as a frame of reference.
The “half empty” school would be that lower mortgage rates would mean more inventory and lower prices, but more activity also brings more volume in move-up trades or shifts into the empty nester trade (“active adults” and the 55+ demographic) where many builders see high margins.
Loss of first-time buyers and entry level customers in the mortgage spike has been a headwind that should be lighter ahead. We also should point out that even high 6% mortgage rates are still painful monthly payments relative to pre-tightening periods.
This week saw LEN stock rally hard with the rest of the builder pack after the FOMC as LEN rose by double digit % over two days. LEN stock saw some weakness this morning into the high $140 handle before popping back to a record high at $156 handle. LEN stock is continuing in a wide range wrestling match as we go to print with the stock around $149. The stock was below $140 within the past week before this week’s all-time highs.
The chart below takes a look at the peer group of homebuilders as we see what a happy year the builders have had as they creatively managed their way around a mortgage market that hit 8% before the recent sharp decline that picked up speed this week. Mortgages went into a steep dive that has some old hands checking their mortgage records for similar events in “normal” markets (ex-crisis distortions that are more indications than real). A mid-6% range is still not a low burden mortgage relative to what many buyers would expect to transact.
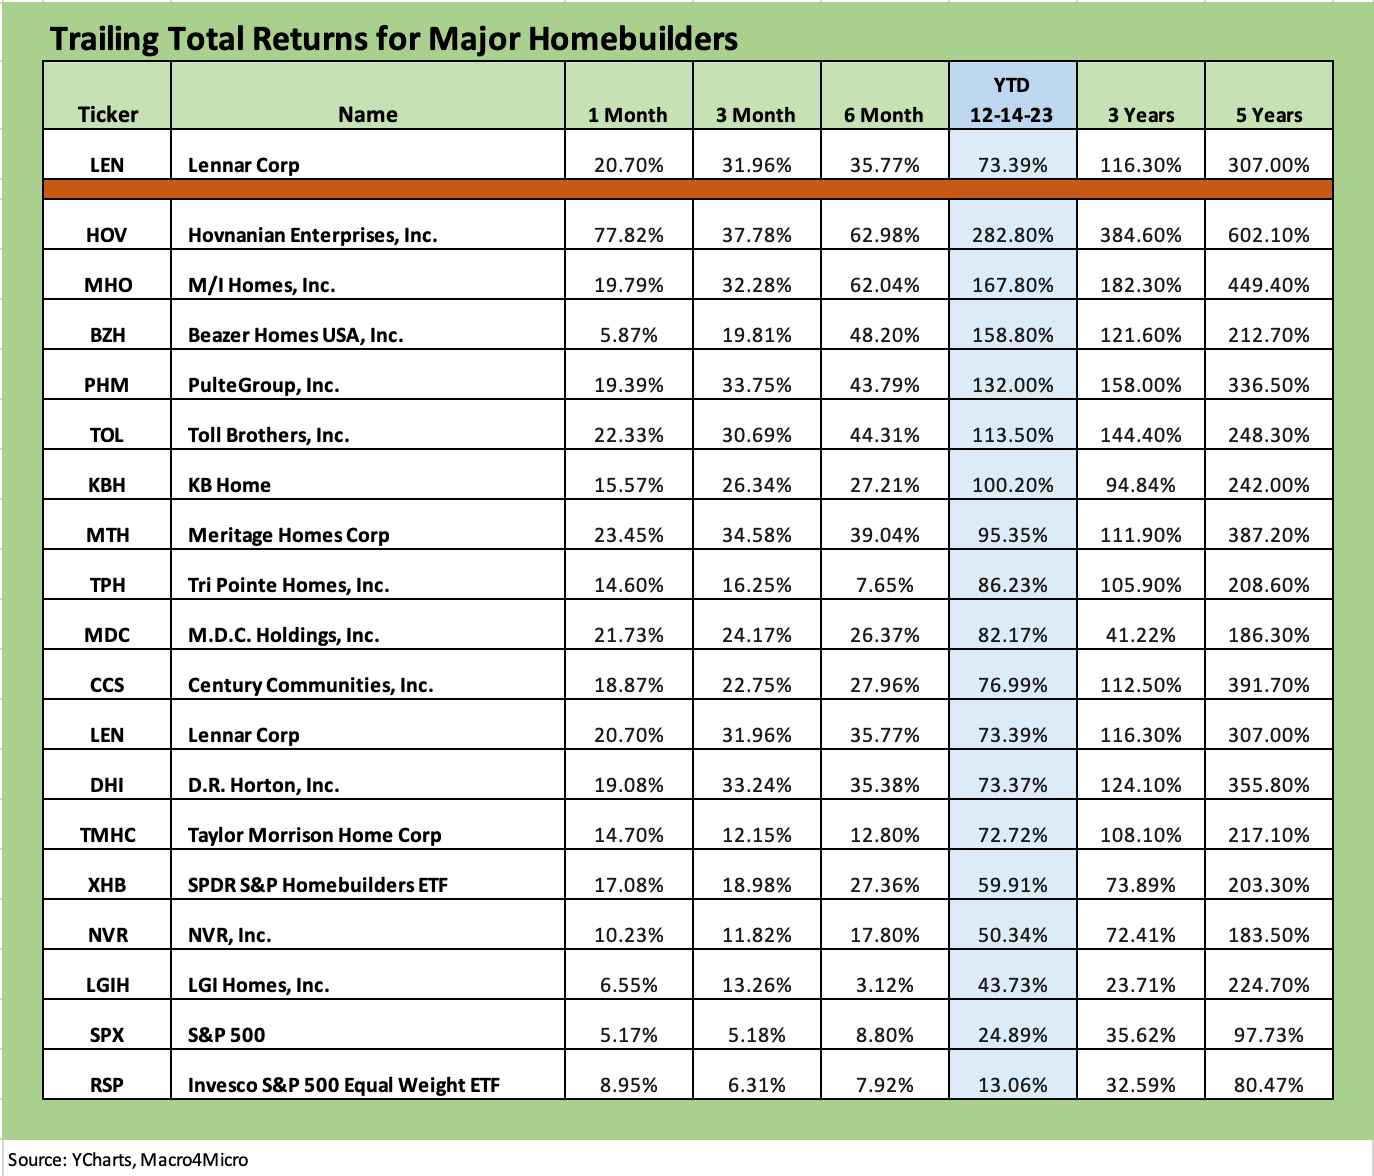
The stock performance table above speaks for itself. We line the builders up in descending order of total returns with the YTD period showing how much the homebuilders have outperformed the S&P 500 and more notably the equal weighted S&P 500. We see a few small caps at the top of the performance charts, but of the major builders, we see Pulte turning in the best YTD performance of the Top 5 builders (DHI, LEN, PHM, TOL, NVR). D.R. Horton tops the largest builders looking back 5 years.
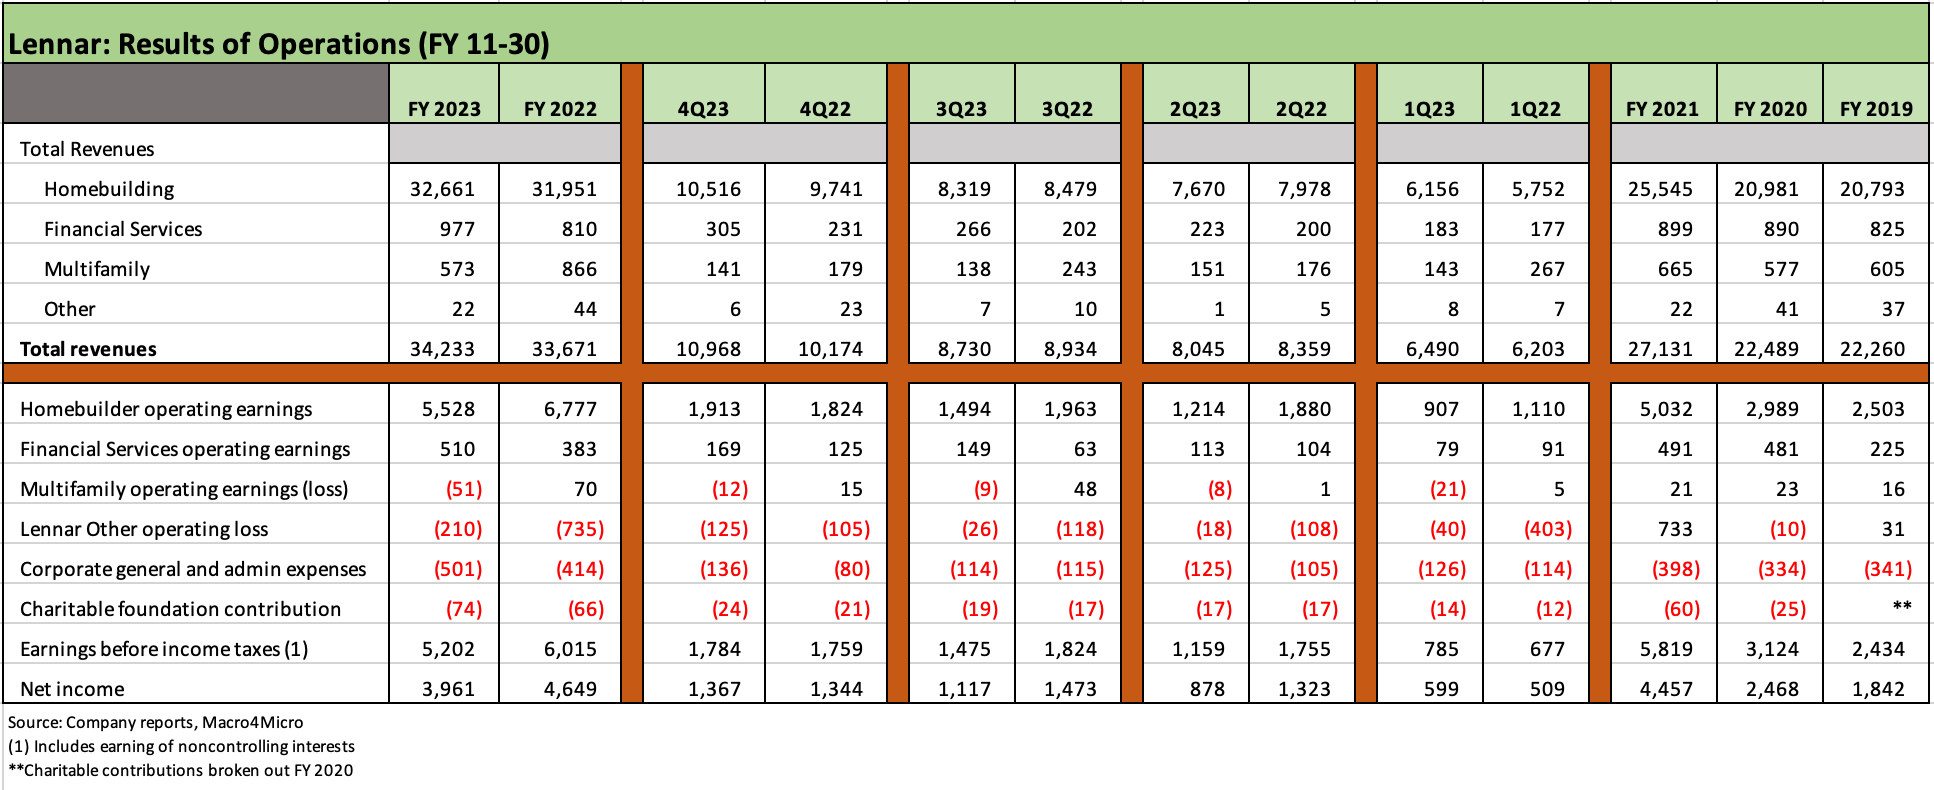
Lennar 4Q23 and financial profile by the numbers…
The news is all good right now, and even the negative flavor of a slight gross margin narrowing and broadly lower ASP by region came with an explanation. Lennar was willing to push ahead on the back of strong inventory turnover performance to keep reloading land and lots while keeping starts in line with sales and showing its strengths in working capital management.
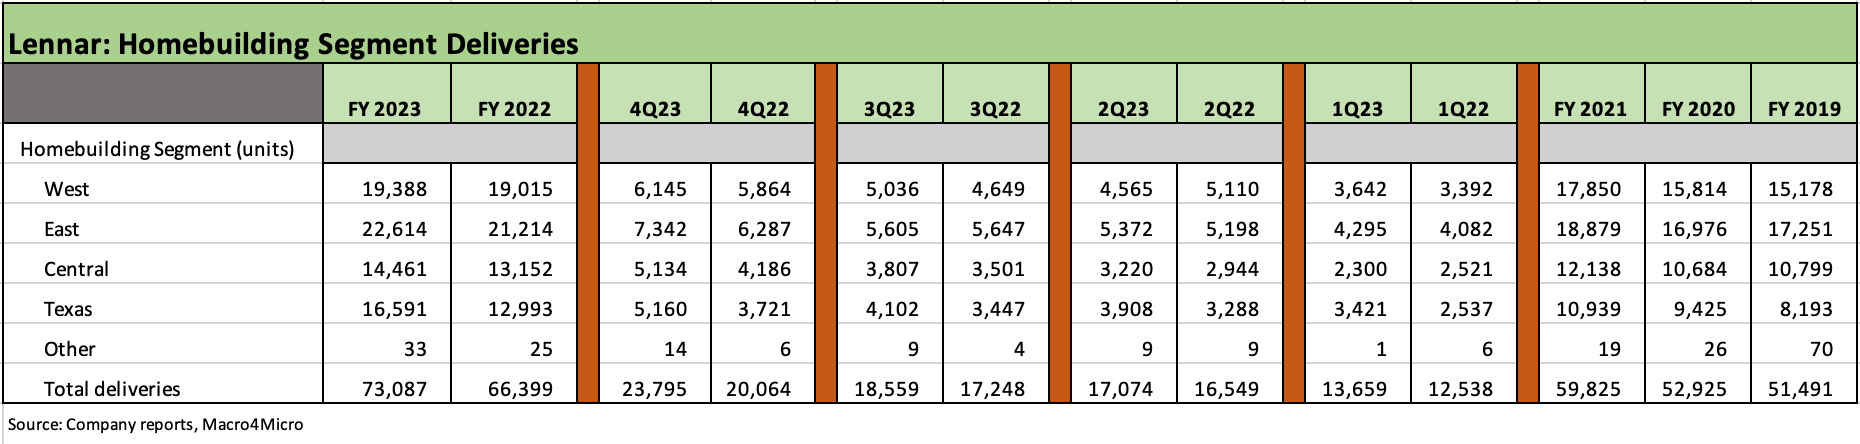
The above chart details the volume story by geographic regions. We see stronger volumes across the board by region. Orders were strong in the quarter and for the year. For FY 2023, orders were 13% higher even with all the noise in the mortgage market and economic question marks. Record payroll counts and a compelling need for a home help. For 4Q23, LEN saw a +32% increase in orders. We will see how the 6% handle mortgage rates hitting the screen flow into new buydown strategies to drive even higher order rates in the new year for 2024 delivery.
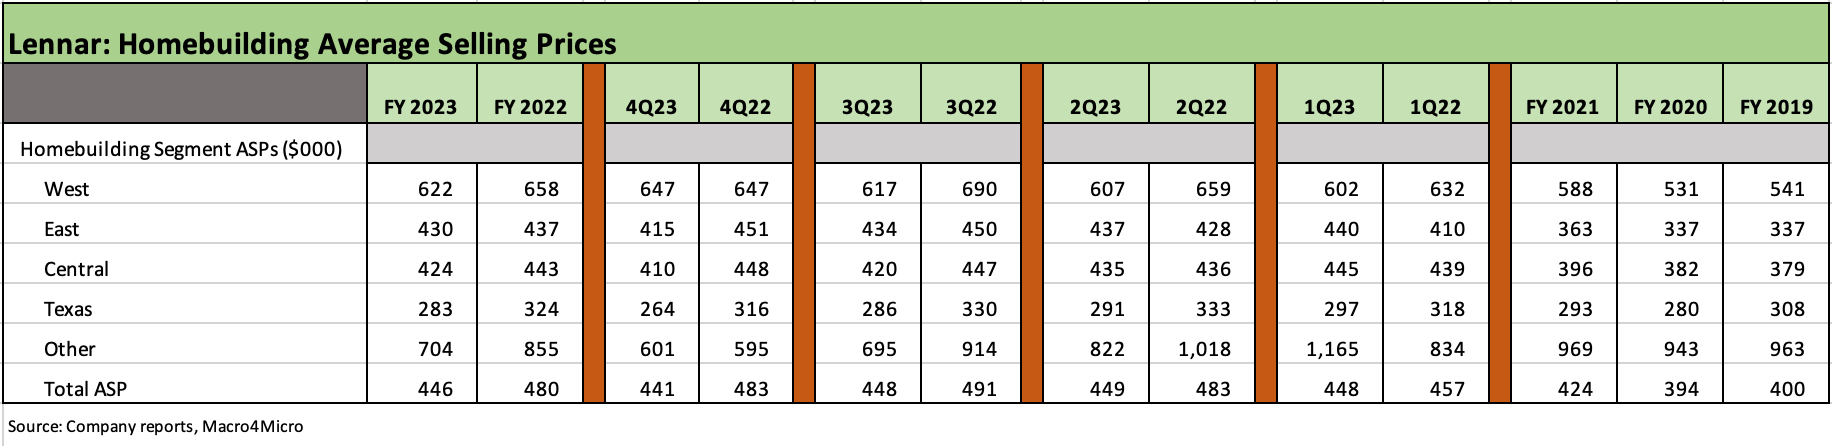
The above chart details the average selling prices by geographic region. For the 4 major regions (“Other” is quite small), we see all ASPs lower for FY 2023 and 3 of 4 (1 flat) for 4Q23. The “price vs. pace” tradeoff is an old discussion point on builder calls, but LEN made very clear the higher turnover strategy and favored trade partner game plan was what it wanted to pursue.
That volume focus can pressure gross margins and raise questions, but their plan was to focus on their successful inventory turnover performance and restarting their land acquisition game plan for the next go-around. That dovetails well with what the Fed is calling for into 2024. Their cash flow certainly was rewarded.
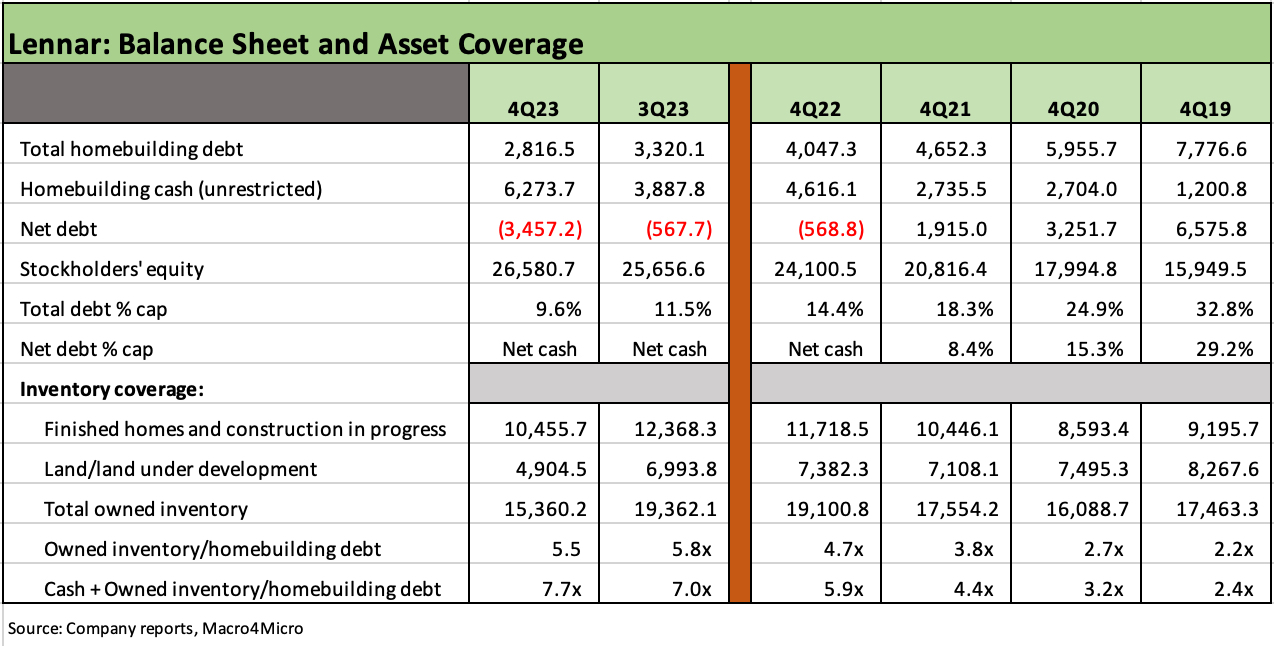
The above chart updates the state of the balance sheet and asset protection at the end of the fiscal year. The short version is the balance sheet is stronger and more liquid than it was at 3Q23 or at 4Q22. We see cash well in excess of debt (net cash position). Total debt has declined as LEN paid down $1.2 bn of homebuilding debt during 2023.
The cash balance of $6.3 billion leaves LEN positioned to continue paying down debt and potentially buying back $2 bn in stock during the next FY 2024. LEN repurchased $1.1 bn in shares in FY 2023. The company played down the idea that the cash was a war chest for M&A, but LEN does have a history of building up its national franchise via acquisition as we covered in the LEN Crib Note.
The acquisition of CalAtlantic (announced 2017, closed Feb 2018) materially strengthened its national footprint but especially on the West Coast. The acquisition of WCI in 2016 bolstered its mix and leading position in Florida. One of LEN’s claims to fame is that it holds the dominant market share in South Florida in the 70% range and by far has a leading position in the entire state at 2x the #2 player. That is a wide range of price points right there.
The chart above shows the impressive asset coverage using inventory coverage or “cash + inventory” of total debt. Both tell a very strong story about a company that has a balance sheet better than BBB tier quality. The variable-cost-intensive nature of homebuilders generally makes for a low-risk liquidity profile as we have covered in our other homebuilder commentaries (see links below). Working capital downsizing in slower markets enhances cash flow. Rising volumes bring more earnings. That is a good choice to have for a bondholder while still offering shareholders the buyback flexibility.
See also:
Pulte: Relative Value Meets “Old School” Coupons 11-15-23
Credit Crib Note: PulteGroup (PHM) 11-15-23
Credit Crib Notes: Toll Brothers (TOL) 9-11-23
Credit Crib Notes: D.R. Horton (DHI) 8-29-23
Credit Crib Notes: Anywhere Real Estate (HOUS) 8-24-23
KB Home: Credit Profile 6-24-23
D.R. Horton: Credit Profile 4-4-23