
Footnotes & Flashbacks: State of Yields 2-25-24
We look at a week of muted yield curve moves, some spread compression, and HY OAS inside the 2014 lows and whispering to 2018 lows.


For UST action, the week was low key ahead of some important PCE inflation numbers this coming week with the biggest moves last week a high single digit move lower for the 30Y UST set against slightly higher in the 2Y UST.
Credit spreads moved tighter again with the IG OAS in line with 1997/1998 and 2007 cyclical lows but HY only below the 2014 lows and closing on 2018 lows but well above the HY bubble lows of June 2007 and Oct 1997.
The UST curve saw a modest flattener in most segments this week, and we update UST segment slopes with a closer look at the 5Y to 30Y as of Friday.
Higher mortgage rates this week were set against decent news on existing home sales from Jan 2024 with the high price tiers rising and lower prices still showing the strains of affordability.
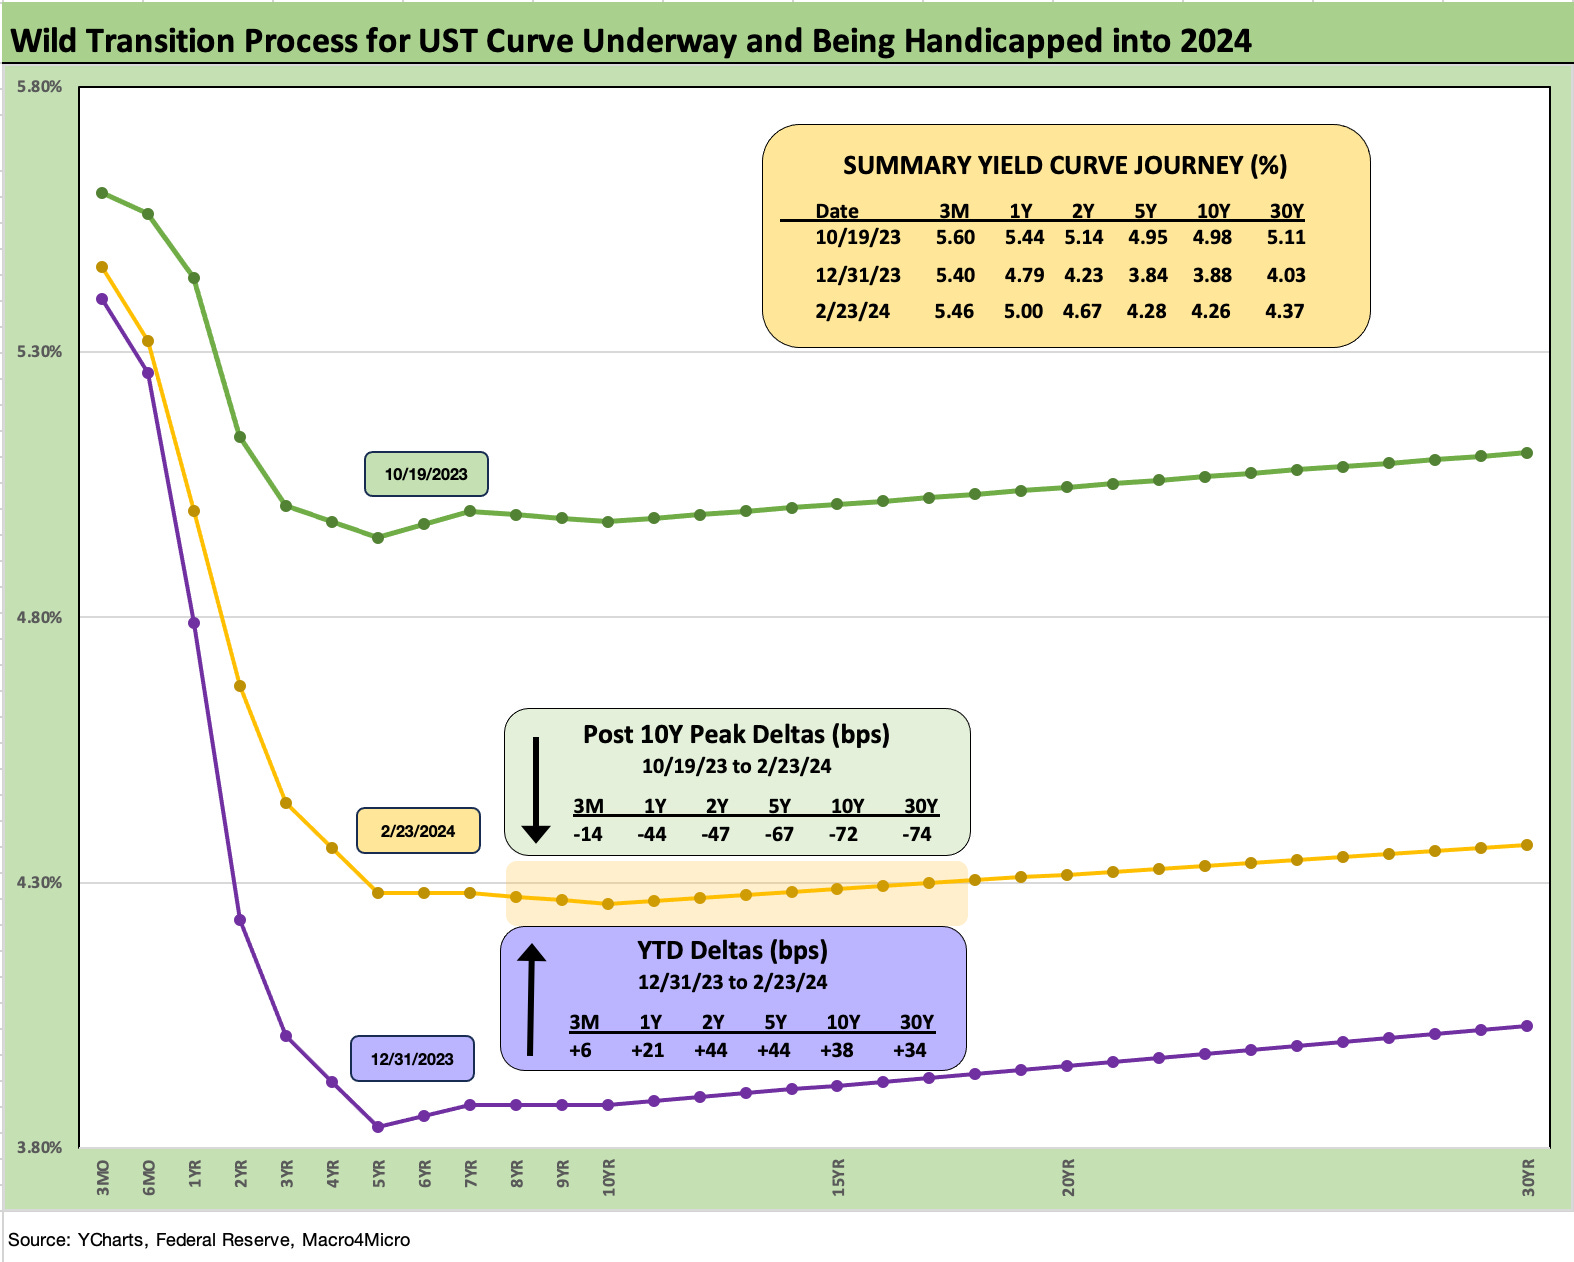
The above chart updates the UST deltas from the Oct 19, 2023 peak through this past Friday. We also update the YTD UST deltas as the market has stepped back from the extremely bullish view for UST that included fed funds cuts early and often.
The downward shift of the UST curve since late Oct 2023 had increased the inversion from the front end but gave bonds a cushion to absorb some of the YTD curve setbacks in 2024. The UST shift higher from 2Y to 30Y has left the UST index in the negative zone YTD for total returns with the same for the IG Corp index.
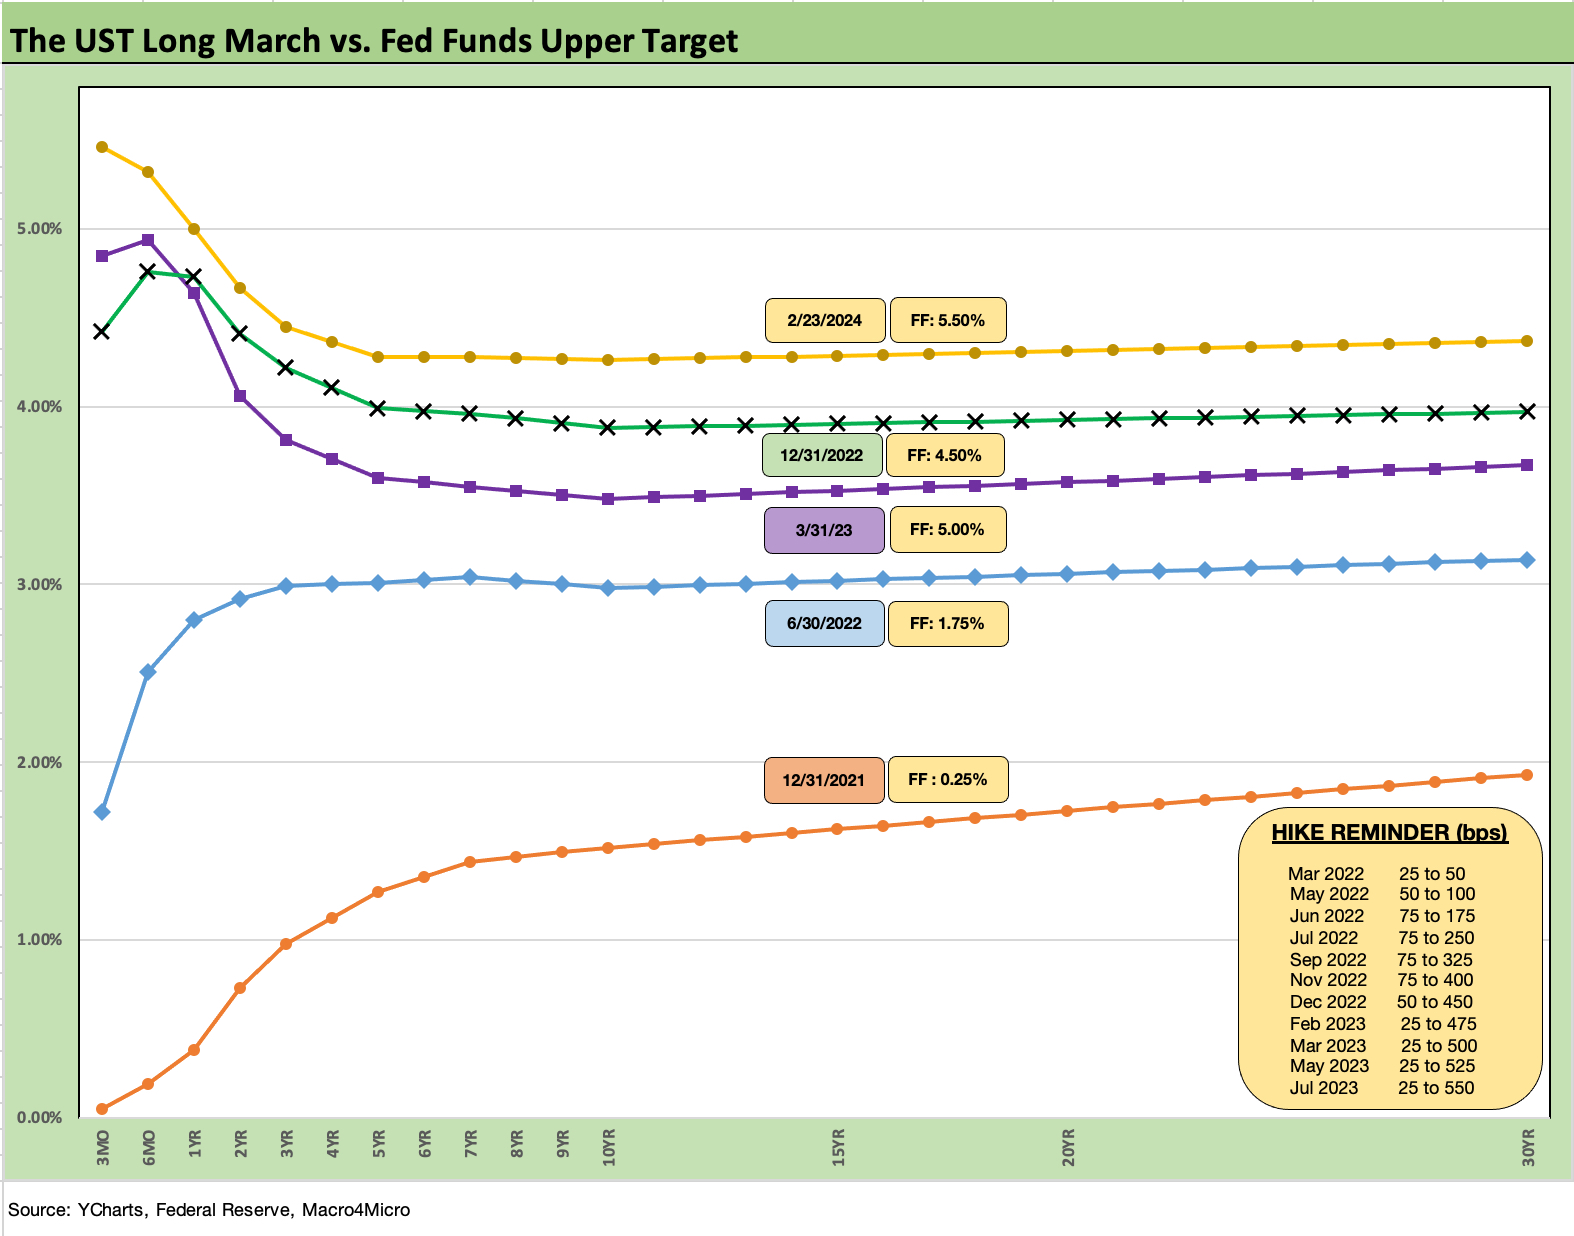
The above chart plots the upward migration of the UST curve since the end of 2021 with a memory jogger box on the Fed hike timelines and magnitude of each tightening move since the end of ZIRP in mid-March 2022.
The bull flattener into a bear inversion has not stalled the economy to this point. Growth has been solid and the consumer resilient. We see updated 4Q23 GDP numbers this week. The PCE inflation numbers this coming week and the income and outlays data will be crucial inputs for the next round of Fed handicapping.
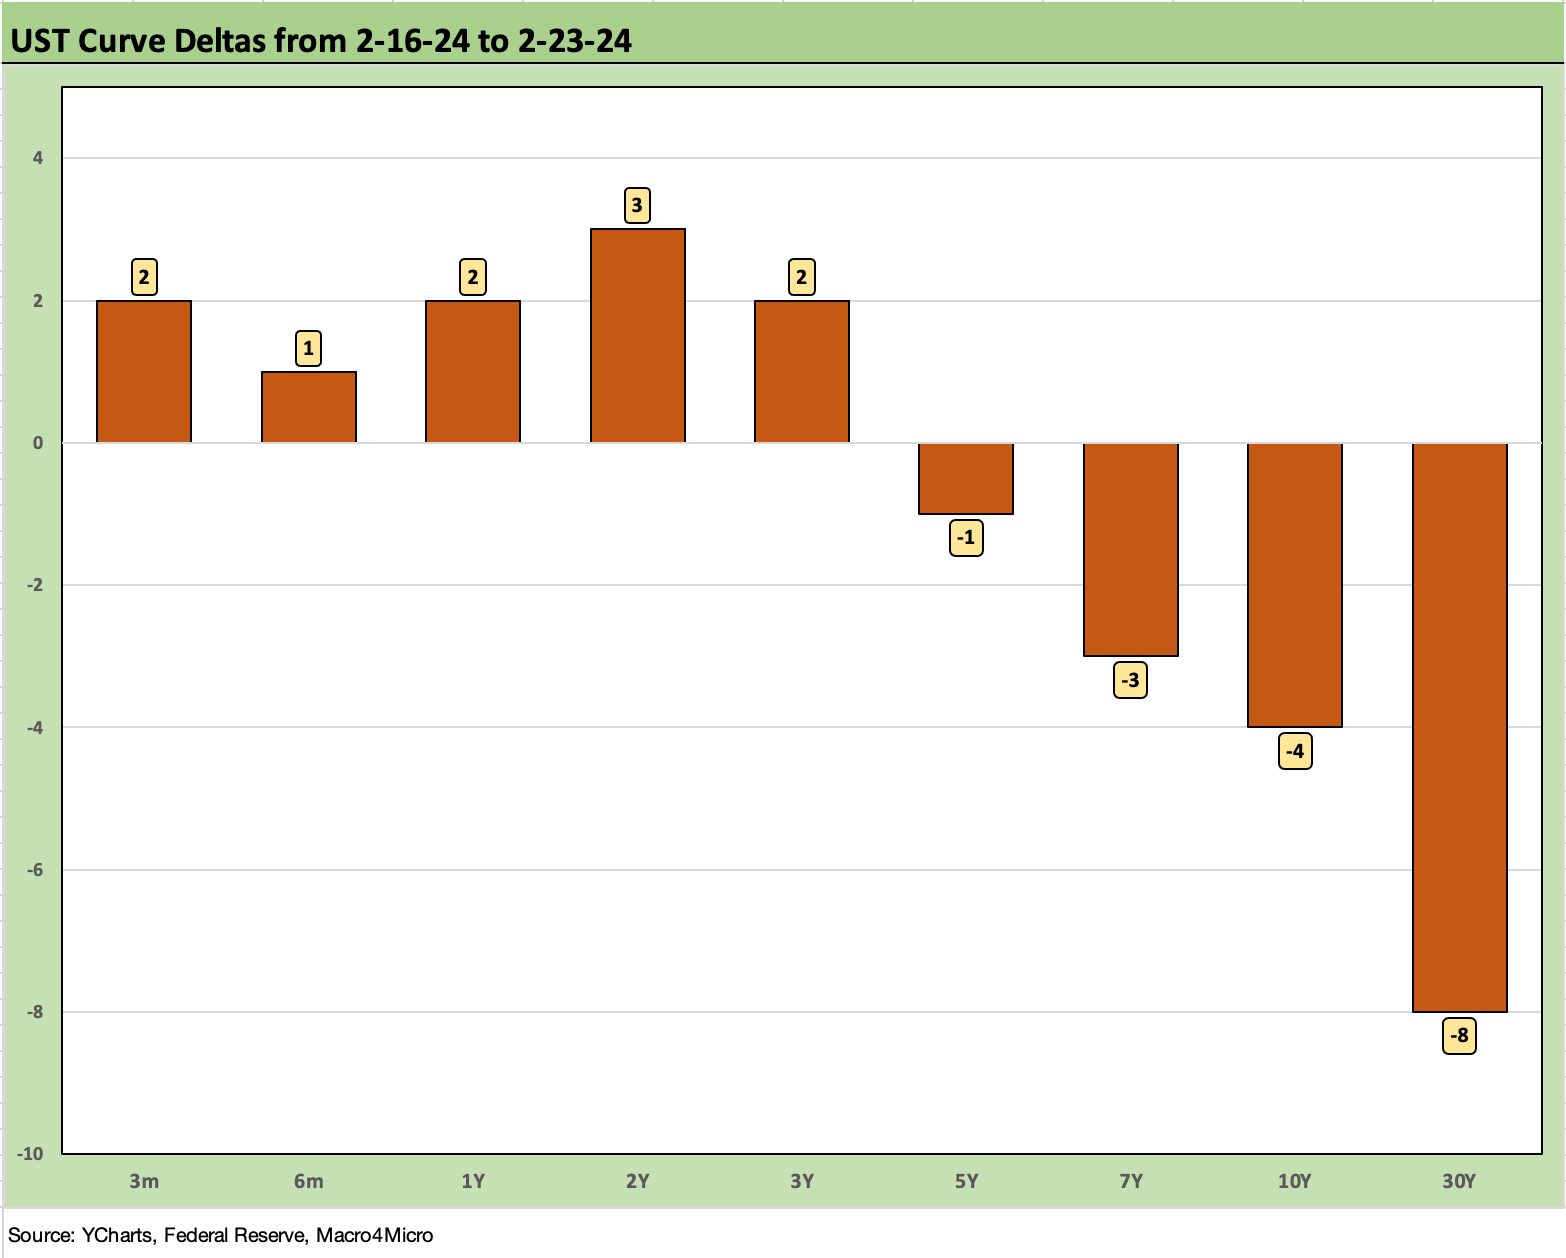
The above chart posts the weekly UST deltas. By recent standards, this past week was a mild one. The biggest move was the 30Y downward delta that rewarded the long duration 20+ Year UST ETF (TLT) as we cover in our separate asset return footnotes publication.
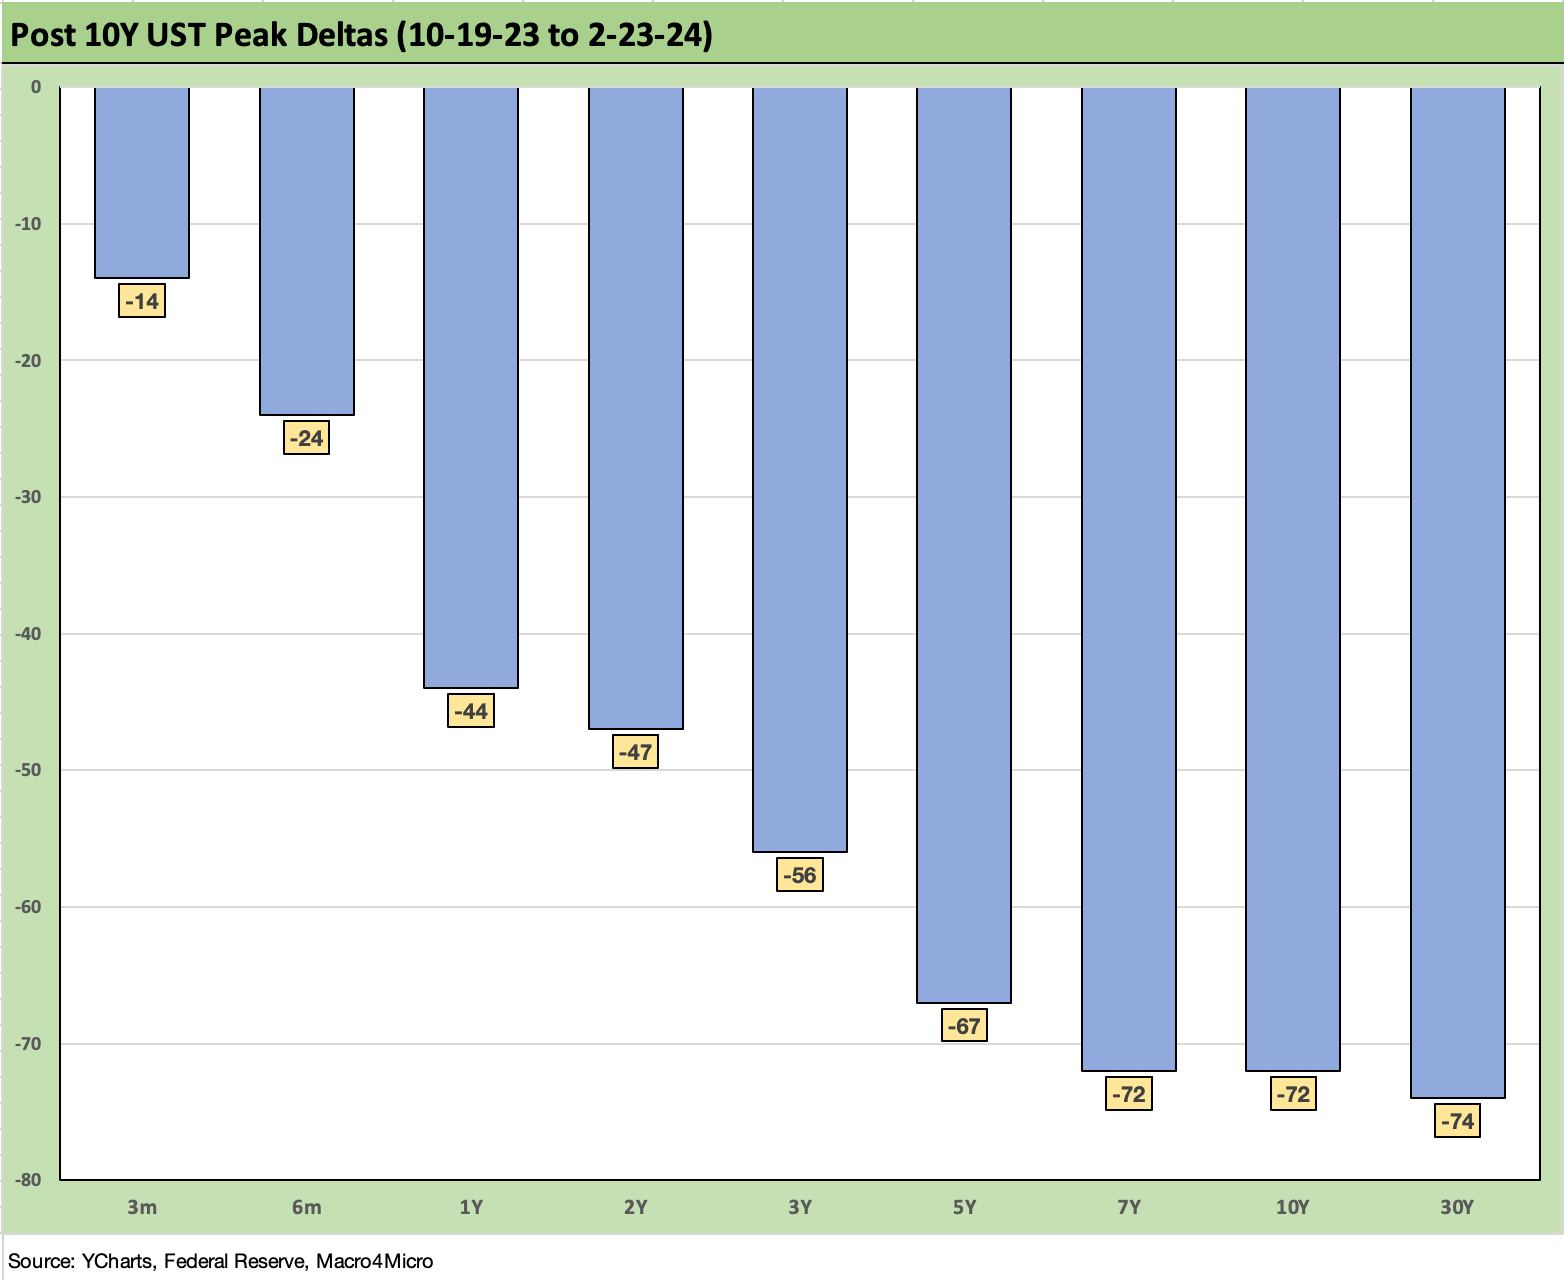
The above chart plots the UST curve delta since the 10Y UST peaked on Oct 19, 2023. There were a few other days that week that could just as easily have been chosen, but this one had the highest close. The main point is it offers a good frame of reference for how much the curve has rallied in 4 months and set off a risk rally in late 2023. The pattern is a bull flattener with the 7Y to 30Y down the most and the 5Y UST not far behind.
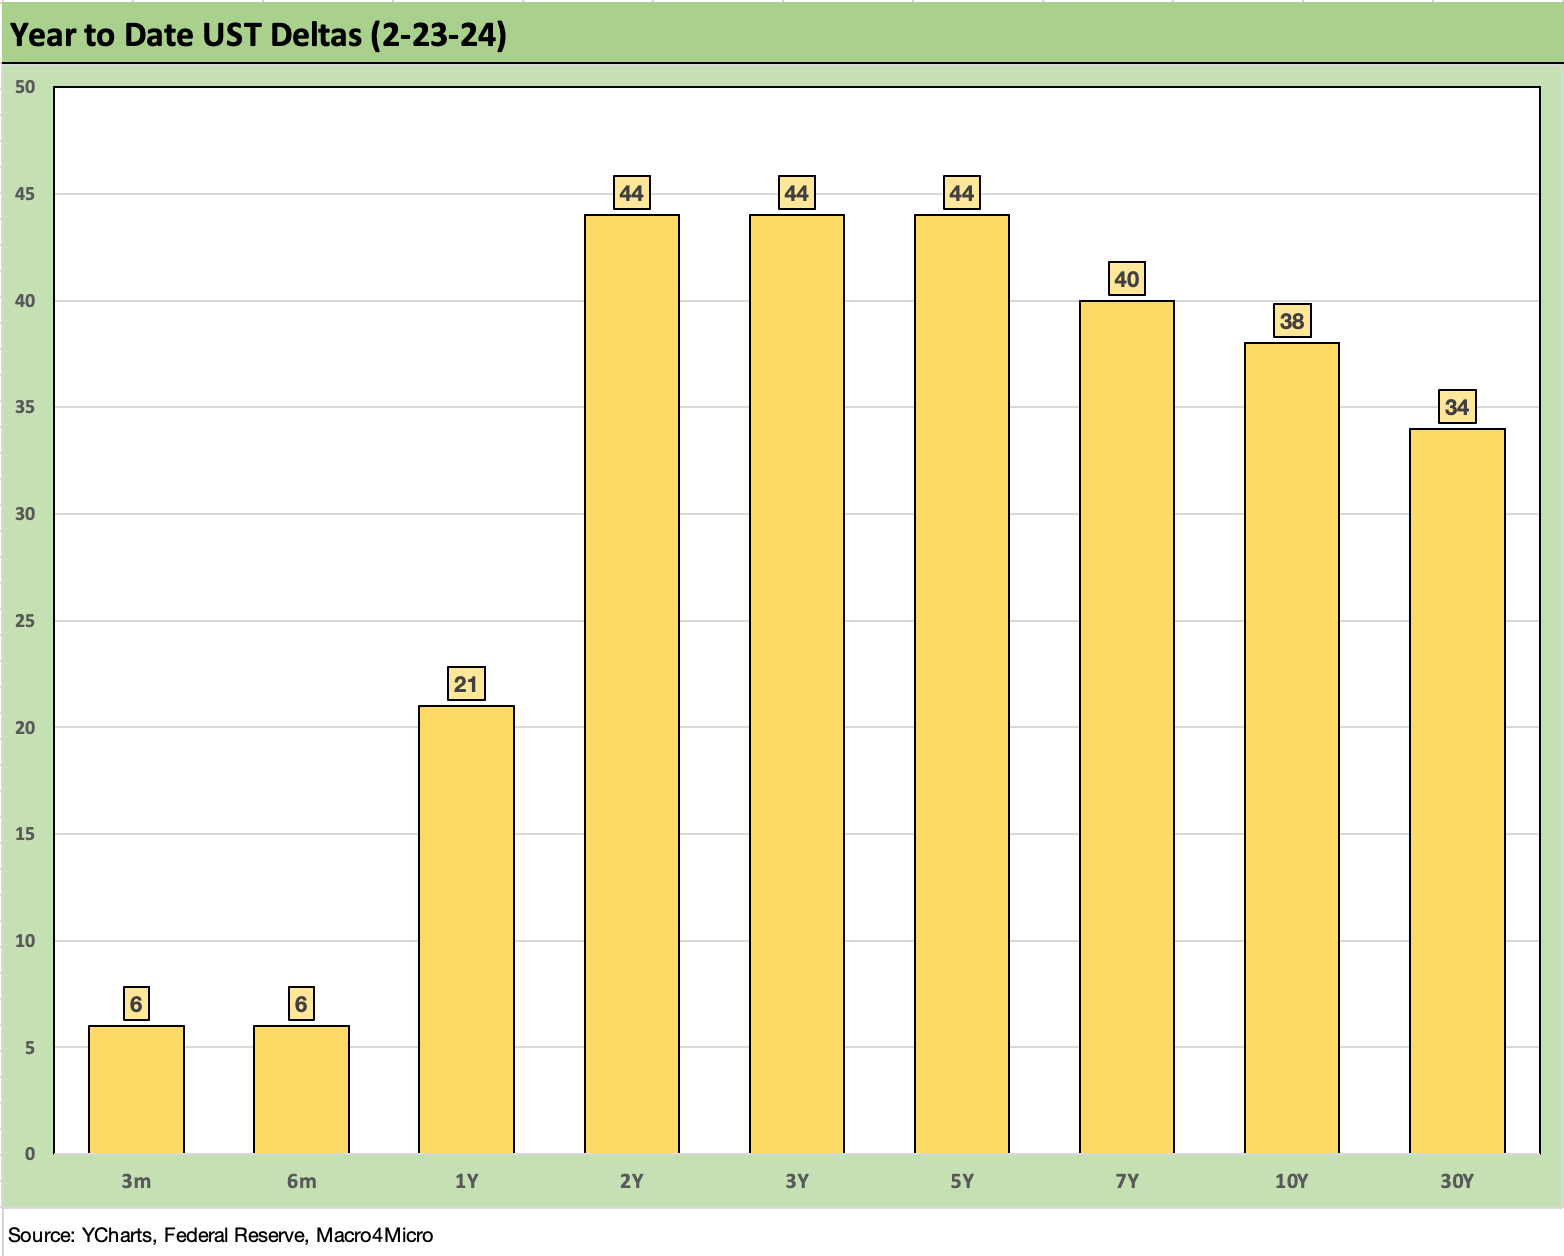
The above chart updates the YTD deltas as stubborn inflation and various other economic releases (see links at bottom) are not making life easy for the Fed or the UST bulls. We cover the issues in detail across our economic release commentary.
This coming week we get updated 4Q23 GDP data (second estimate), Durable Goods, construction data, consumer sentiment and some ISM and housing data, but the star of the show will be the latest PCE inflation data (release on 2-29).
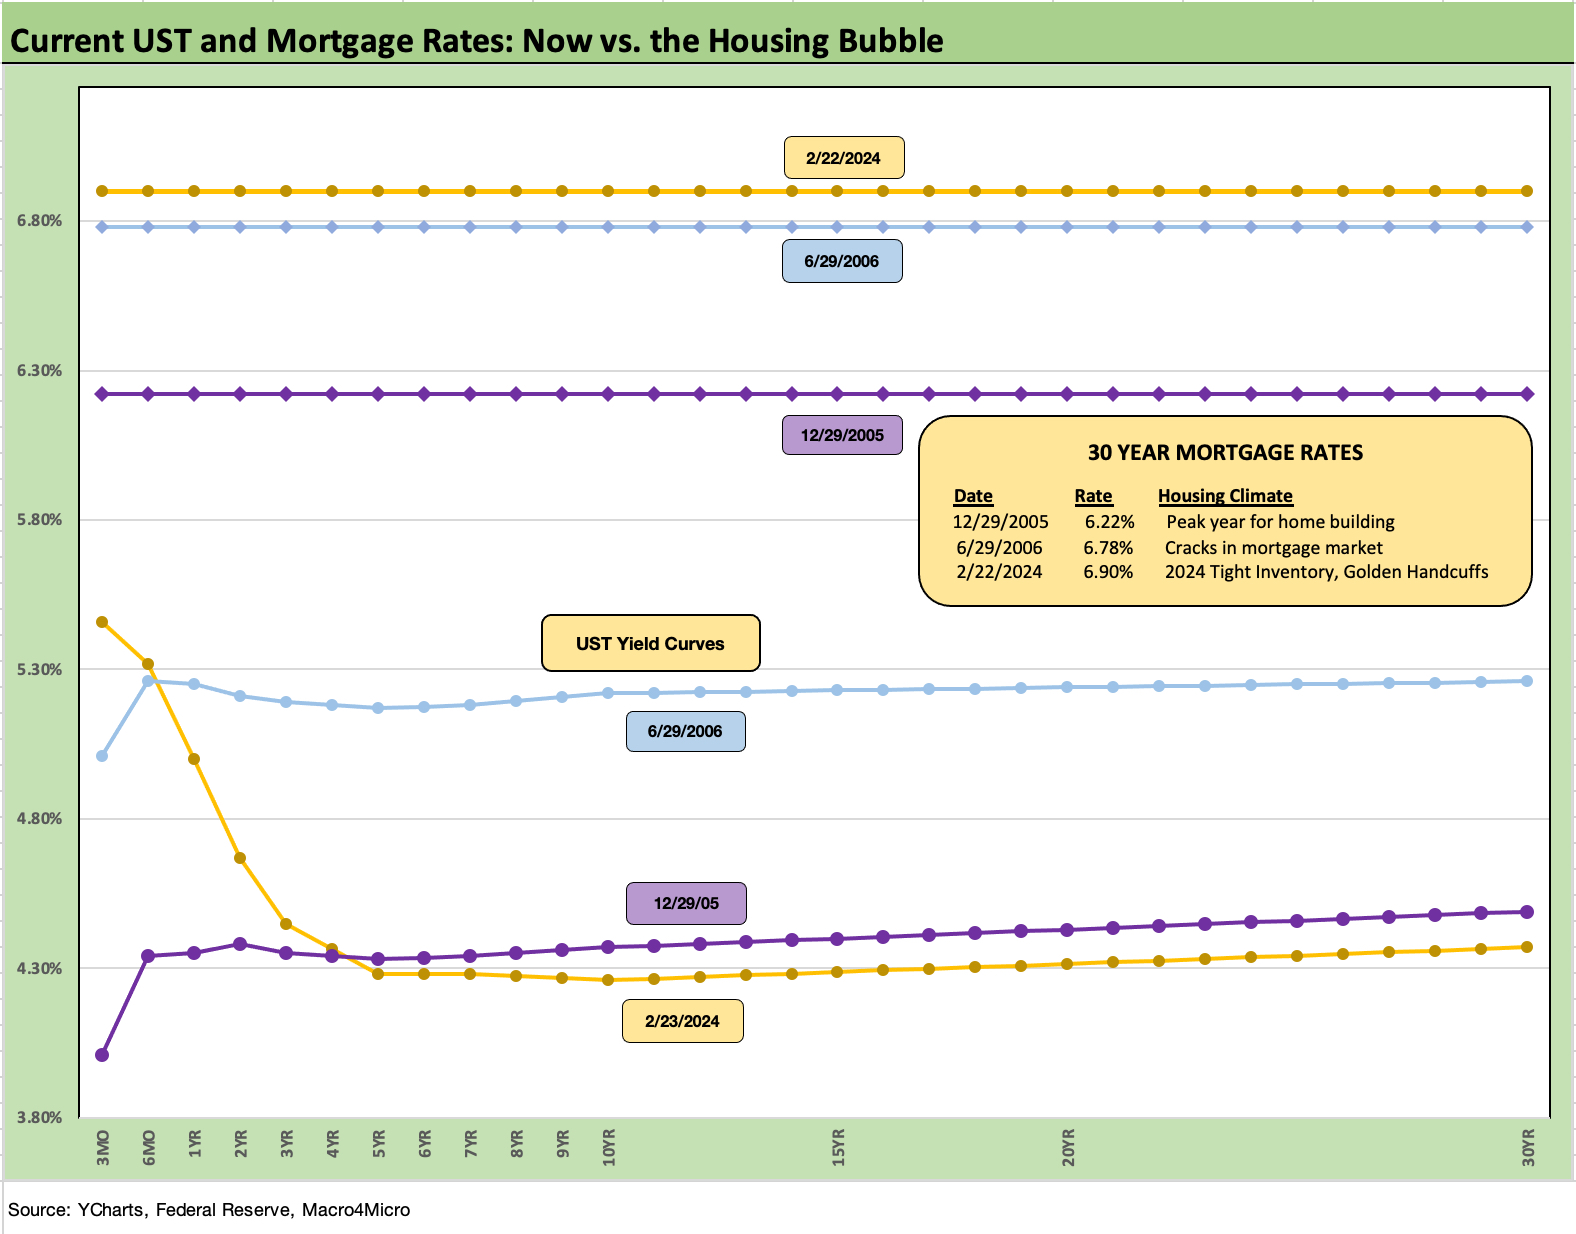
The mortgage trend has been going in the wrong direction this year with last week seeing the Freddie Mac benchmark rise to 6.9% and a broad range of 7% handle mortgage offerings in the market. That has not done much damage to the homebuilders, and we are finally starting to see existing home sales grow on the high end (see Existing Home Sales Jan 2024: High End Climbing, Low End Stagnant 2-22-24). That YoY growth for existing home sales is partly due to easier comps but also recognizes the reality of strong demand and a clear supply shortage.
The chart above follows similar commentary we have covered at length on a comparison of today’s mortgage rates and the UST curve vs. those seen in the peak of the housing bubble back in 2005-2006. The UST curve is lower than 2005 and much lower than 2006 but mortgage rates are a bit higher today.
The sticker shock effect on monthly mortgage rates today relative to home prices has not moved the needle on prices given the golden handcuff effect we have discussed at length in our housing research and how tight inventory has flowed into resilient home prices. The effects have played to the homebuilders’ advantage. This week we will see new home sales data from the Census that details the growing market share held by homebuilders in the total home sales picture.
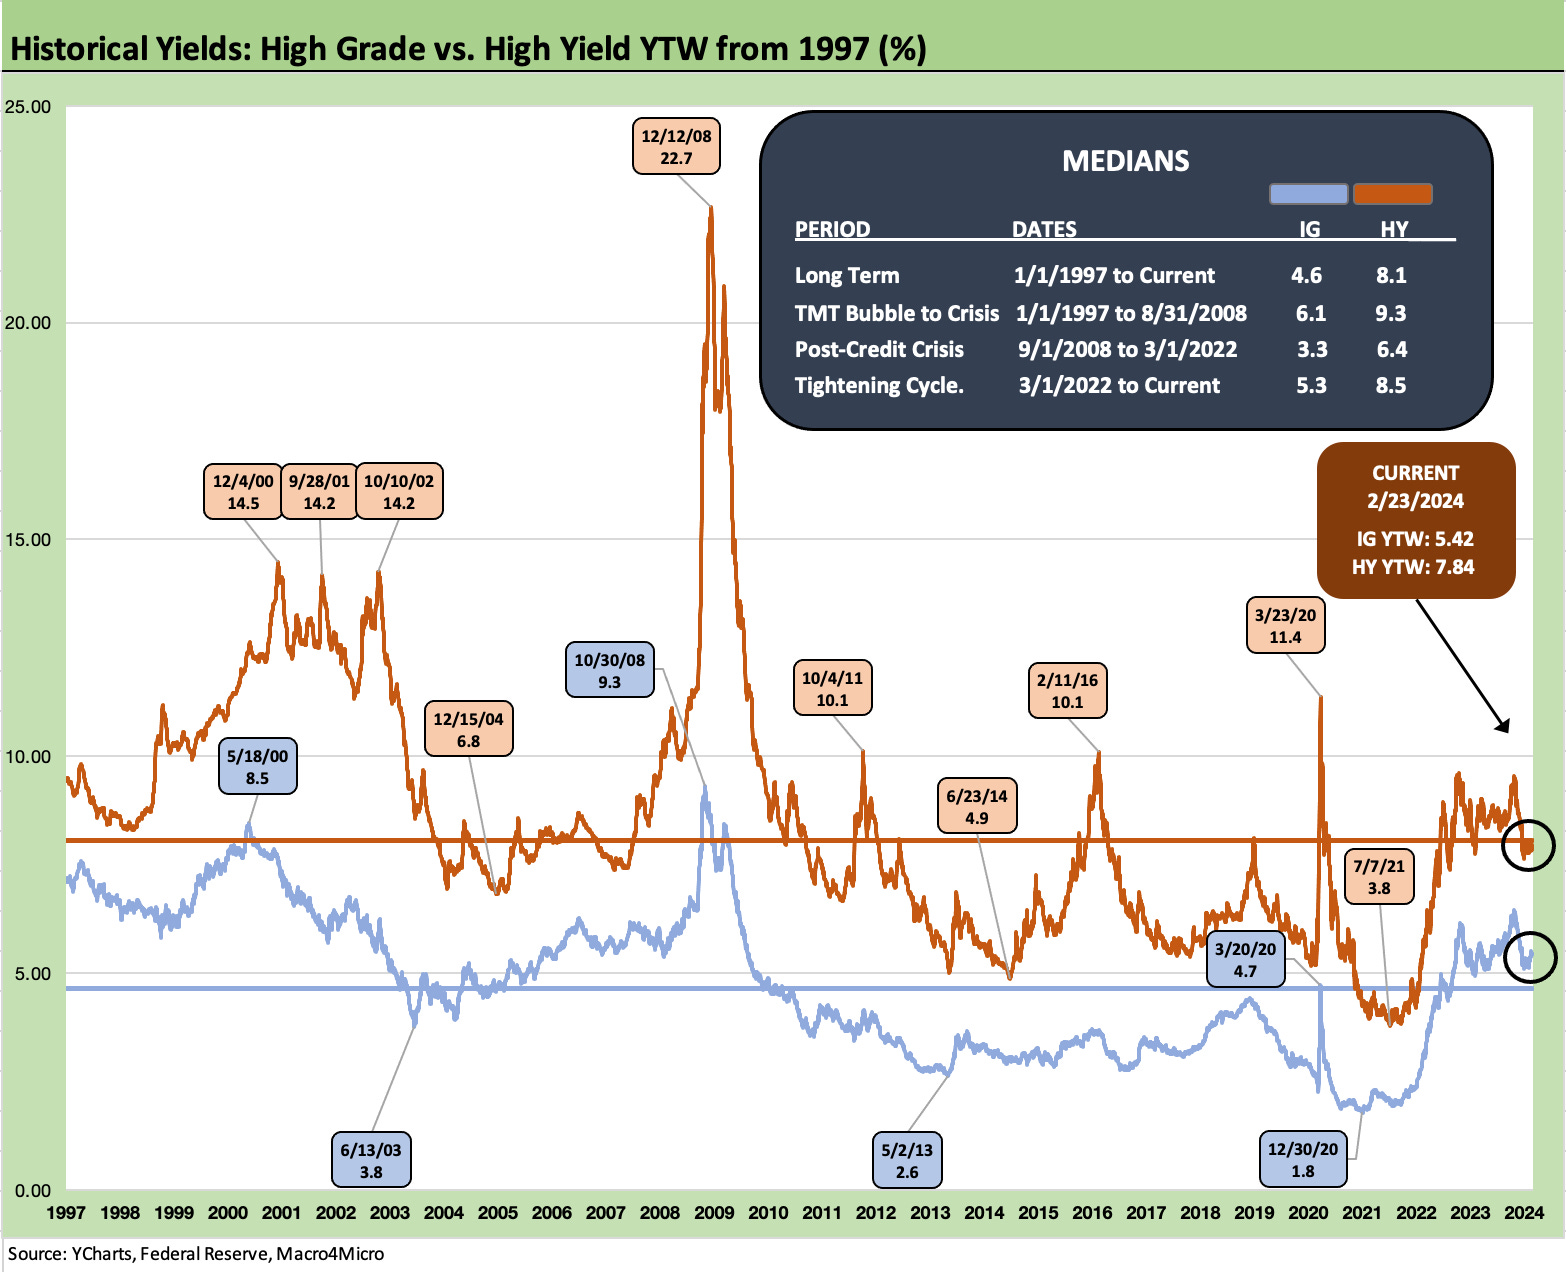
The above chart updates the long-term time series for the IG index and the HY index. As noted in the median box, the current 4.52% for IG is above the long-term median on the lower UST rates seen in the protracted ZIRP years. We see lower IG yield today vs. the pre-crisis years median of 6.1%. Today has lower UST rates and tighter average spreads than the pre-crisis, pre-ZIRP years.
HY at 7.84% is slightly below the median of 8.1%. The pre-crisis and pre-ZIRP median is 9.3%, so we see the distorting impact of the years of ZIRP and QE and an extended recovery (longest in history) from the June 2009 trough to the end of the expansion with the Feb 2020 peak and the COVID economic pain of March 2020/April 2020.
We look at the current yield in HY and IG vs. past credit cycle peaks in the following charts.
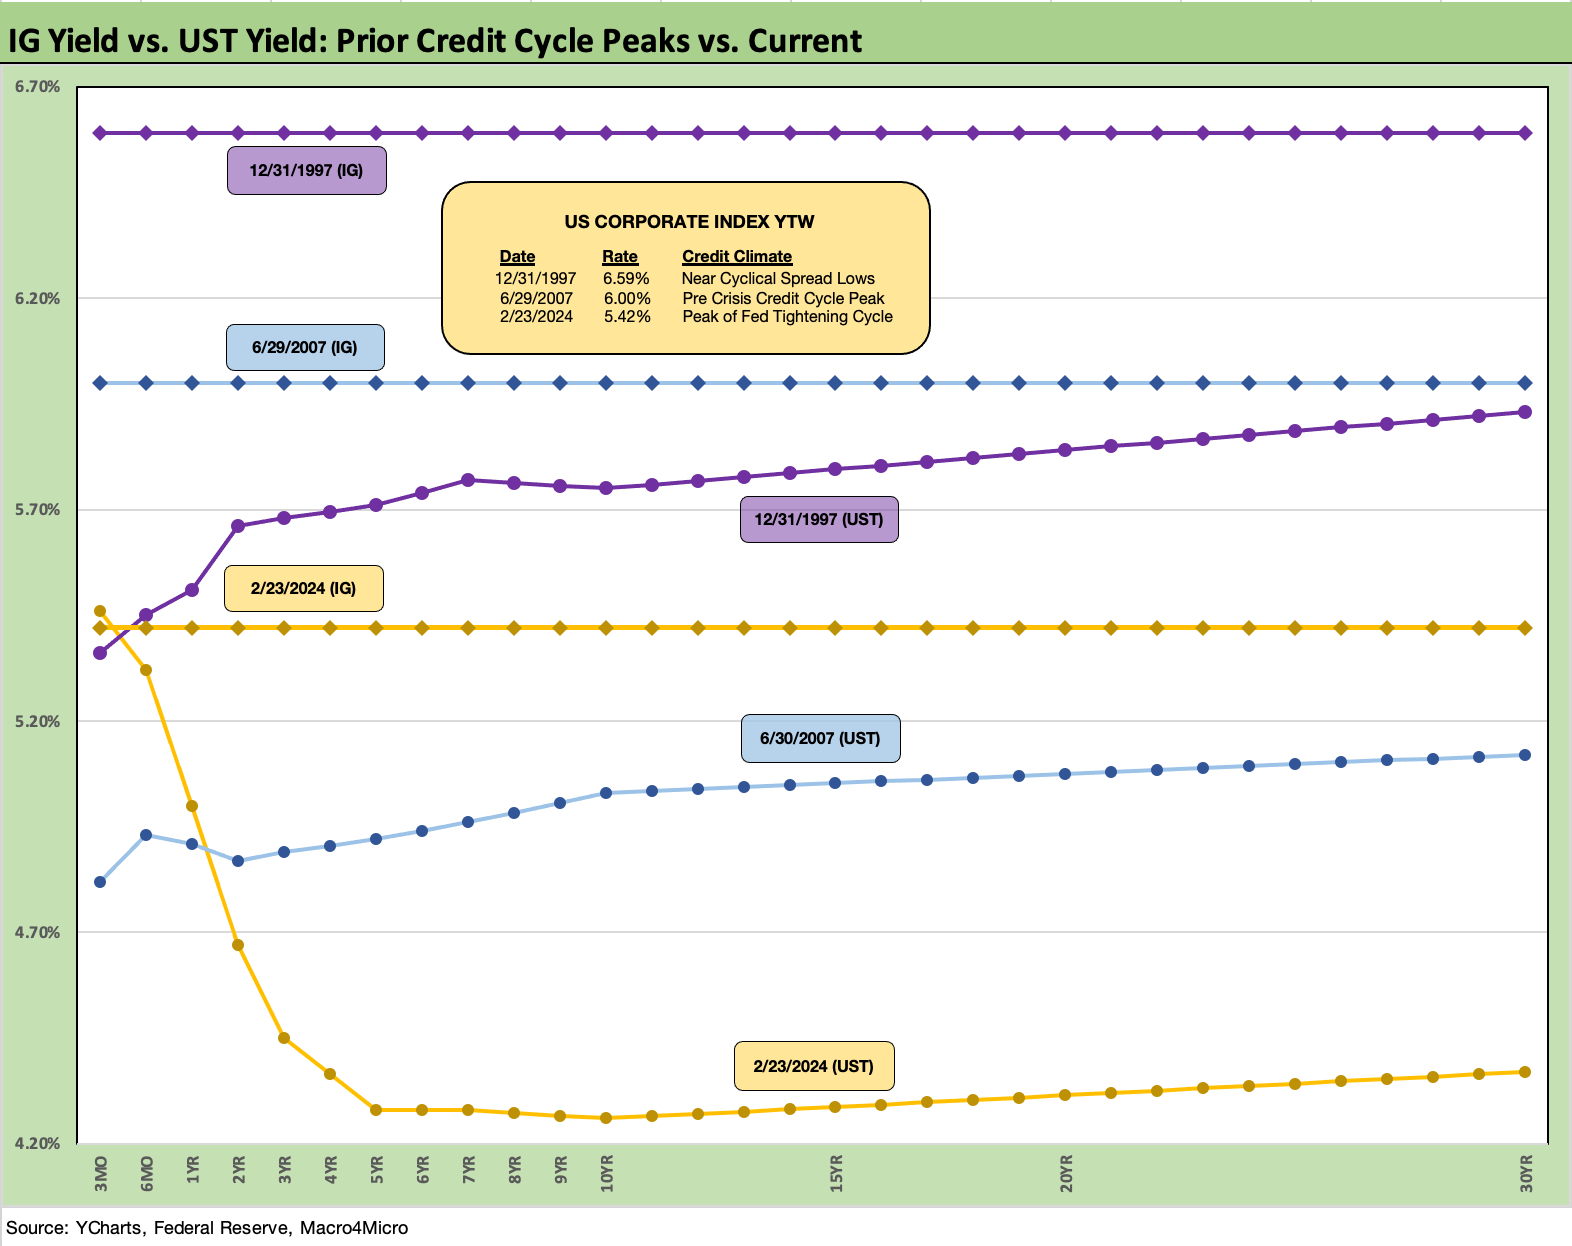
The above chart frames the IG index and UST curve today vs. those posted in the 2007 and 1997 credit cycle peaks. The UST curve is much lower today, and the all-in yields are also lower on the basis of compressed spreads close to those seen in the 1997-1998 average and the late 1997 IG OAS levels. We also see spreads in the same area as June 2007.
We revisit historical spreads in these prior credit cycle peaks in our year end recap (see Footnotes & Flashbacks: State of Yields 1-1-24).
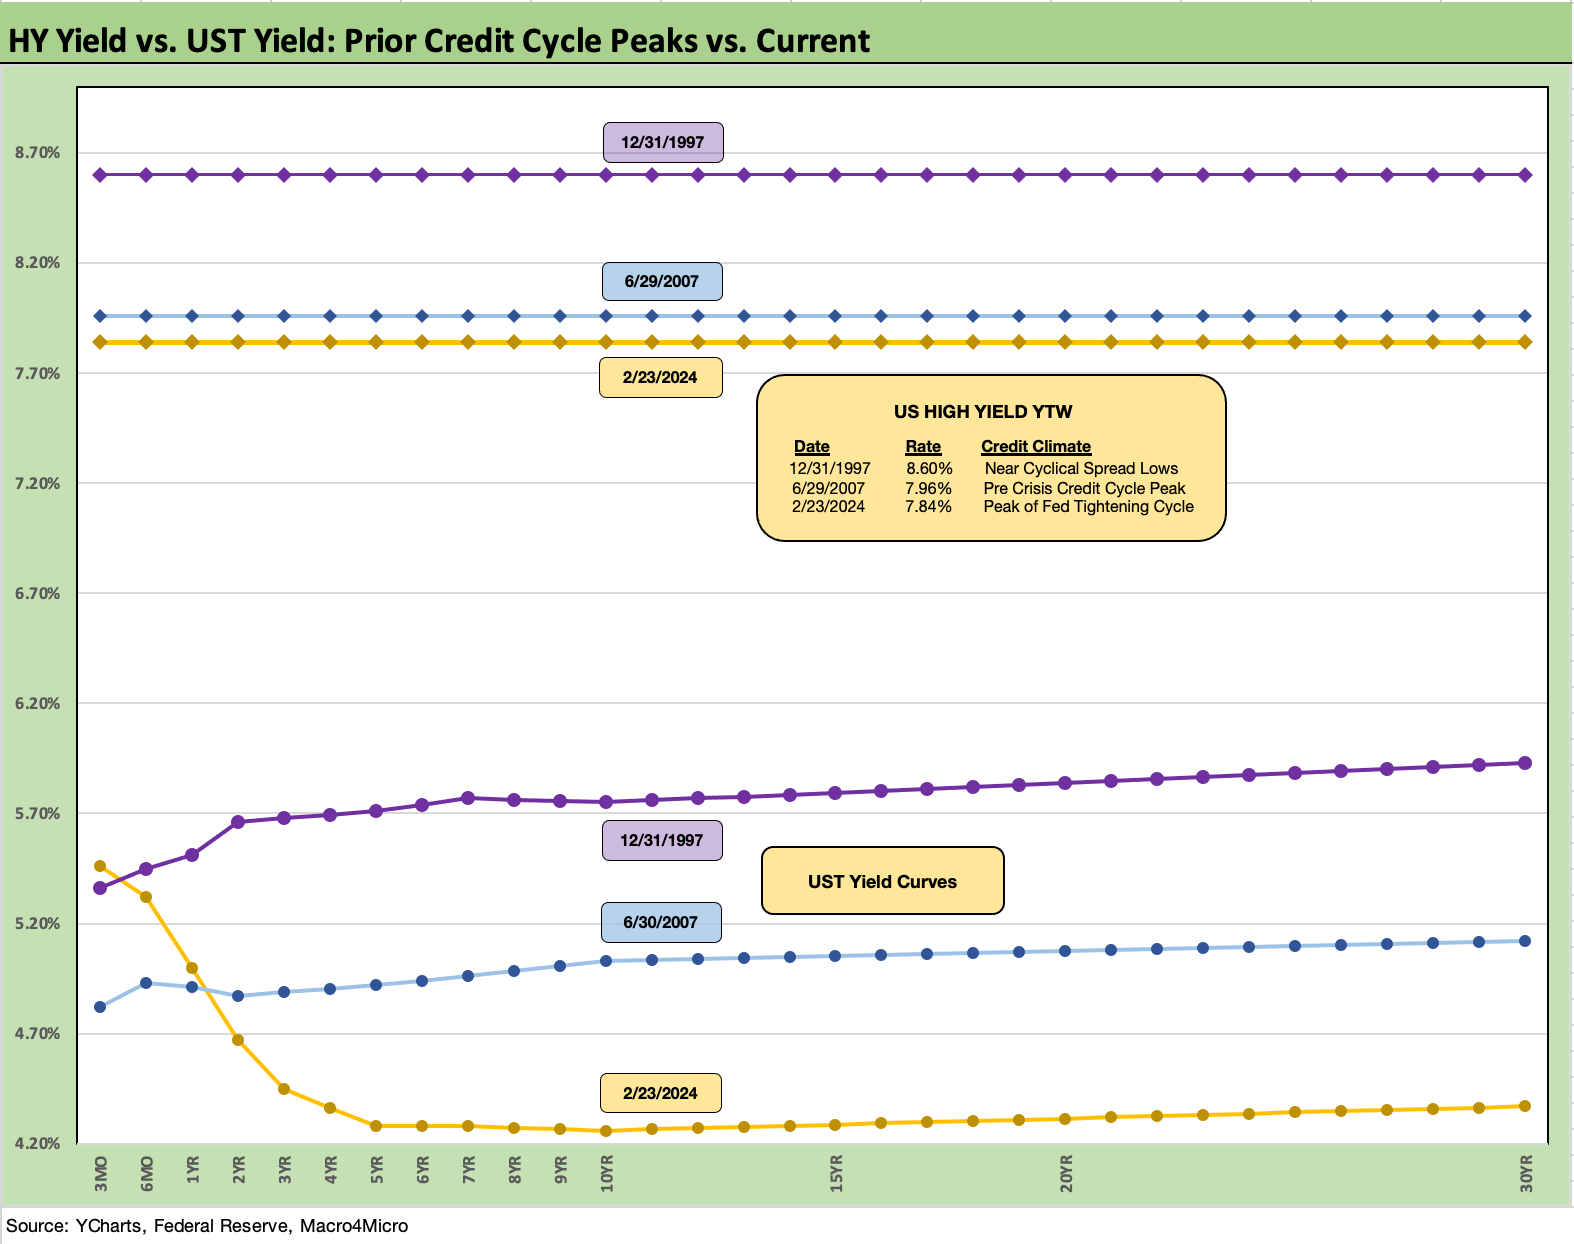
The above chart does the same exercise as the prior IG chart except we look at HY all-in yields for the same periods. HY index yields today are slightly below those seen in late June 2007 and more notably lower than 1997 when the UST curve was meaningfully higher than today.
Spreads keep tightening in HY YTD with the HY OAS of +323 bps on Friday now below the first cyclical lows of June 2014 (+335 bps on 6-23-14) but still above the later cyclical lows of early 2018 (+316 bps on 10-3-18). The low HY spreads of Oct 1997 and June 2007 pushed below the +250 bps line.
We revisit historical spreads in these prior credit cycle peaks in our year end recap (see Footnotes & Flashbacks: State of Yields 1-1-24).
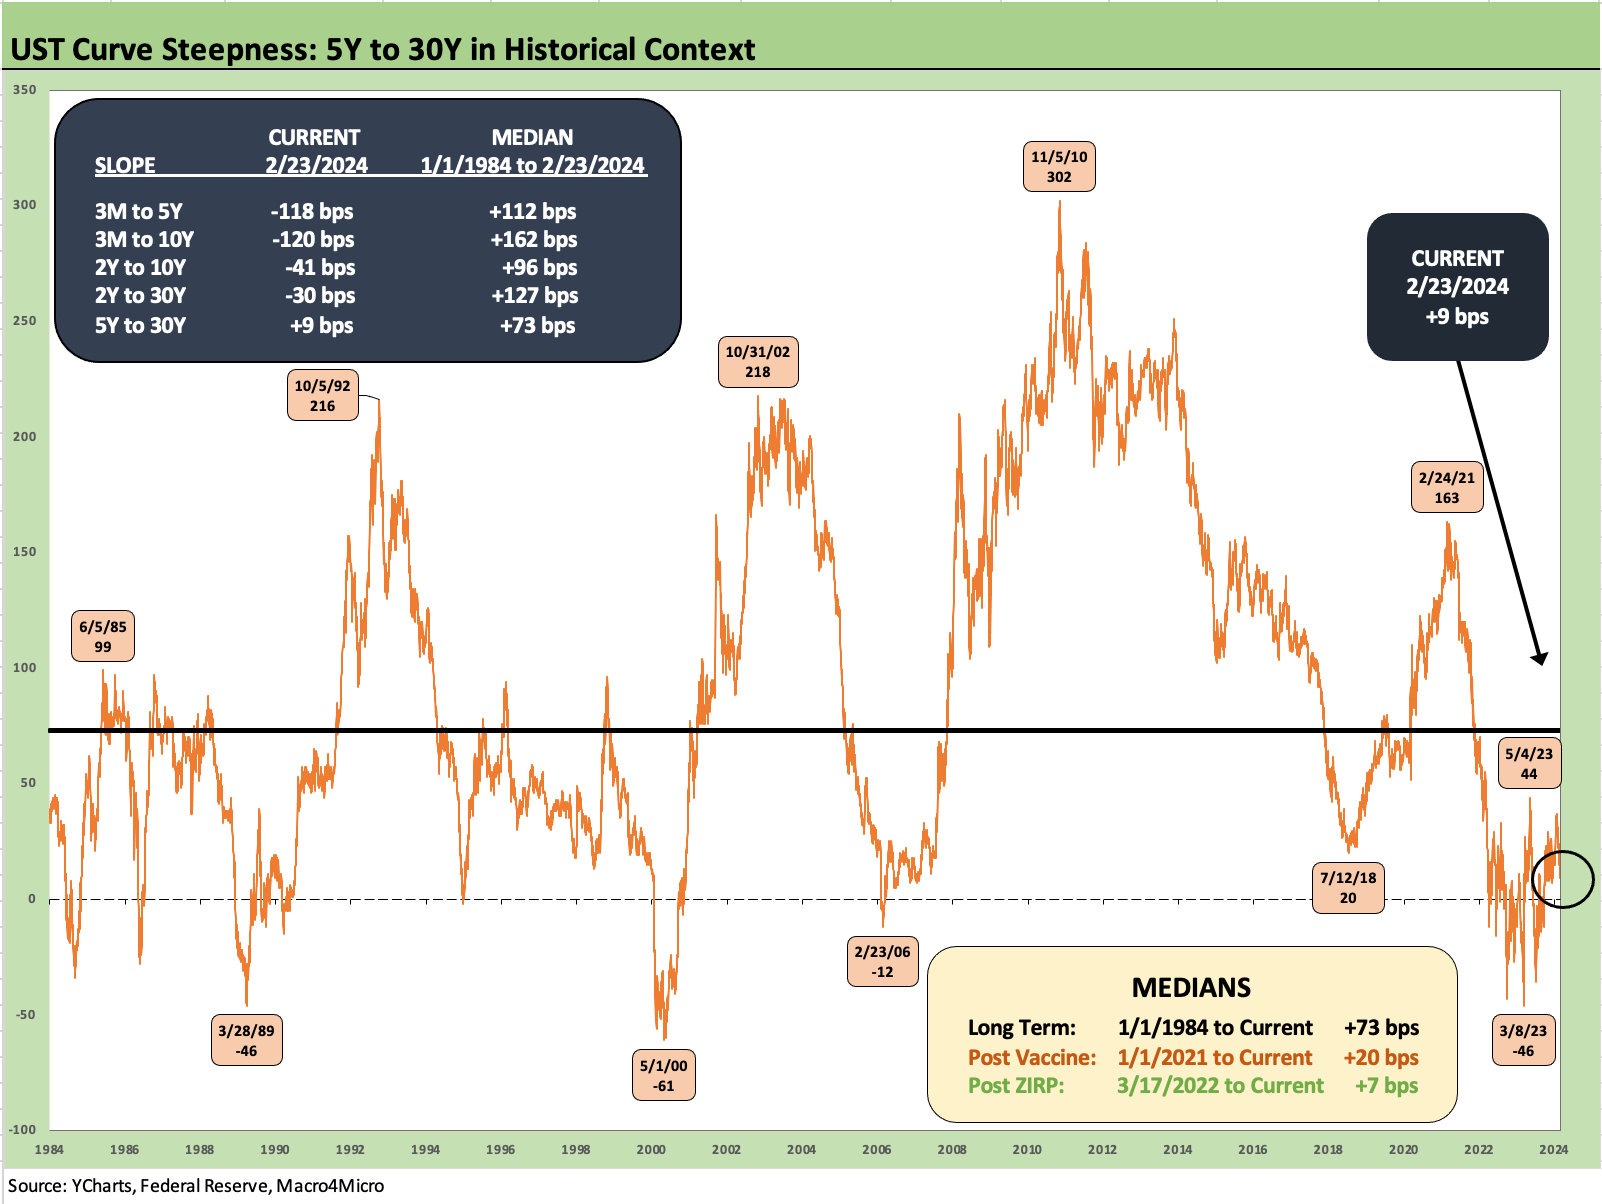
The above chart updates the long-term UST slope timelines for the 5Y to 30Y. This segment slope is a useful metric for considering what (or whether) you get paid for extension risk in term premiums. We update the more complete range of UST segment slopes in the box within the chart with long term medians.
The long-term median slope is upward sloping at +73 bps. In this market, you are only getting +9 bps. The median from the start of 2021 is +20 bps as we break out in the next chart. The current slope is at least upward sloping after being inverted by -46 bps in March 2023.
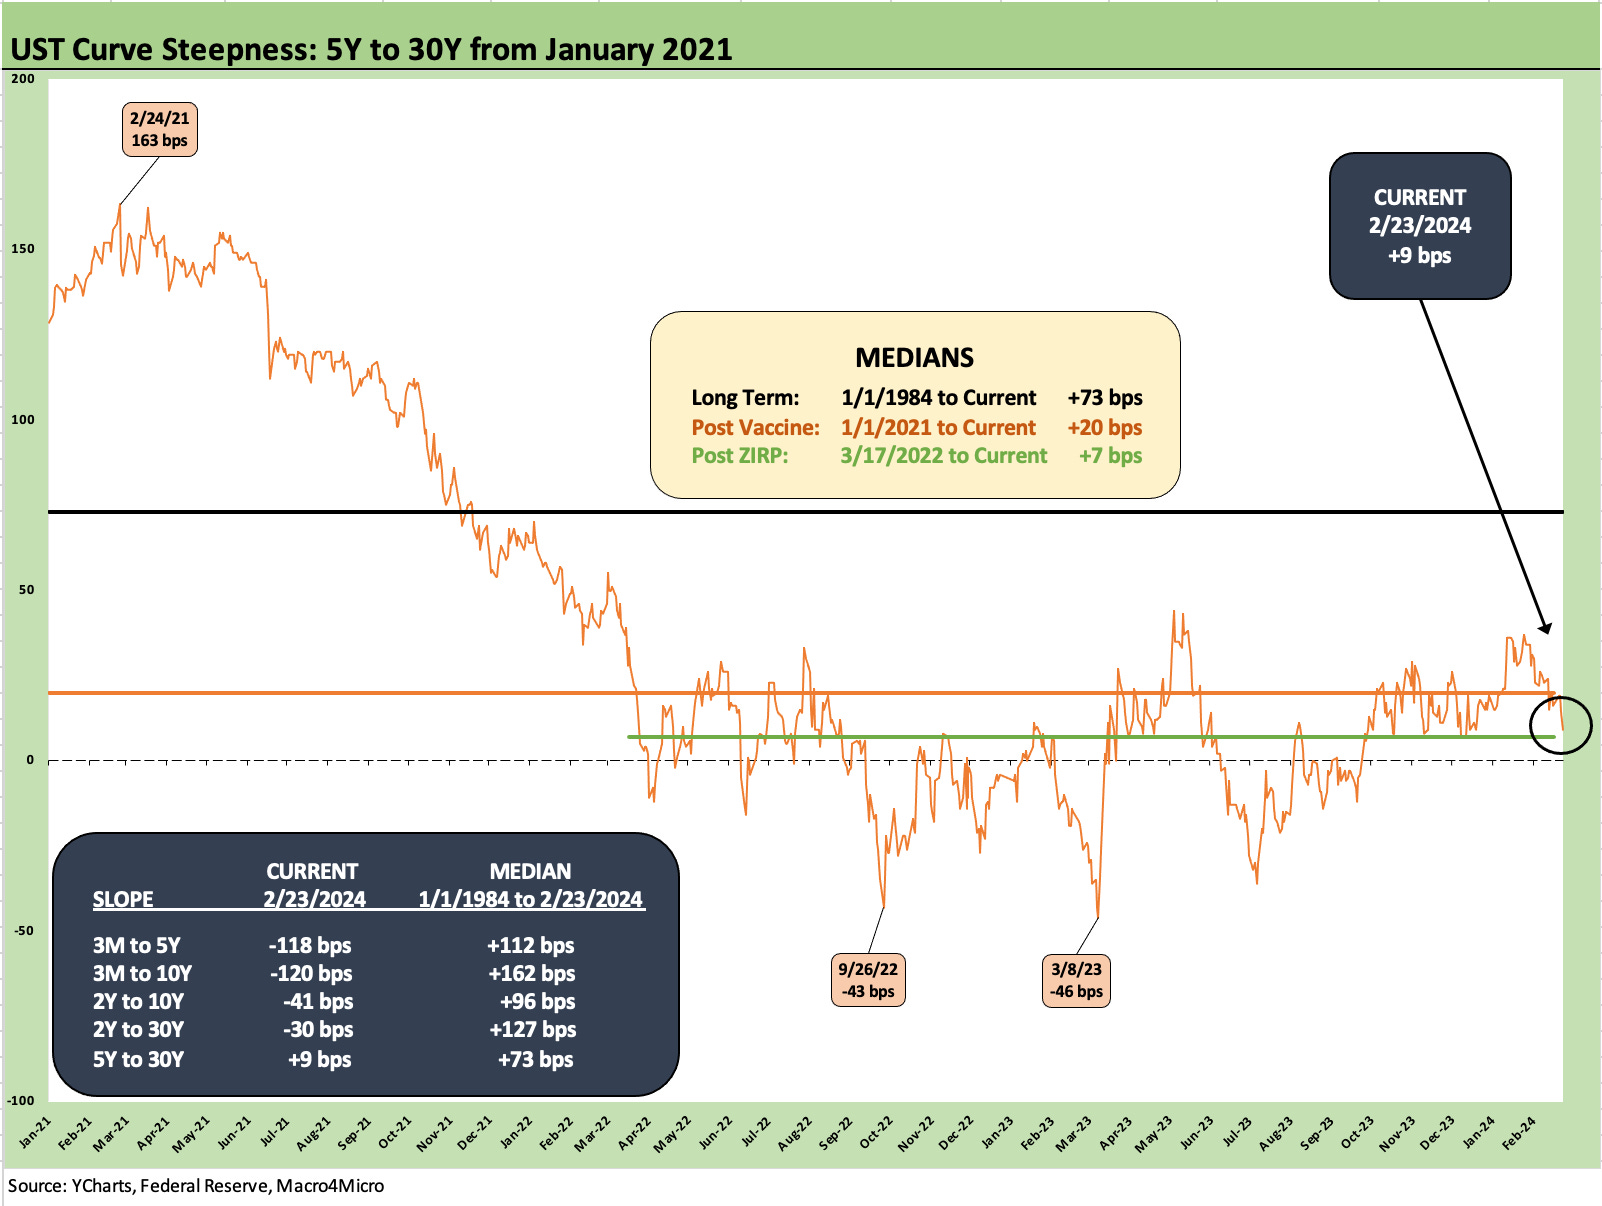
The above chart updates the shorter term timeline, and we see the swings from an upward sloping shape in 2021 and a peak of +163 bps in Feb 2021 down to the inversions of the 5Y to 30Y during the tightening cycle.
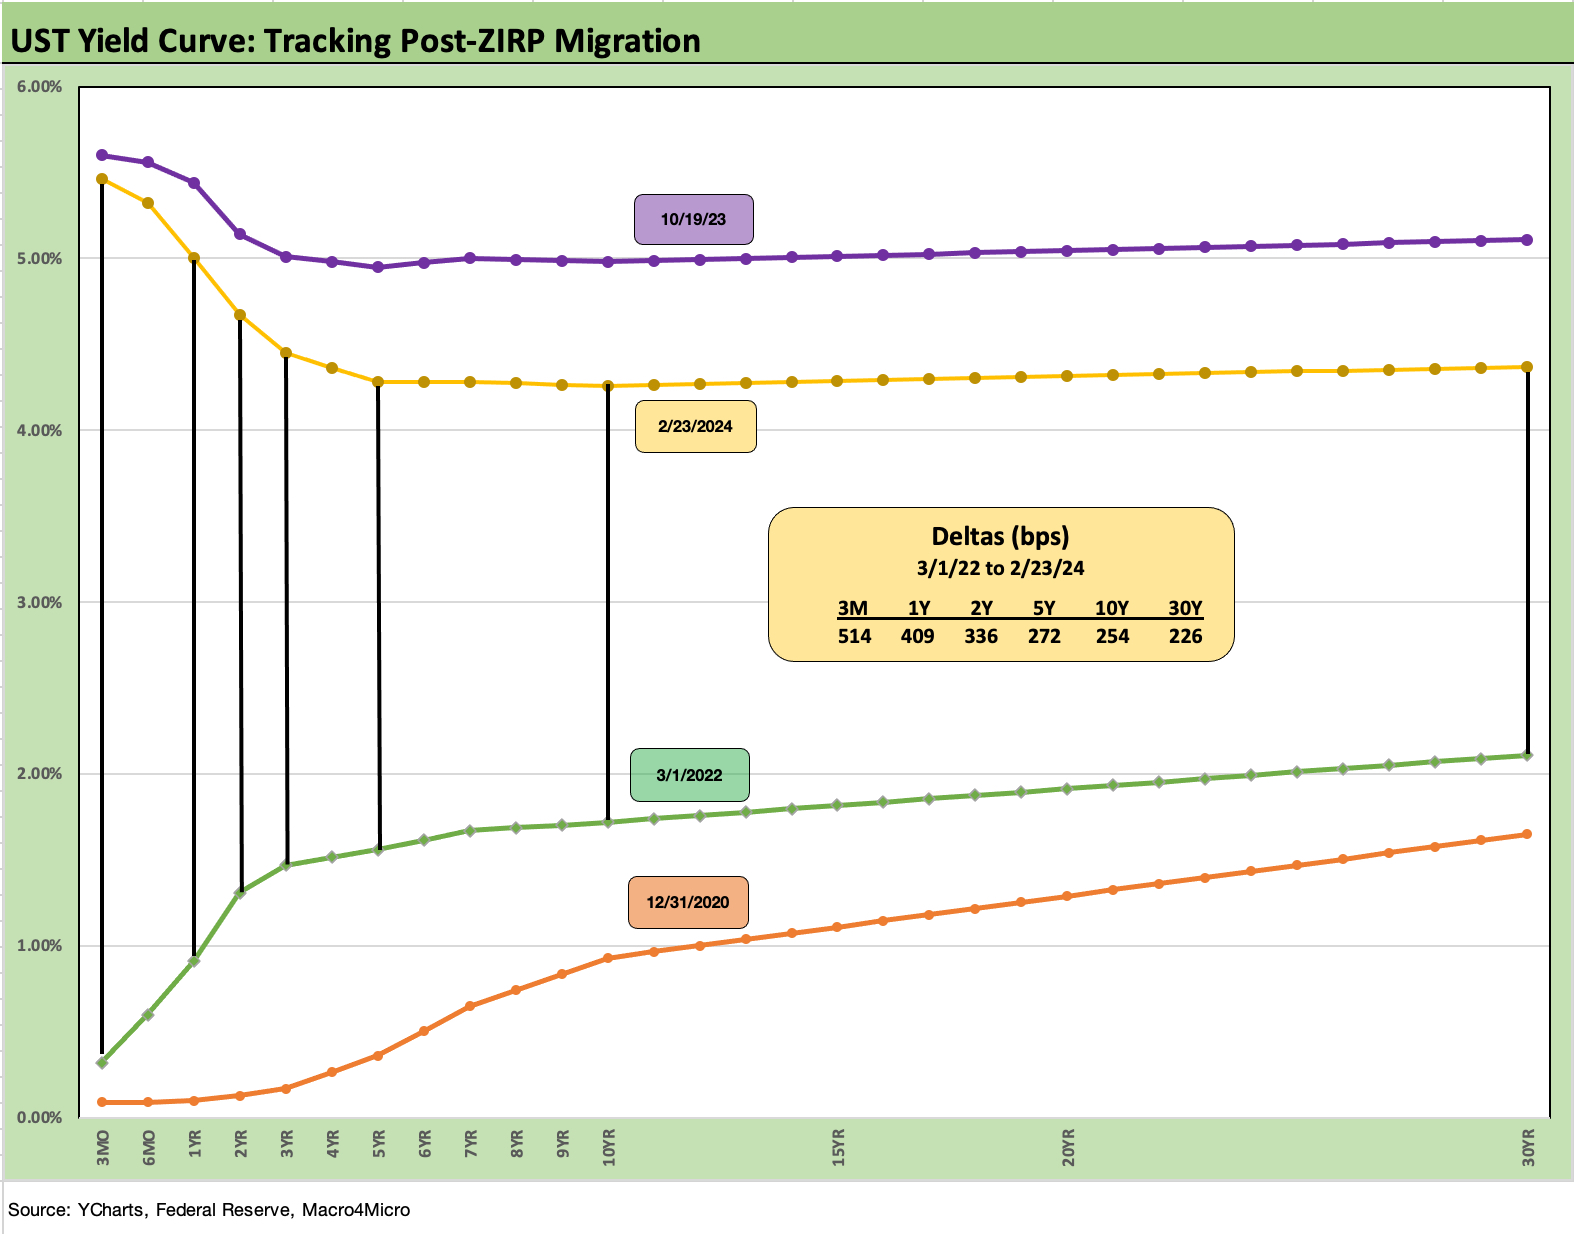
We wrap up with our usual final chart that breaks out the UST deltas from the start of March 2022 through current times. We include a 12-31-20 UST curve as a frame of reference and UST curve from the date of the 10Y UST peak (10-19-23).
The UST deltas detail the UST moves from the ZIRP years through today in a pattern that in the end is a bear inversion with +513 bps in 3M UST, +409 bps in 1Y, +336 bps in 2Y, +272 bps in 5Y, +254 in 10Y, and +226 in 30Y.
See also:
Existing Home Sales Jan 2024: High End Climbing, Low End Stagnant 2-22-24
BB vs. CCC: Quality Spread Differentials, Yield Relationships, Relative Returns 2-20-24
Housing Starts Jan 2024; Slow…Curve Ahead? 2-16-24
Industrial Production: Capacity Utilization Limps Along 2-15-24
Retail Sales Jan 2024: Balancing Act Continues 2-15-24
Jan 2024 CPI: The Big 5, Add-ons, and Favorite “CPI-ex” Indexes 2-13-24
Trade Flows 2023: Trade Partners, Imports/Exports, and Deficits in a Troubled World 2-10-24
Fed Funds vs. PCE Inflation: Peaks and Valleys Across Time 2-7-23
HY vs. IG: Quality Spread Differentials and Comparative Returns 2-6-24
BBB vs. BB: Revisiting the Speculative Grade Divide Differentials 2-5-24
Payroll Jan 2024: Big Swing 2-2-24
Productivity: Takes the Edge off the 4% Handle YoY ECI 2-1-24