KB Home: Credit Profile
We take an in-depth look at KB Home as a microcosm of what is going on with the mid-sized public builders.
KBH is in the BB tier below the growing BBB cluster of larger cap builders with KBH putting up improving credit metrics as the housing market turns up.
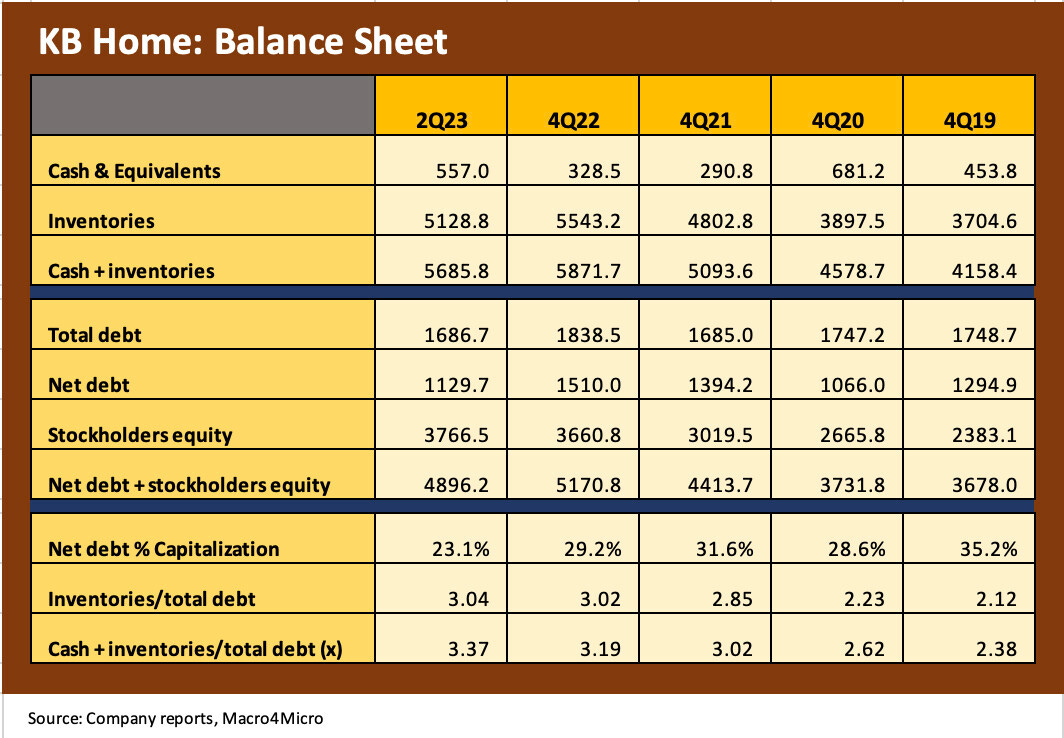
KBH’s 2Q23 performance showed mild erosion in gross margins but improvement in liquidity, asset coverage and balance sheet metrics as it rolls further into peak selling season.
The slight shift of policy toward more spec building from its traditional (and continuing) focus on built-to-order is still a lower risk game plan in this market and a competitive necessity given the strategies of major competitors.
Total deliveries ticked higher in YoY for 1H23 and 2Q23 comps with the erosion of West Coast volumes and prices running alongside healthy trend lines in other geographic regions.
The performance of the major builders has been remarkably strong considering all the moving parts of mortgage rates and tightening credit standards. The performance of builders in the equity markets across most of 2022 and into 2023. That has been a wakeup call on the relative cyclical positioning of the builders, who in fact show lower industry risk profiles vs. other cyclical sectors.
Among the positive operating developments, KBH posted its first sequential growth in backlog in the past year with 3 of 4 operating regions showing YoY increases in deliveries and ASPs for 2Q23 and 1H23. The critical West Coast segment was the major exception.
Below we frame KBH equity performance from a few different angles. The market has been happy with the results. On a disclosure note, I do not own any KBH stock or bonds. I do own D.R. Horton and Lennar as long-term holdings. As the #1 and #2 bellwethers in homebuilding, DHI and LEN offer high-quality, lower financial risk profiles and both have driven deeper into more aspects of the housing markets via their broader mix of business lines. Many of the positive attributes that apply to them are relevant to KBH in their core operations.
We like KBH from a credit perspective with upside potential in ratings and vs. mid to upper BB tier names outside of housing that also feel the impact of cyclical trends. It was not long ago that homebuilders were weighted at BB. We now see the largest builders housed in the investment grade realm with a half dozen in the BBB tier and IG index. KBH could join them in the next cyclical upswing, but upgrades to at least high BB composite are deserved before then.
With the balance sheet profile and resilient cash flows evidenced at KBH, we see the name as well positioned and certainly if rates do in fact trend lower given the advantage of the supply-demand balance even in a down cycle.
A view from the equity side of the world…
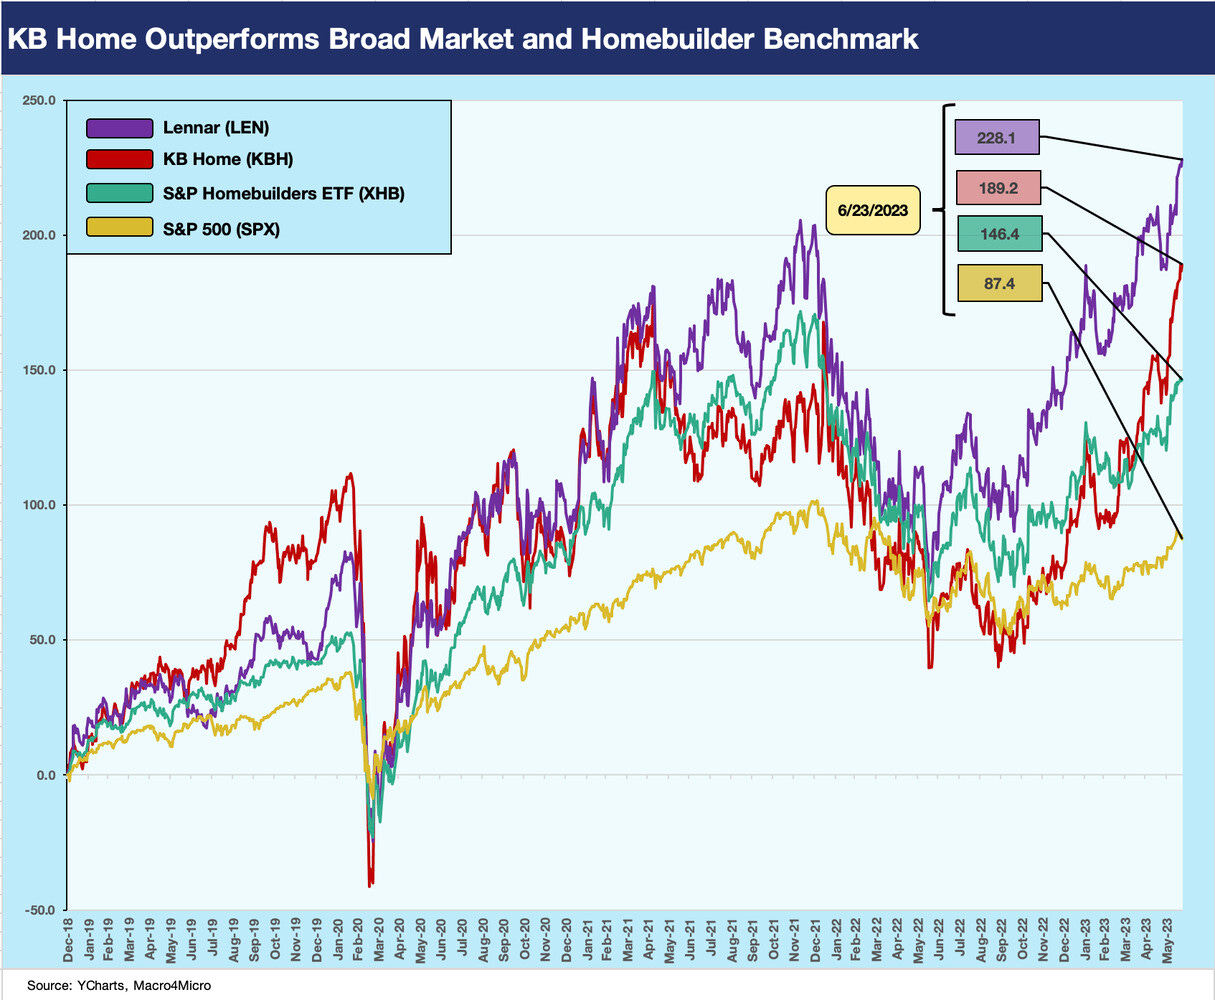
Below we run through some stock performance trends that KBH in broader industry and market context. KBH stock has been a very strong performer.
The above chart plots KBH vs. LEN, the homebuilding ETF (XHB, which includes suppliers) and the S&P 500. We start the time horizon at the beginning of 2019 with rates low and the fed easing in the face of slowing growth later in 2019. As a reminder, Dec 2018 marked the last Fed hike.
Lennar is a useful comp given its average selling price (LEN at $449K in 1H23 vs. KBH at $479K) and regions of operations. We like to highlight one of the industry leaders in such comp charts, and KBH is more similar in mix and regional exposure to Lennar than D.R. Horton (see D.R. Horton: Credit Profile 4-4-23) even if just on the California presence. The XHB ETF is a good frame of reference for the peer group with the constituents including a group of builders and suppliers tied to the homebuilding cycle. As noted, KBH outperformed the XHB group and dwarfed the S&P 500 over the timeline.
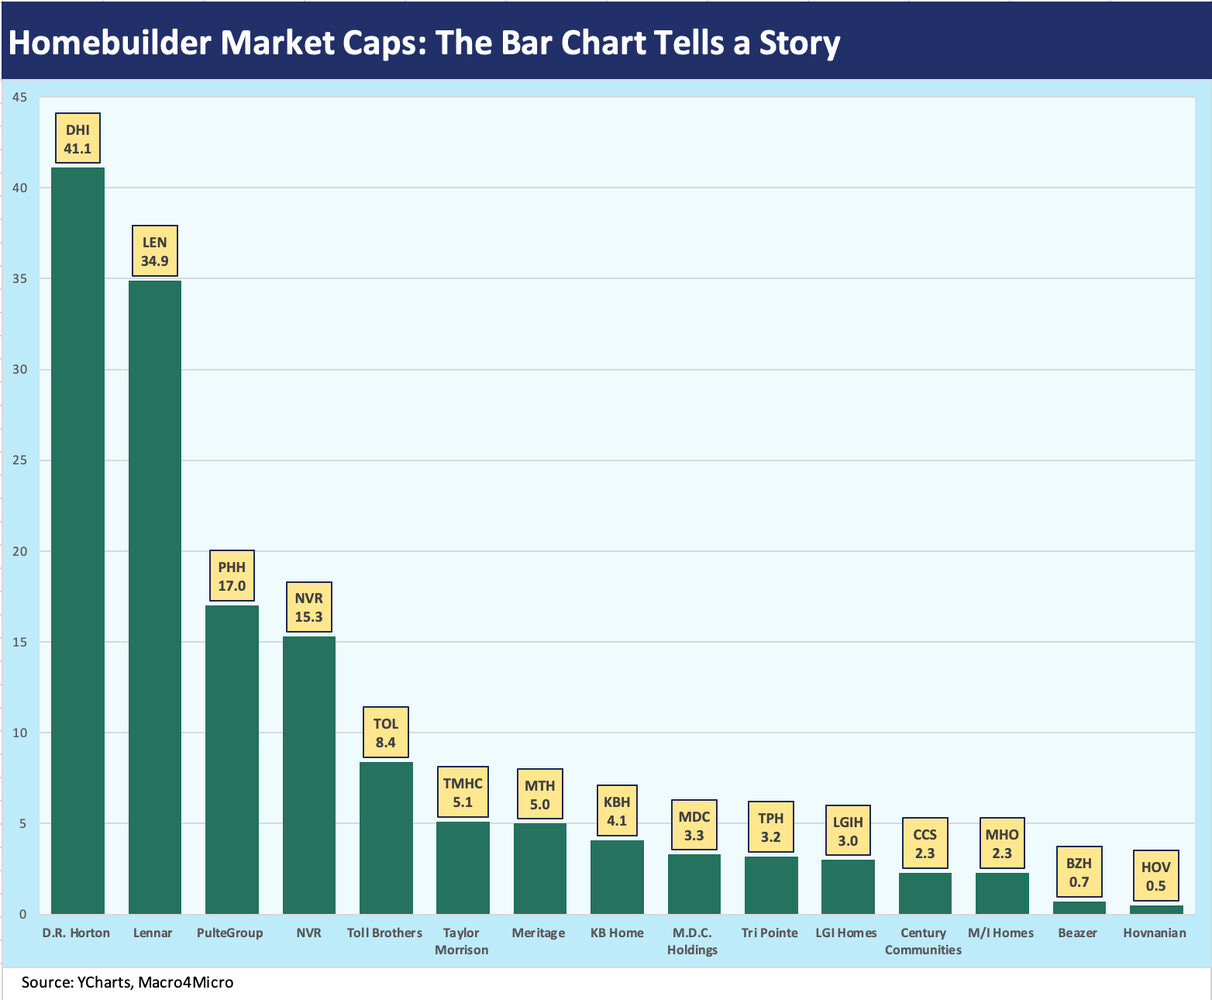
As we look at the above list covering 15 of the top public builders, the market caps run from D.R. Horton at #1 at just over $41 bn (6-23-23-pricing) down to Beazer (#14) and Hovnanian (#15) at well below $1 bn in market caps. KBH is just below the median line of the Top 15 public builders at #8 with a $4.2 bn market cap. The chart underscores the gap between names such as Lennar ($34.9 bn) at #2 and #12 M/I Homes at $2.2 bn.
One theory that comes out of that disparity in market caps and geographic scale is that there will be more consolidation in the years ahead after seeing quite a bit of M&A in the post-crisis cycle. Beefing up market share in select metro areas is a regular part of builder game plans, and the path to more of the same will see more M&A. An example of recent expansion by KBH includes Seattle and Boise (Boise is a geographic labeling stretch in the “West Coast” segment). The regional categories vary by issuer with Texas sometimes getting its own segment (it is under “Central” in the KBH lineup).
There are more reasons for M&A than speed of growth. There is a finite total of skilled workers and subcontractors and the value of SG&A synergy on a higher level of sales plays a role. The desire for negotiating clout with trade partners also factors into the M&A ambitions. There will always be speculation as to why there will be more acquisitions ahead. Family traditions and the heritage of brands in some cases might hinder some consolidation, but recent history shows the power of the price tag in changing family traditions (e.g., William Lyon Homes acquired by Taylor Morrison. Closed Feb 2020).
The above chart uses our more comprehensive list of 15 public builder names with more time horizons for comparative returns. We line them up in descending order of YTD excess returns with KBH weighing in at #6 just behind Pulte with California-centric Tri Pointe at #4. We see small caps (very small caps) Hovnanian and Beazer in the Top 3 with M/I Homes splitting those two. Pulte was the top performer of the larger cap builders YTD just ahead of KBH followed by the newly enlarged Taylor Morrison at #7 YTD.
With respect to performance vs. the overall market, the S&P 500 sits at the bottom of the lineup YTD. We also included an ETF (Invesco’s RSP) that mimics even-weighted S&P 500 metrics at the bottom of the chart. When we consider that the S&P 500 has been heavily driven by the Magnificent 7 (see Reversal, Takedown, or Escape? Market Weighted vs. Equal Weighted 6-6-23), the outperformance of the homebuilders vs. the broad market was even more impressive.
The broad outperformance of the builders looking back across multiple time horizons is a convincing signal on the industry’s inherent financial flexibility across some very unusual markets. The years since 2019 show material differentials in consumer sector health and interest rates to name two of the biggest variables. Demographics favor the builders and supply and demand also favors the builders. Those are two powerful forces.
The cash flow patterns across building cycles offer a lot of reassurance on the downside for homebuilder equities and bonds alike. History shows it is very hard to kill a major builder. For those most bearish on the cycles, there are more vulnerable holdings out there in portfolio context. Price volatility can arrive, but the major builders know how to adapt and the variable cost structure helps.
Recent operating trends at KBH and in homebuilding…
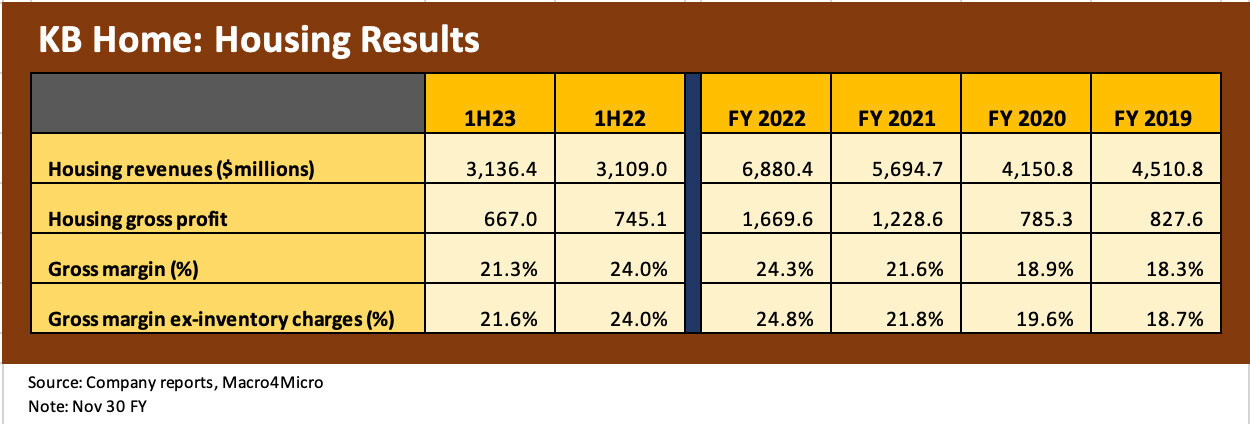
The chart below details the recent history back to 2019 on KBH housing revenues and gross margins. The path from 2019 has been a wild one on the macro front, but gross margins are higher in 1H23 than in FY 2019 and on a par with FY 2021 with the COVID year of 2020 lower.
For most builders, the year 2022 was the peak profitability year given the lag time of “built to order” and contractual commitments that created long lag times to the full impact of rising mortgages. It is safe to say that 1H22 was the peak period for many builders with ZIRP ending in March and the steady migration upward in the UST curve hitting the accelerator from there (see Footnotes & Flashbacks: State of Yields 6-18-23 6-18-23). Soaring prices on housing inventory shortages after the pandemic was very kind to margins at KBH as well. FY 2022 marked cyclical peak earnings and margins for KBH as detailed in the chart.
KBH gave a lot of color on pricing trends with a tough 1Q23 followed by a recovery in 2Q23 that saw 2/3 of communities raise prices with 1/3 flat or lower in price. That is a positive trend line given the gloomy predictions making the rounds in 2022. In terms of incentives, KBH indicated they selectively and opportunistically still use rate buydowns, but the regular focus has been more on closing cost fee relief (e.g., title, escrow). Those incentive costs eat into margins.
KBH raises guidance…
With 2Q23 earnings, KBH provided guidance for FY 2023 in the 4Q22 earnings report and increased their housing revenue guidance. The midpoint of guidance for the top line is for $6.0 bn in revenues ($5.8 bn to $6.2 bn), which would mark almost a 13% decline for the year. The guidance for ASP of $485K would be a small 1% handle decline and indicates a 2H23 increase from 1H23 run rates. The gross margin guidance of 21.3% would imply steady margins across the year but down from the 24% handles of the peak margin year of 2022. “Average” community count will be up 10% in an additional sign of expected strengthening in volume for 2H23 but will end the year flat.
KBH cited the tight inventory conditions that have been a fact of life for a protracted period and framed its own advantage of being in the right market segments where demand is strongest. KBH is more concentrated in the First Time buyer segment at 48% of KBH delivered homes in 2Q23 with an additional 25% of deliveries in the First Move-Up segment. The remaining mix is 12% Second Move-Up and 15% Active Adult.
Among operational highlights looking ahead, KBH indicated that it would be able to convert backlog into deliveries more quickly than it has been able to over the past two years given supplier chain issues and strain in building cycles. KBH indicated they posted a sequential build time improvement of around 40 days (“slab start to completion”). To give some historical context, the build time of 7 months compares to historical timelines of 4 to 5 months depending on the division. Overall cost performance helps the margin story. Last quarter, KBH cited a $19K reduction in direct costs from the Aug 2022 peak with an additional $4K reduction since.
KBH was detailed in its description of supplier chains as gradually normalizing but cited long lead times for HVAC equipment, insulation, and electrical products. As we have heard from some other builders, the even production approach of build-to-order helps keep trade suppliers in a comfort zone. The pushback on that trade supplier advantage is that spec builders with strong financial profiles can do the exact same thing.
On land acquisition, KBH indicated that it would accelerate what has been a defensive land acquisition strategy into more investment in 2H23. “Land development” activity had been running higher, so the statement on new land acquisition is another signal of optimism after a rough ride the past year. As of 2Q23, owned lots comprised 3 years of supply. They are set on lots relative to scheduled deliveries through 2025. For 1H23, KBH disclosed that 83% of its $763 mn in land spend was on development.
The trade-off of build-to-order vs. “spec inventory” strategy…
One of the earnings call topics that caught the attention of investors was the willingness to add additional inventory homes to the 75% of homes in production that are under contract. “Spec” is a dirty word at KBH with its commitment to “built to order,” but the need to shorten times to delivery in a potentially volatile mortgage market is something that calls for some tweaking of the model. That can be framed as “building without orders” to avoid the “spec” term, but they were making it clear they expect a rise in orders during the construction stages. Spec building is a regular topic on homebuilder earnings calls, and the approach makes sense in this market to avoid missed revenue and higher cancellations.
The cash flow dynamics of the working capital cycle and the importance of the relationship of inventories to debt are playing out in an unfriendly mortgage market. The UST migration and high mortgage spreads continue to plague affordability via monthly payment pressures. That said, we keep hearing homebuyer sentiment is adjusting and the ability to refinance later is not a leap for many buyers and especially if they get some incentives now.
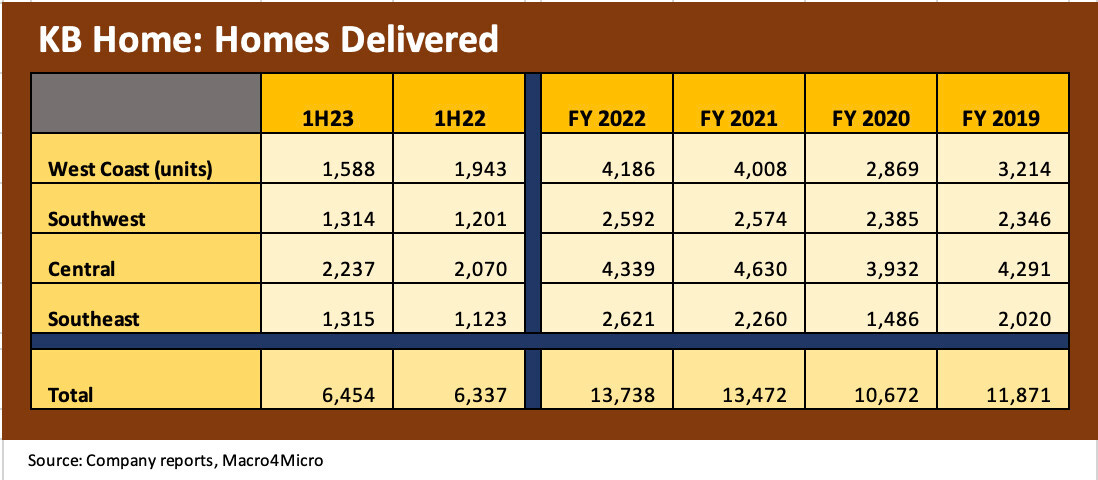
The chart below posts the home deliveries by units across the geographic homebuilding segments. To reiterate, KBH has been a built-to-order player. That business model reduces risks in most markets, but in the period of 2022 across the material upward move in mortgage rates the need for spec inventory has been embraced by more builders to shorten the cycle to delivery and reduce risks of swings in mortgage rates that lead to cancellation or mortgage denials. Even during 2023 the 100 bps swing in mortgages has left many potential homebuyers reeling.
In Q&A, KBH indicated it would build more spec in such an ultralow inventory market. That flexibility tends to please equity investors since this market is clearly unpredictable and the ability to close sales in short timelines is a necessity. That means more move-in ready homes. They indicated plans for more starts ahead to be better prepared for likely demand. The equation is “starts > orders” and then sell at any time during construction. They will roll in more build to order production as well if the market moves in the expected direction (higher). They highlighted how they will sell homes at any point in the construction cycle, but supplier chain worries also encourage more spec building.
The above chart details the deliveries trend by units. It is notable that 1H23 volumes were higher in total based on growth in 3 out of 4 regions. KBH indicated that orders were well above guidance and the recovery was better than anticipated as gross orders rose YoY and cancellations moderated after the high levels of 2022. At 2Q23 quarter end, KBH had 7,300 homes in production after starting 3,556 during the quarter. These numbers give some context to the deliveries total above for 1H23.
The West Coast has been a notable area of weakness for numerous reasons from weather to fires to weakening regional economies within some major metro areas on tech sector turmoil. During 2Q23, the West was over 32% of revenues, almost 22% of deliveries, almost 46% of order value, and over 35% of backlog value. KBH discussed the mixed opinions one hears all the time on the California market on the call, and indicated that the shortfall housing in the CA market is around 1 million units. KBH sees CA as “severely undersupplied.” KBH has moved in recent years to expand in the Southeast and better balance their exposures, but they highlight the basic facts of supply-demand in CA still make it a good market despite the regulatory barriers and higher costs.
Central (Colorado, Texas) was the #2 segment at 31% of revenues, over 35% of deliveries, 19% of order value and just under 26% of backlog value. The materially lower ASP in Central ($419 vs. $704 in West Coast for 2Q23) drives home how different the major markets can be in product offerings and price. The West Coast and Central combined are just under 2/3 of homebuilding revenues.
We routinely look at macro data (see Existing Homes Sales: Feeling a Bit Flat 6-22-23, Housing Starts: Slow and Steady Sequential Moves 6-20-23) points on sales each month on the new homes sales data and existing home sales. There is no shortage of benchmarks and branded data providers (indexes or otherwise) to look at. There is nothing quite like seeing the “actuals” in interim earnings season from the builders with the rolling fiscal quarter dates. The pricing comes with the asterisk of order incentives that builders offer on fees and mortgage buydowns or options that can distort the same store aspects that many use ASPs for despite the variations in mix.
The above chart highlights ASP by region and in total for KBH. We see 1H23 ASP down in total to $479.5K but higher in 3 of 4 geographic segments with the West down. The overall average is still well above FY 2021, 2020 and 2019. ASPs have held up well, but an important qualifier is the less transparent mix shifts by region and product mix. For 2Q23, the increases in ASP ranged from 1.6% in the Southwest to +8% Central to 11% in the Southeast. Those were offset by the declines of almost 5% in CA YoY for 2Q23 vs. 2Q22. CA 2Q23 ASPs were $704K vs. $740 in 2Q22 (please note the chart above posts 1H23 not 2Q23). A key driver of the decline in CA was a community mix shift out of some CA community homes with $1 million ASPs.
The price tag on the West Coast is something industry watchers are used to seeing, but the lofty $700K handle is low relative to those posted by a builder such as Toll Brothers (see Signals and Soundbites: Toll Brothers F2Q23 5-24-23). Toll posted an average selling price of almost $1500K in its Pacific region in the 1H23 reporting period. As another frame of reference, Taylor Morrison Home Corp posted an ASP of $721K in their West segment for FY22 that dropped to $687 in 1Q23.
On the topic of customers’ ability to buy at these prices, KBH offered some color on the profiles of the counterparties in their mortgage business. The FICO score of 736 and income levels $137K above the household median painted a healthy picture as did the average cash down payment of approximately $72K.
The supply-demand fundamentals favoring stabilization of prices are evident in this market as prices have held in far better than many might have expected. As a builder with a major California presence, the average selling prices of KBH’s segments offer a pretty good microcosm of what some of the other major builders are also experiencing if they have major West Coast exposure.
Lower order and backlogs highlight what is essentially the peak to trough relationship (-41% for 2Q23 by backlog units and -44% by backlog value). From here, higher expectations for community count and firming of prices will get tested in the peak selling season. On the flip side, we see community counts higher. The material mix shift from existing home sales to new home sales thus has been helping builders. The mortgage rate X-factor remains the overriding variable in coming months to gauge how quickly KBH can book orders for the construction pipeline and adjust starts higher.
KBH balance sheet and inventory coverage of debt…
Below we update the balance sheet line items. In prior lives when we wrote research on builders, we would highlight that the homebuilding sector is one of those industries where book value leverage is still preferred by the banks and should be used by investors generally. Debt/EBITDA is a tertiary metric for this sector that is flawed in its utility even if you see it still used from time to time for builders. The banks usually tag team a debt to cap metric for asset coverage with a fixed charge coverage kicker as a means of framing near term risks.
The fact remains that in hard times for builders (current times don’t qualify), the analysis shifts to the cash flow statement from the income statement. The cushion in carrying values allows for impairments to the extent book valuations on inventory are overstated and must be marked down to clear the market. Working capital buildout uses cash, earnings generate cash, and when the world gets ugly the liquidation of inventory generates cash.
There is a reason that so few major public builders filed Chapter 11 after the crisis. The builders are about inventory and variable costs and working capital cash flow mini-cycles. That makes builders an unusual business in the BBB and BB tier cyclicals.
The Net debt/Capitalization and inventory coverage metrics are both improving and that is a good starting point. KBH tapped the bond market in mid-2022 and late spring 2021. The more recent liability management action was in Nov 2022 to redeem the 7.625% bonds due May 2023 with the proceeds of the $360 million term loan. The next maturity for KBH is the $360 million unsecured term loan due in Aug 2026. The company can take its time and watch the curve before extending that term loan.
The refi actions of 2021-2022 leaves KBH with a clean maturity schedule with the next bond maturity in June 2027. The balance sheet posts lower debt levels and leverage than 2019 despite all the action in the macro picture since then. Leverage has declined on high earnings retention and prudent financial policies.
Capital allocation has favored the balance sheet and reinvestment over buybacks, but KBH has bought back 15% of its stock over the past two years. Shareholder rewards including dividends totaled $610 mn over that time frame. That includes $92 mn in repurchases during 2Q23 (3% buyback).
The average price on buybacks of $36.81 over the past 24 months as detailed on the earnings call compares to the current KBH stock price of ~$52 per share. KBH has over $400 mn remaining on its buyback program. The dividend yield is just over 1% with the payout ratio in 2022 only modestly over 6%. KBH is more about reinvestment in expansion and stock buybacks.


