

With the range of September earnings numbers ahead for homebuilders, the limited Aug 31 3Q26 reporting season also offers some color on the broad pressure on homebuilder fundamentals. KBH results follow the earlier weakness seen in the Lennar 3Q26 numbers for the #2 homebuilder (see Lennar 3Q26: Metrics Keep Weakening 9-18-26).
Mortgage rate increases are only getting worse with a move in the Freddie Mac benchmark above 7.0% (7.03%) with the latest weekly update while the daily survey delivered from Mortgage News Daily hit 7.49% today. While average selling prices (ASPs) are coming down, the dominant variable for monthly payment stress is mortgage rates and not home prices.
In a “price x volume” business, the story is not a complicated one at KBH with volumes down (deliveries), orders down, and ASPs down. Gross homebuilding margins are down YoY even if they ticked up sequentially vs. 2Q26 and the grim 15.2% posted then.
What makes KBH such an interesting microcosm of the homebuilding industry is its role as a strong brand in numerous major markets as a Built to Order (“BTO”) operator with a heavy California mix (37% of revenue in 3Q26, 38% in FY 2025). The sensitivity of headline ASPs always comes with a geographic mix asterisk. That is especially the case for the West region even for the intra-California mix (Southern vs. Northern).
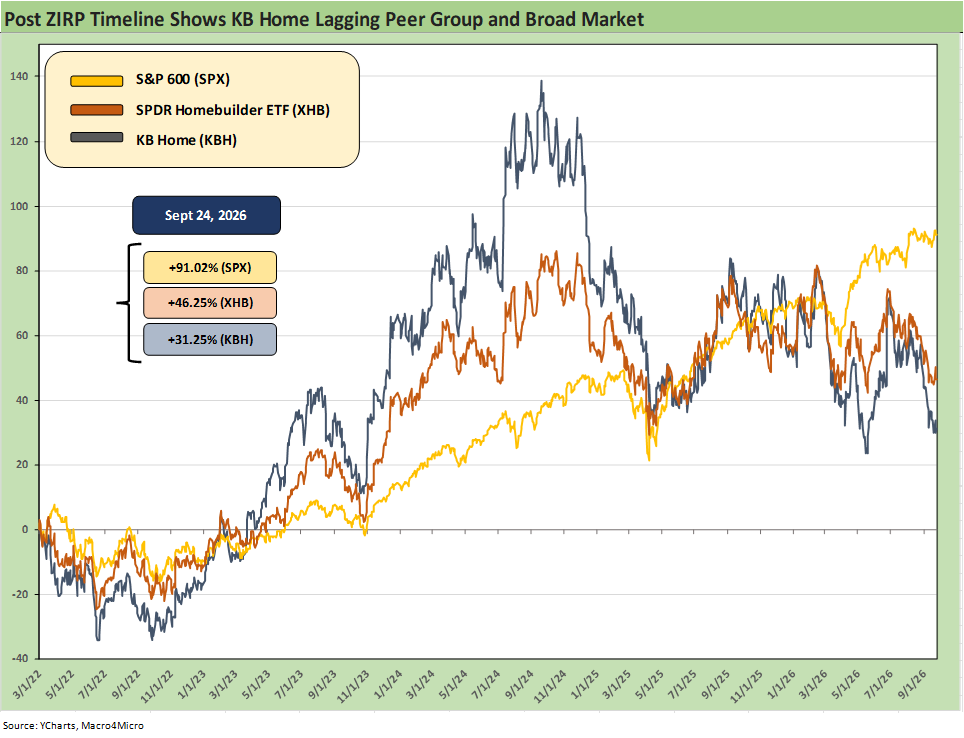
The above total return stock chart starts the timeline at 3-1-22 just ahead of the end of ZIRP and start of the tightening cycle. During that stretch, KBH underperformed the broader builder group after running ahead with a big lead into 2024 before a major swoon. The mortgage rate rise in 2025-2026 and housing cycle dynamics sent KBH lower with material margin compression as detailed below. It is sometimes easy to forget that mortgage rates were dancing around the low 6% range as recently as Sept 2024. That was over 145 bps ago.
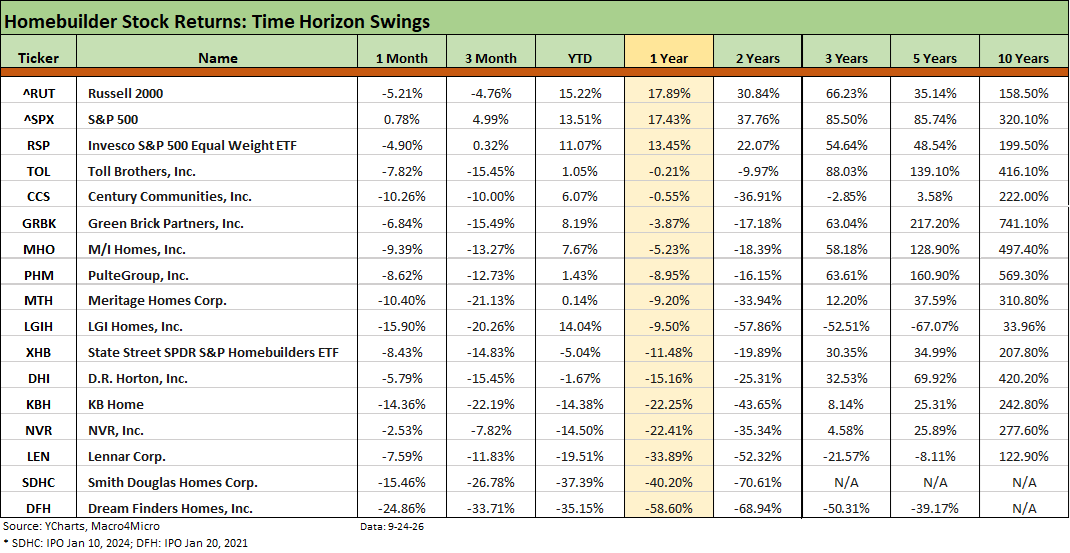
The above timeline table for total returns for the homebuilder peer group includes some broader benchmarks and the Homebuilder ETF (XHB) as frames of reference. We line them up in descending order of returns over the trailing 1-year time horizon. The trend lines for homebuilder equities over the past year have been grim but with some relative winners and losers with Pulte a winner and Lennar a loser among two notable examples. The weakness has been evident among some of the largest names (LEN, NVR, DHI) as well as the smaller cap names (Dream Finders DFH, Smith Douglas SDHC).
The names that held up can boast a special niche or operating profile (e.g. luxury builder Toll TOL), vastly superior margin histories (Pulte PHM) or some smaller players that can sell a growth story and expansion success (M/I Homes MHO, Century Communities CCS).
As we have seen in the recent M&A activity in the builder space, the homebuilding sector remains fragmented nationally with a lot of room to consolidate and engage in bolt-ons. After the large cap names (DHI ~$39.3 bn, LEN ~$19.6 bn, NVR $16.6 bn, TOL $12.5 bn), the market caps decline sharply with many private builders across the regions.
The Berkshire Hathaway stake of 10% in Lennar has tongues wagging after their earlier acquisition of Taylor Morrison in 2026 ($8.5 bn enterprise value). Berkshire also happens to be the owner of Home Services America, which is a major residential brokerage group. What Berkshire’s strategic game plan might be in the connection points of new and existing home sales will be something to watch. Berkshire loves cash flow machines and homebuilders fit that bill.
It is clear that the unfriendly mortgage market could get closer to 8% again subject to oil and the economic path. That will lead to slowdowns in volume and free cash flow generation that will make for tough decisions for homebuilders on land investment vs. stock buybacks and how much new debt to issue in that balancing act. The cost of floating and fixed rate debt is rising at the same time customers will feel the affordability strain and shareholders will be looking for support. Weak equity values will attract long-term M&A strategies.

The high-level summary of KB Home operating results are posted in the table above, and we see the peak revenue lines of FY 2022 and FY 2024 with the FY 2022 line bolstered by new home sale deals cut earlier in the year and closing at a lag. The pretax income lines of $1.07 bn in 2022 and $850.9 million in 2024 are a long way from the sharp decline in FY 2025 to $554 million and the fresh round of sharp declines in the YTD 3Q26 interim.

The above table zeros in on the housing results alone, and the gross margin compression to 15.7% YTD is well below the 22% long-term target range. The 2026 run rates are ugly vs. 24.3% for FY 2022 and 21.0% for 2024. The guidance for FY 2026 is 16.0% to 16.2%.
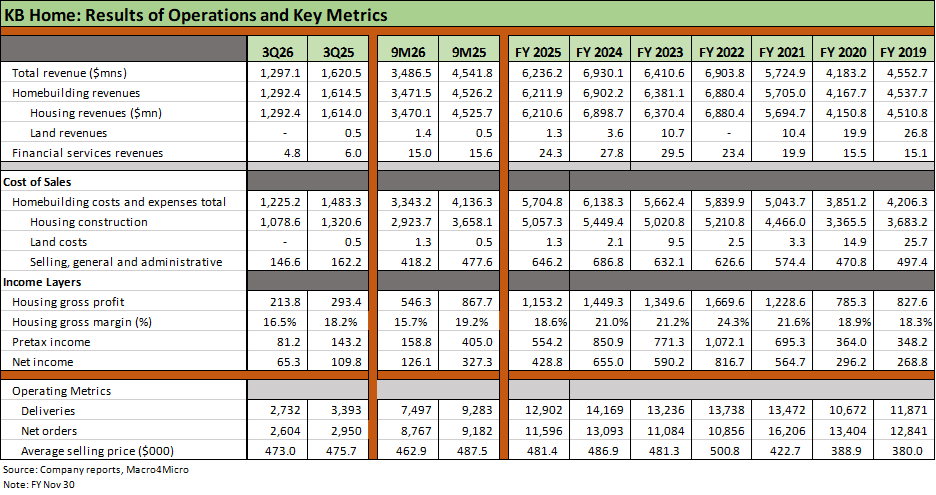
The above table offers more granularity across the revenue and expense lines. The bottom of the chart drives home the weakness in volumes (deliveries) and orders while the lower ASPs are evident for the 9M YTD period in every geographic reporting region. For the 3Q26 period alone, the Central region managed a small increase in ASP as we detail below.
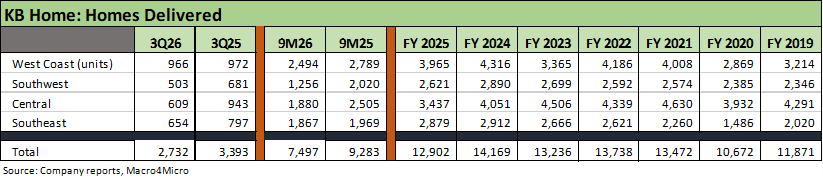
The deliveries table shows material declines across the board in 3Q26 and for the 9M YTD 2026. From 13K handles for total deliveries from 2021 to 2023 and over 14K in 2024, KBH is guiding to a 2026 range of 10.5K to 11K.
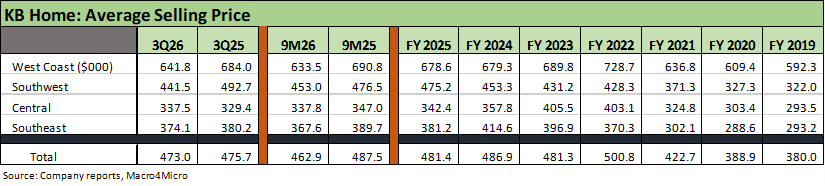
The ASP story is not helping even if volumes are the dagger in results. Like most builders, KBH emphasized that sales volumes are the key driver of their starts cadence. Since they are shifting more of their mix back to Built to Order, they have less use of incentives than the typical builder. As a result, there is less volatility in pricing as KHB shifts back to its traditional “BTO” focus. That shift is further along as 2026 progresses as discussed on the earnings call. The pace of demand in the ZIRP years forced many BTO traditionalists to shift more to speculative inventory builds just to keep up.
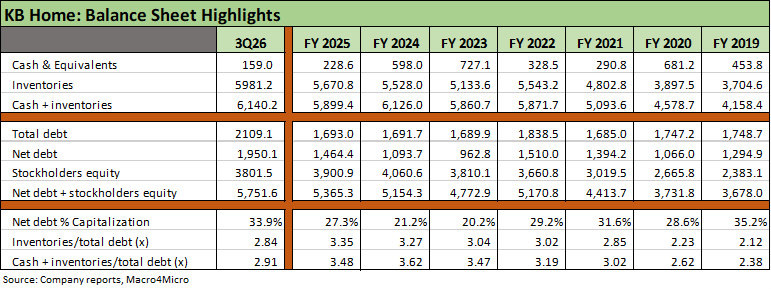
The above table updates the trend line in debt and leverage. We also update our high level asset protection ratio using “inventories/debt” and “cash + inventories/debt.” The trend line in net debt/capitalization (%) shows higher leverage with 33.9% at 3Q26. That is well above the 21.2% of year end 2024 and looks more like 2019.
The asset coverage has also moved lower with inventory/debt at 2.84x, down from 3.35x at 12-31-25 and 3.27x at 12-31-24. “Cash + inventories/total debt” of 2.91x is also sharply lower since the 3.5x to 3.6x area.
The bottom line on KB Homes is that the metrics mix and challenging housing market has essentially pressured all KBH metrics into a weaker zone with mortgage rates ticking higher on the day to 7.49% (Mortgage News Daily) as we go to print.
See also:
KB Home 4Q24: Strong Finish Despite Mortgage Rates 1-14-25
KB Home: Steady Growth, Slower Motion 9-26-24
Credit Crib Note: KB Home 7-9-24