


Trump: Oil prices will plunge after the election, and I will also start bombing again.
One of the worst yield curve weeks is behind us, but we now head into a very uncertain period of executive policy actions with rates already rising again today. Iran escalation rhetoric is as constant as it is erratic, but the reassurance on oil prices from the White House tends to clash with the extreme language on refusing settlement and pre-announcing fresh bombing plans.
This week we get the latest PCE inflation (income and outlays report), the final 2Q26 GDP update, JOLTS/payroll, durable goods, factory orders, and PMI/ISM releases that are likely to get more focus than usual as we get warmed up for September quarterly earnings releases.
As we go to print, FOMC FedWatch odds of a hike are now at 74.7% for the October meeting (10-28) to 400-425 bps and 61.7% for a hike to 425-450 bps in December (12-9). By midday, we saw UST rates move higher again with 2Y up around +8 bps by midday to 4.94% and 8 bps for the 10Y to 5.26%. That has since eased back to around +5-6 bps.
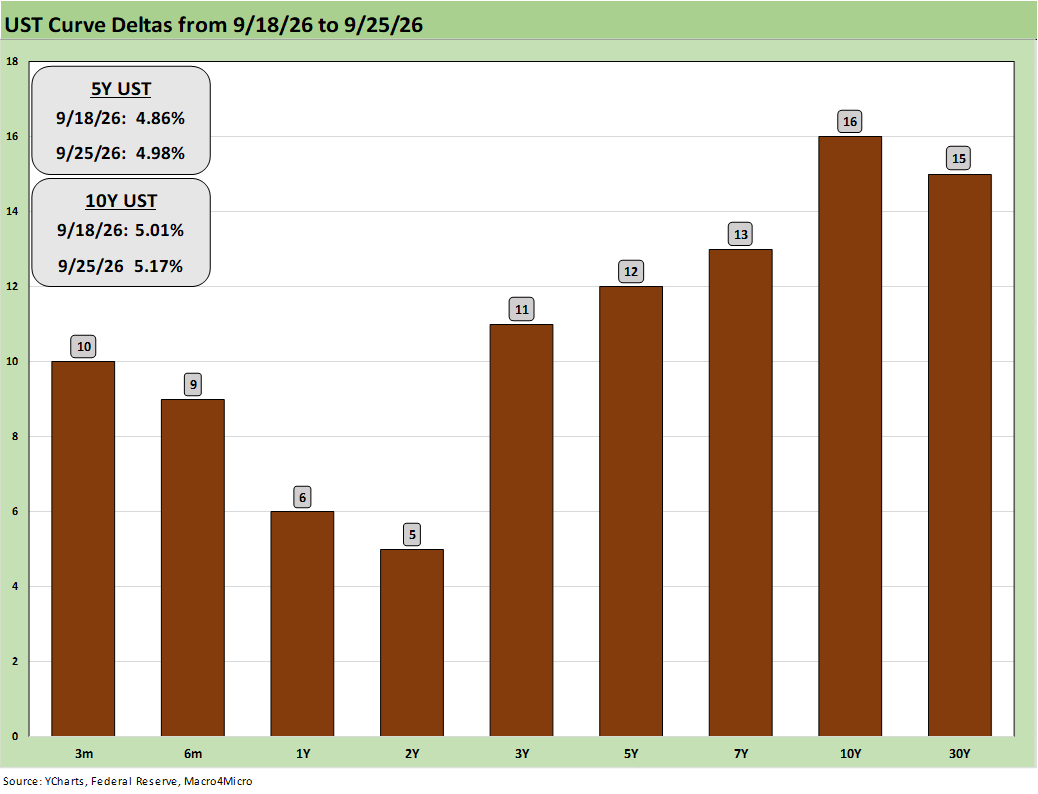
The above chart updates the UST deltas through Friday close with Monday also off to a bad start. The steepener has hammered mortgage rates with the Mortgage News Daily Survey at 7.43% to end the week.
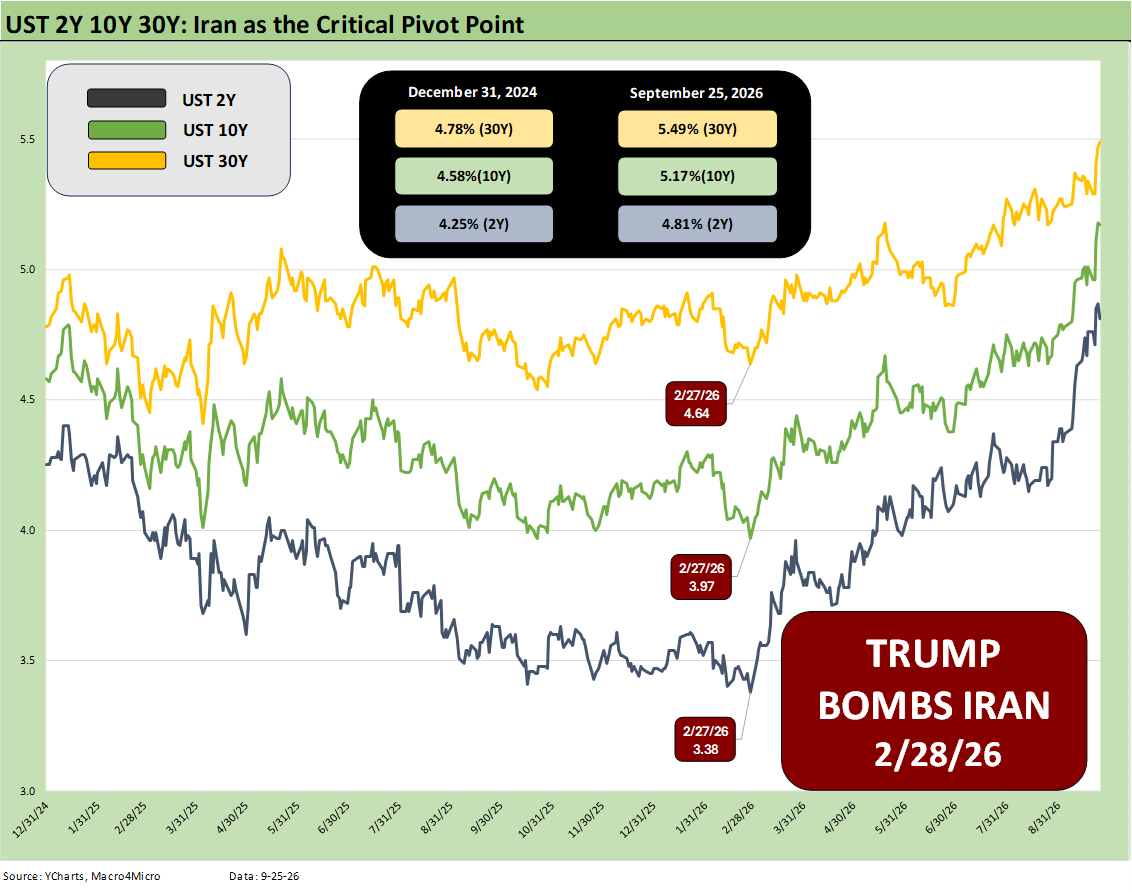
We already posted a commentary on this chart separately (see UST Reality: Higher Rates the Hard Way 9-26-26). The facts matter and political story lines do not. The damage from Iran actions is clear enough with quite a bit more flowing into the cost lines at a lag.
The economy and demand fundamentals are still steady and GDP is growing at this point, corporate earnings are strong, and the AI boom is both secular as well as cyclical. That means sustained inflation risk when taken in tandem with the geopolitical “cluster of circles” managed by this White House.
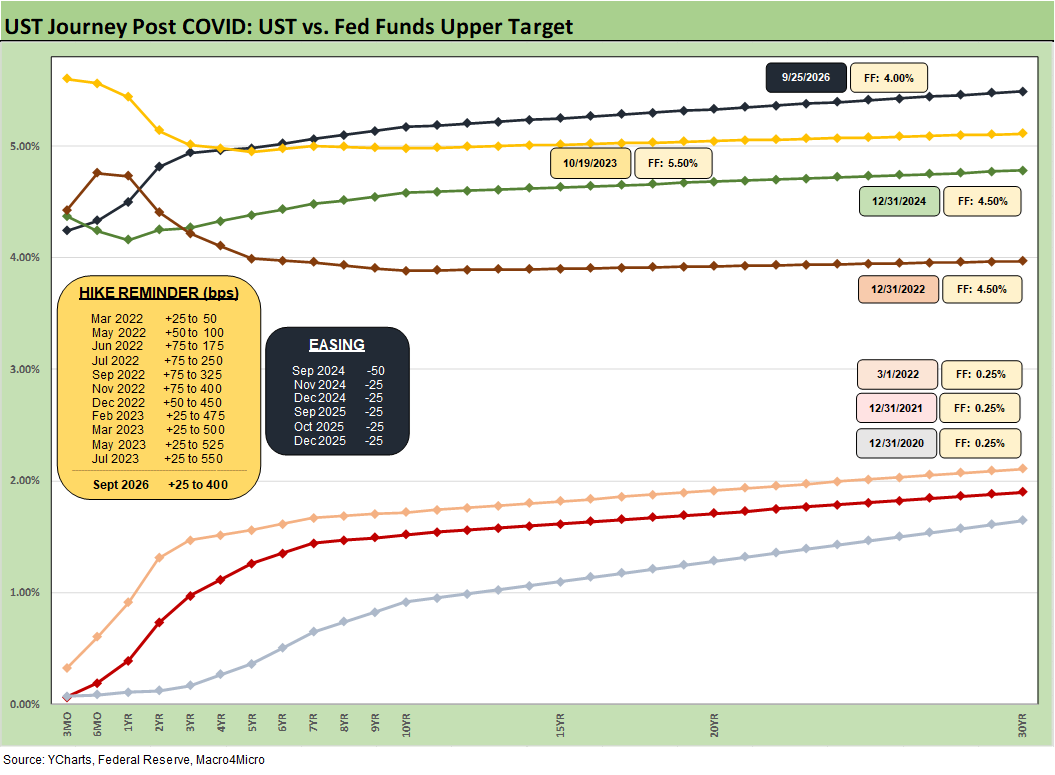
The above chart updates the UST migration from the ZIRP period of COVID across the tightening and easing cycle. We flag those FOMC actions in the boxes included in the chart. The “hike box” just lists the upper end of the range.
It is clear that the current UST shift to the Friday close has seen the long end push past the Oct 2023 date when the 10Y hit 5.0% briefly and mortgages ran closer to 8.0% in numerous surveys. We are going in the wrong direction.
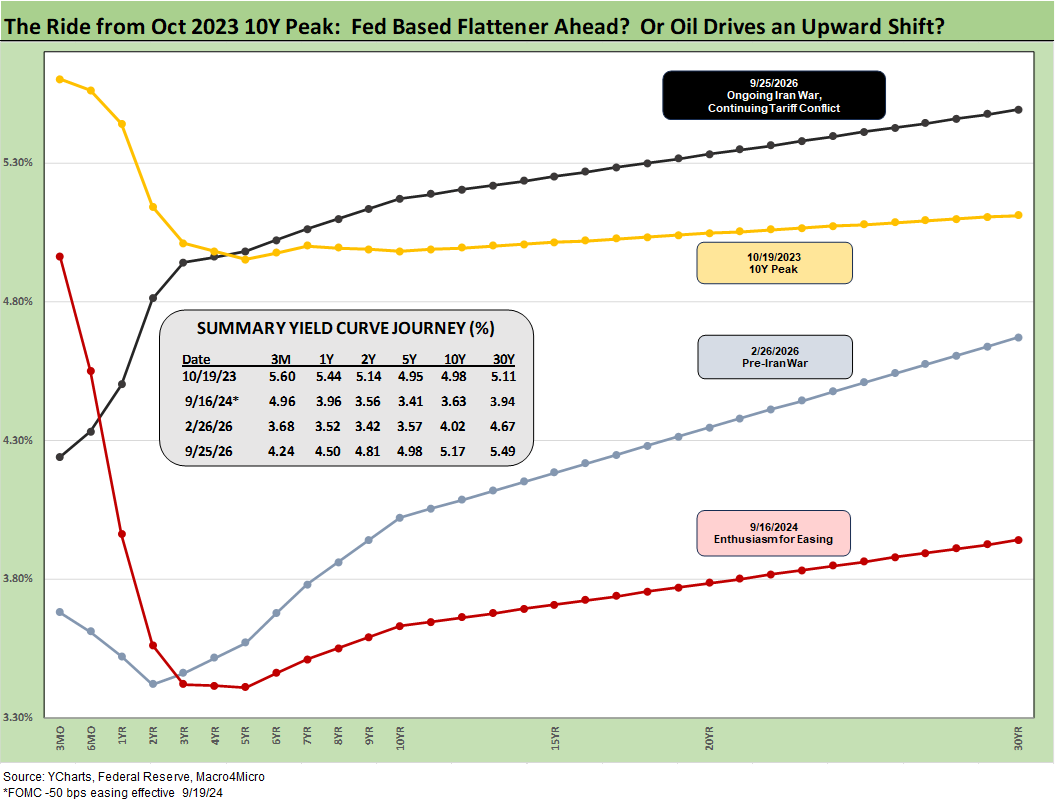
The above UST curve chart locks in more on recent periods. We include the 9-16-24 UST curve as a reminder of what the curve looked like just ahead of the easing cycle in late 2024. We don’t expect Bessent or Hassett to be using this visual to extol the virtues of the 2025-2026 UST curve performance.
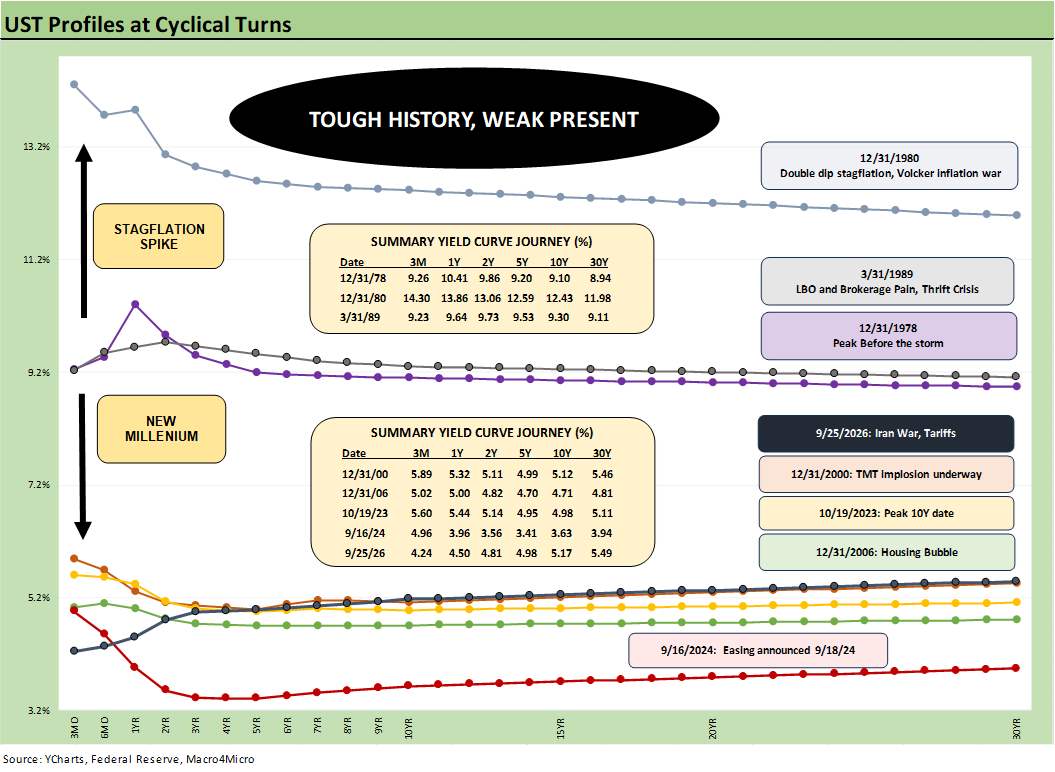
The above UST curve update includes a table for convenience. The main point is the world has seen much worse and nobody has ever died from 5% rates. As someone who had a 23% prime plus floating rate loan back in the early 1980s, I am still ticking and the reality is markets have seen much worse even as recently as 1989 (9% handles). Of course, Trump is not Ronald Reagan or George HW Bush. Their cabinets were also “night and day” (Competent vs. incompetent? Intellectually honest and courageous vs. spineless squids?) relative to the current Rogues Gallery.
Of course, 5% 10Y and 4.9% 2Y seems daunting after so many years of ZIRP and artificially low rates on various Fed initiatives. Being locked into a 3% handle mortgage can make some critical decisions such as moving an economic pain point.
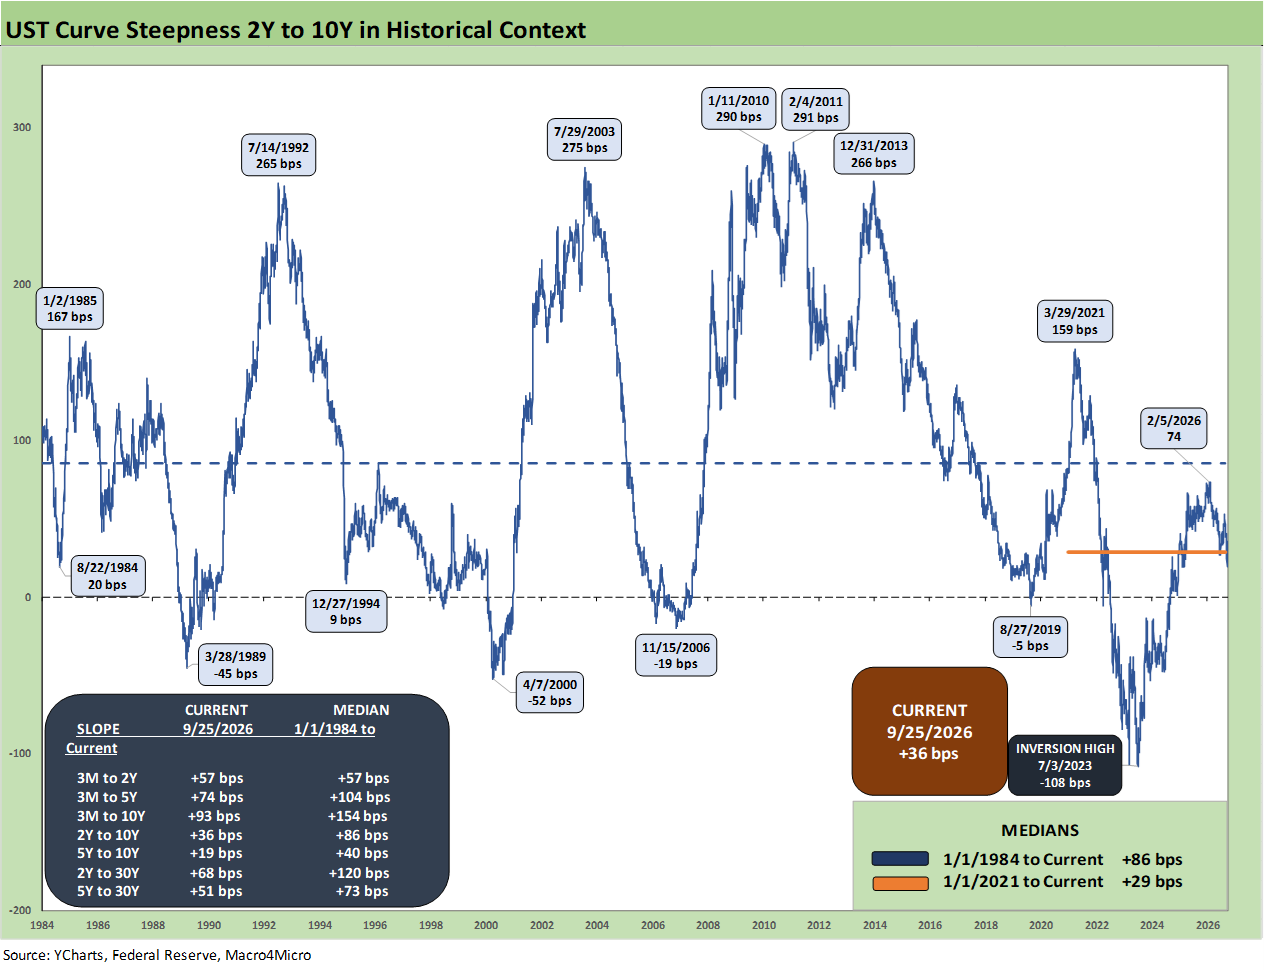
The above chart updates the long term 2Y to 10Y UST slope. We include a box that details slopes on other UST segments we like to monitor. The +36 bps as of Friday is well inside the long term median of +86 bps. With the handicapping at FedWatch signaling 2 more hikes in the 4Q26 period, the debates around bear flattening accompanied by an upward UST shift are not going away after a few years of steepening since the 2023 inversion.
Flattening in the face of Fed tightening usually gives rise to more discussion of cyclical tops and rising recession or stagnation risks. The current backdrop would include the word “stagflation risk” but those more dire scenarios get derailed by solid corporate earnings, high fixed investment, and an extraordinary tech cycle tied to AI infrastructure with its multiplier effects.
Higher rates and inflation pressure can be accompanied by steady growth and rising stock markets. That is of course subject to a lot of assumptions. The wildcard in such a macro game is the consumer sector, which will get severely tested ahead with negative real wage growth.
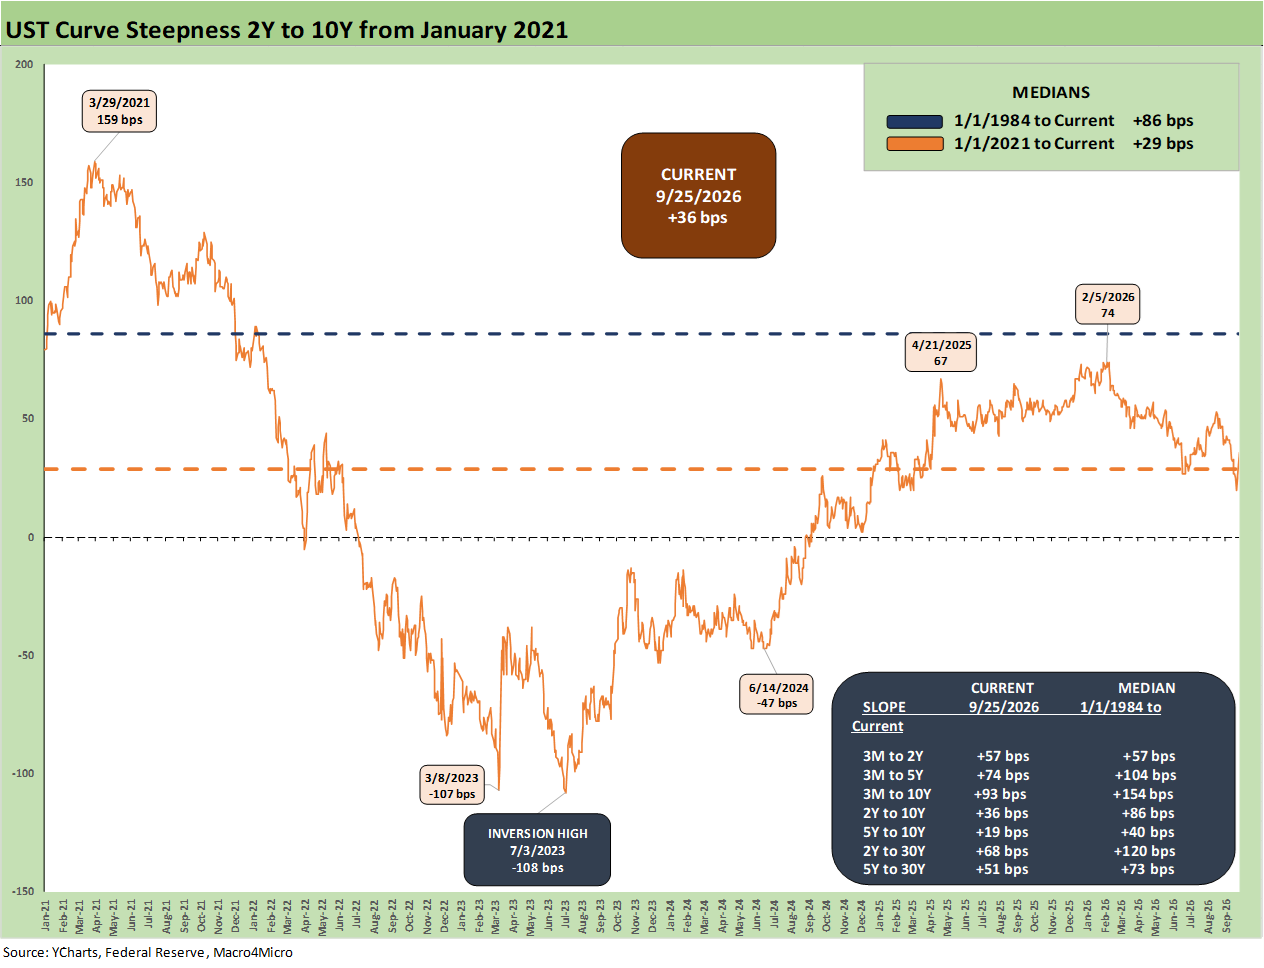
This chart shortens up the timeline to the period from Jan 2021 when ZIRP was in place and supply-demand imbalances were a shock only worsened by excess stimulus. Then came the Feb 2022 invasion of Ukraine and an oil shock that was followed by the end of ZIRP and a tightening cycle underway in March 2022. That has been covered ad nauseam in other commentaries.
We saw a swing from a slope of +159 bps in March 2021 to the -108 bps inversion in July 2023 back to +74 bps in Feb 2026. That is a wild ride over a period without a recession even if there was a lot of recession chatter in later 2022. By the fall of 2022, unemployment remained quite low and personal consumption expenditure (PCE) growth was on solid ground. That anchored GDP growth in 3Q22 and 4Q22 after two rough quarters in 1H22 (see Unemployment, Recessions, and the Potter Stewart Rule 10-7-22, GDP 4Q22: Thin Sliced 1-26-23).
The UST delta collection…
The following charts update various timelines in UST deltas in a very busy transitional year for affordability challenges.
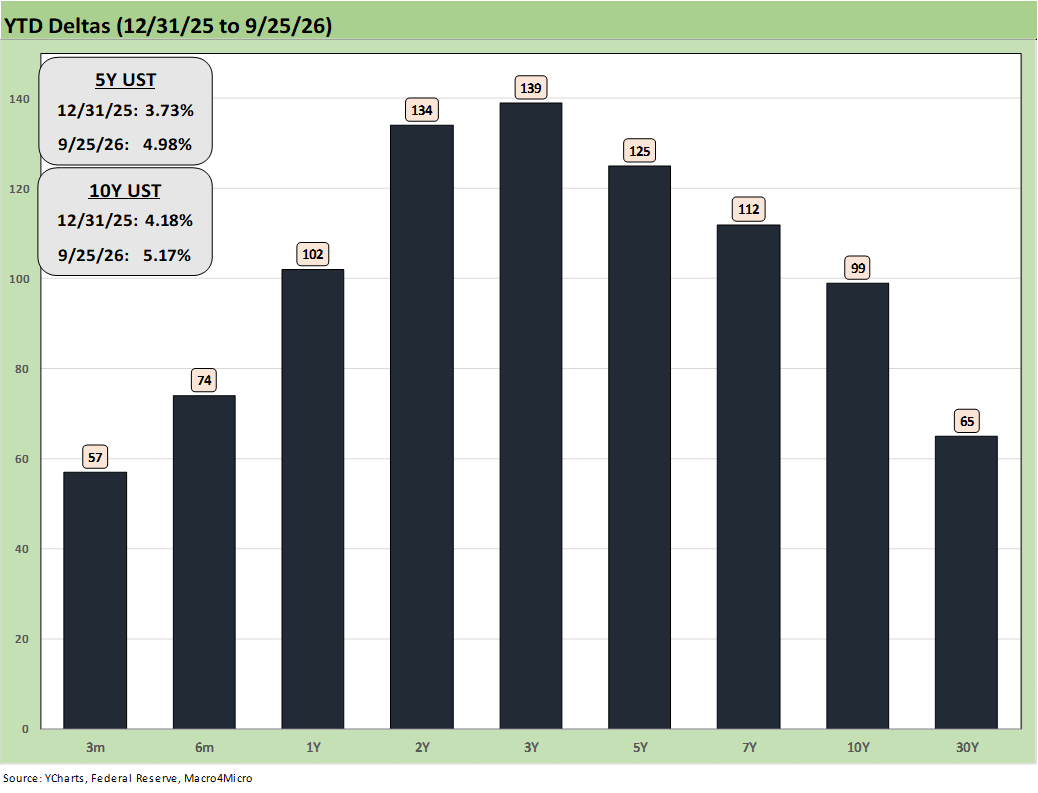
The YTD UST deltas have hit the 2Y to 10Y range hard with 2007 comps being the norm in the “highest since” headlines.
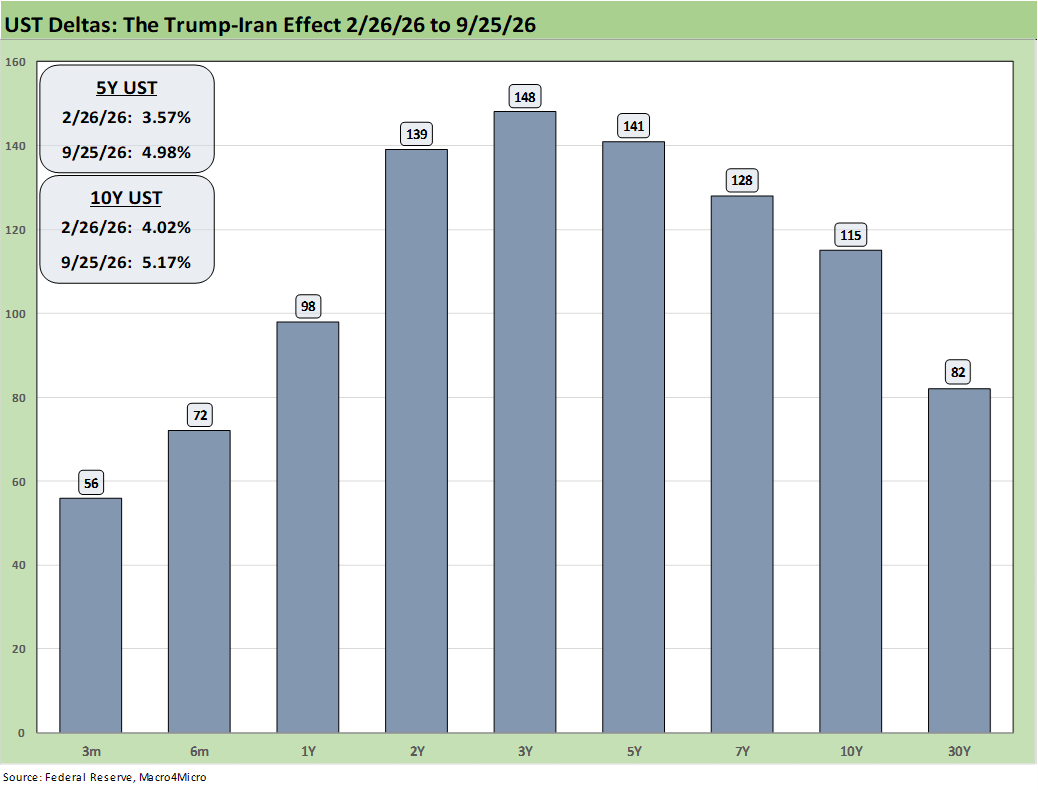
The post-Iran deltas are clear enough with the 2Y to 10Y pummeled and the 30Y also feeling the pain. Duration was punished with the long duration 20+Y UST ETF (TLT) YTD return at -6.2% as of the close of last week.
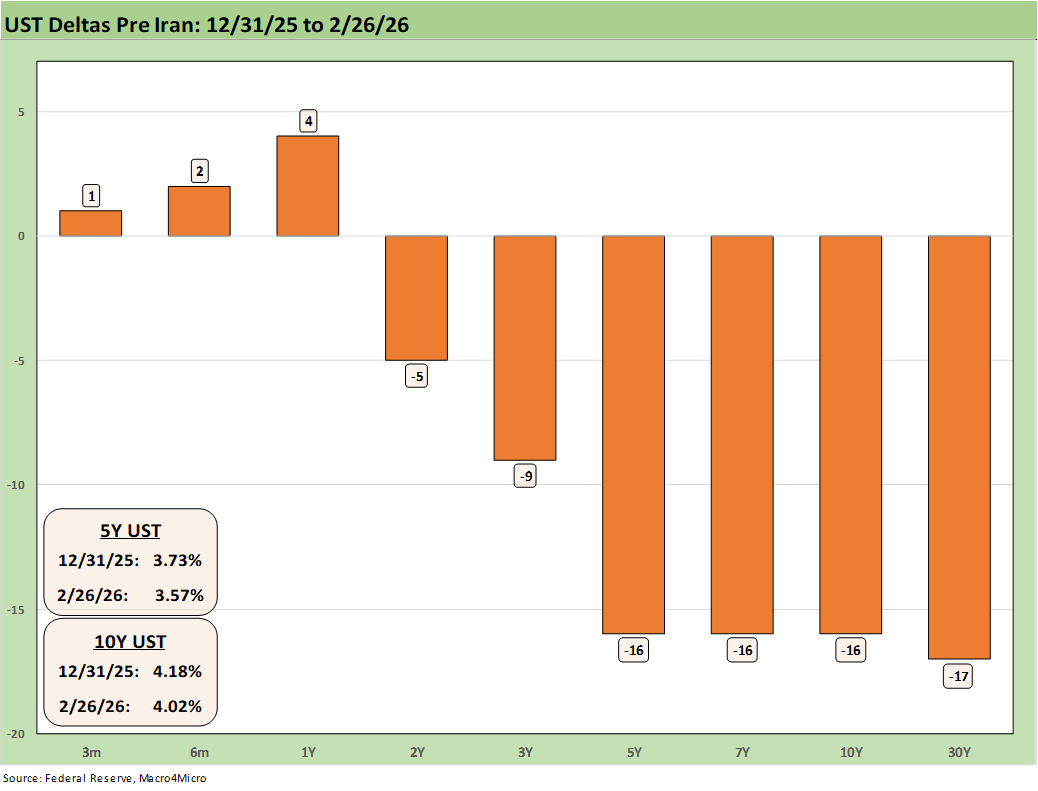
This offers a troubling reminder of where the UST curve was moving YTD before the Iran bombing.
See also:
Weekly Returns: Benchmarks and ETFs 9-27-26
Tech Check: Weekly Price Returns 9-27-26
UST Reality: Higher Rates the Hard Way 9-26-26
KB Home: 3Q26 Highlights Builder Pressures 9-25-26
Some UST curve histories:
Business Cycles: The Recession Dating Game 10-10-22
UST Curve History: Credit Cycle Peaks 10-12-22
Bear Flattener: Today vs. 1994 and Aftermath 10-18-22
Fed Funds, CPI, and the Stairway to Where? 10-20-22
Greenspan’s First Cyclical Ride: 1987-1992 10-24-22
UST Curves: Slope Matters 10-25-22
Greenspan’s Last Hurrah: His Wild Finish Before the Crisis 10-30-22
Wild Transition Year: The Chaos of 2007 11-01-22
UST Slope Update: Some New Inversion Highs 12-8-22
Yield Curve Lookbacks: UST Shifts at Cyclical Turns 10-16-23
UST Moves 1978-1982: The Inflation and Stagflation Years 10-18-23