


The financial trend line for Lennar (LEN) remains negative with the balance sheet and asset coverage heading in the wrong direction as volumes and prices slip and margins compress.
After battling with D.R. Horton (DHI) over the past cycle for leadership, DHI is ahead on homebuilding revenues, unit deliveries, and relative stock performance. DHI’s market cap now dwarfs that of LEN at a factor of 2x.
LEN’s 3Q26 quarter and YTD numbers show lower revenues, lower earnings, lower volumes, and lower average selling prices. That is a bad mix.
The credit metrics such as total debt and net debt leverage are weakening and asset coverage (inventory and cash coverage of total homebuilding debt) are much lower than recent years and back to 2019-2020 levels
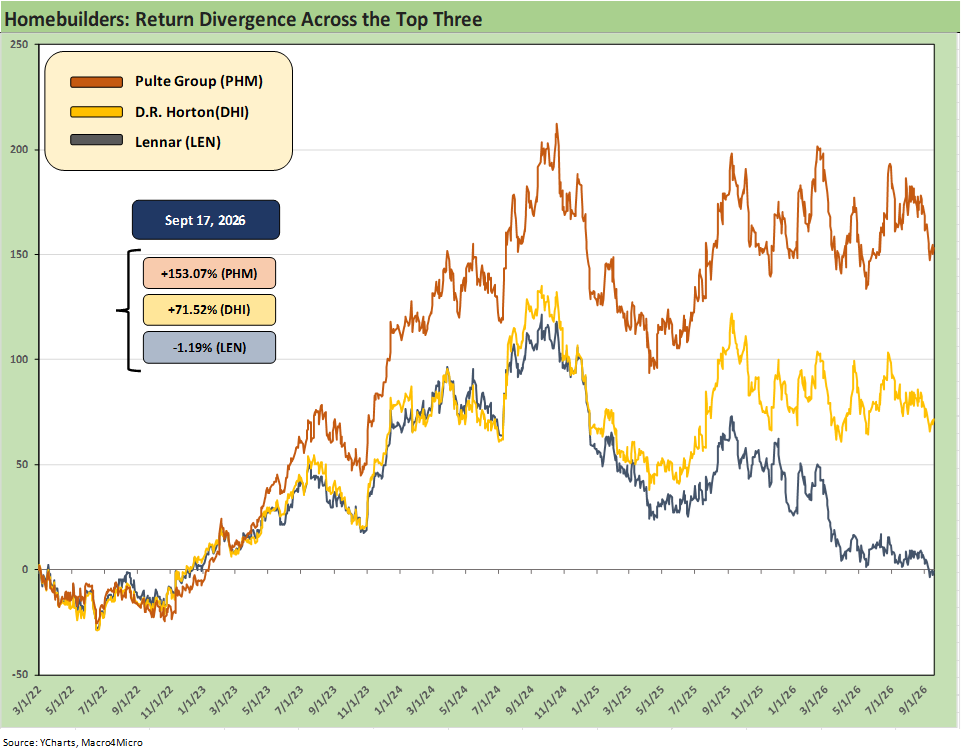
The time series above tells a story that not all homebuilders are being painted with the same roller. We start the time series with an objective focal point of March 1, 2022, which is the month ZIRP ended and the tightening cycle was underway along with material adverse moves further out the curve flowing into mortgage rates.
The total return on Lennar stock over that period (and other timelines as detailed in the next chart) has been battered relative to the other industry leaders in the top 3. We include other comps in the chart below, but the equity markets are telling you that there are very different profiles in the top ranks at this point with Lennar falling badly off pace.
If we frame the leaders vs. the S&P 500, Pulte (PHM) and Toll Brothers (TOL) among the industry leaders that outperformed the broad benchmarks. We could also have dropped in TOL in this chart with its distinctive luxury mix along with Pulte (PHM) with its historically very high and leading industry margins. We include TOL in the next chart.
The two biggest names in the builder sector have made following the Big Two (DHI and LEN) a useful exercise for a read on broader national housing trends (see D.R. Horton: Financial Powerhouse Despite Cyclical Softening 5-20-26), but there are very distinct product tiers and geographic mix profiles across the group.
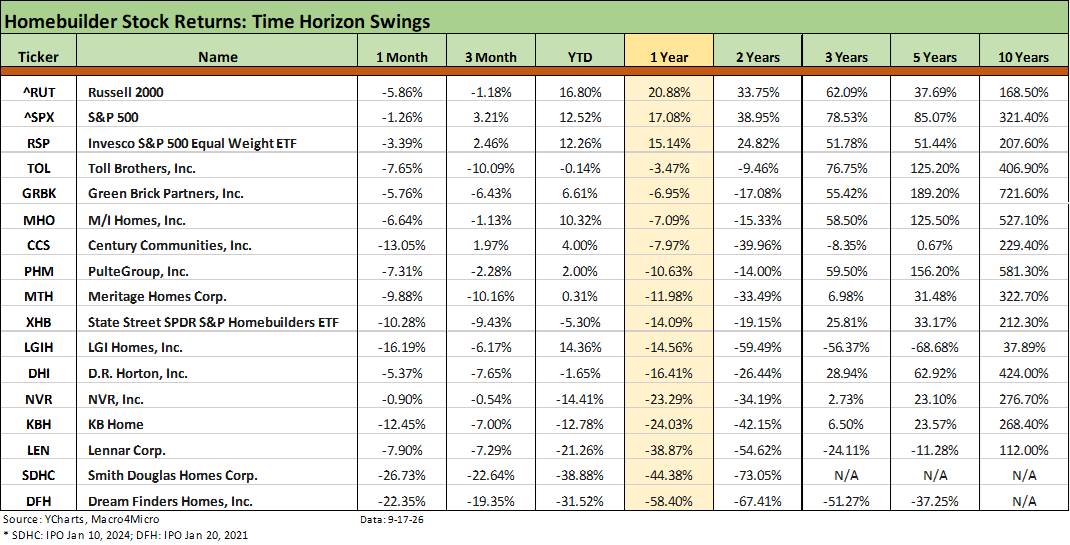
The timeline of stock returns for a peer group of major publicly traded builders is broken out above. We exclude the recent acquisitions such as Taylor Morrison, Tri Pointe, Beazer, and MDC. We include some broader benchmarks for comps including the S&P 500, the Equal Weight S&P 500 ETF (RSP), and the Russell 2000.
We lined them up in descending order of 1-year returns with no builders in positive range. The longer tail of negative returns in the bottom of the list is downright ugly. Slowing volumes, broadly weaker margins, and mortgage rates pushing back in the direction of fall 2023 above 7% is not helping.
While LEN management indicated “construction costs” decreased but with land costs higher, energy pricing will continue to hurt with respect to some parts of the supply chain (materials, components) and some operating costs (e.g. diesel use for equipment). Costs incurred by those manufacturing equipment used by builders are rising on a combination of factors. Labor supply is a problem for many, but builder management teams know the risks of speaking out on that topic.
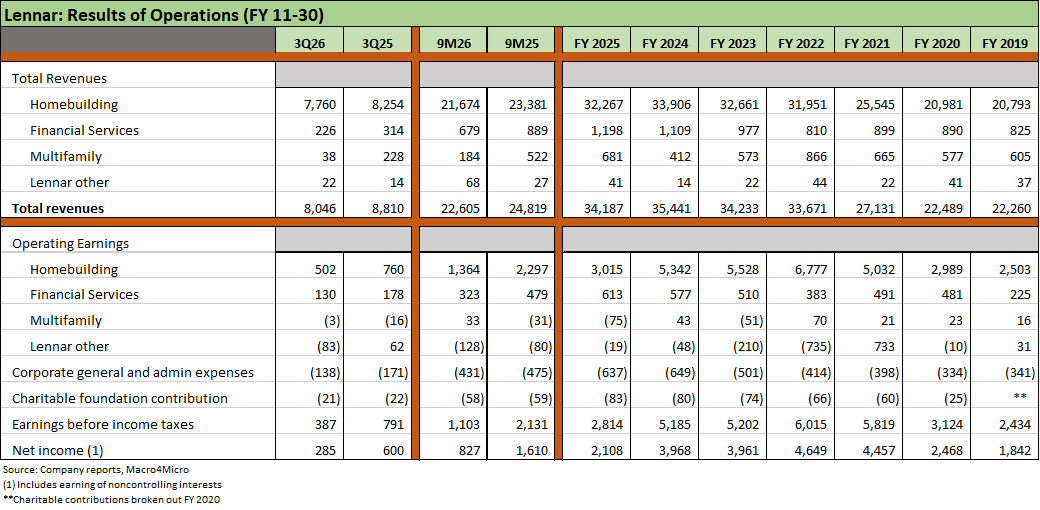
The homebuilding line is the key driver of performance and we see both revenues and operating earnings lower. The same is true for Financial Services. The segment margins trends and details do not come out until the 10Q is filed, and we will follow up on geographic gross margins and trends and cash flow details with that filing.
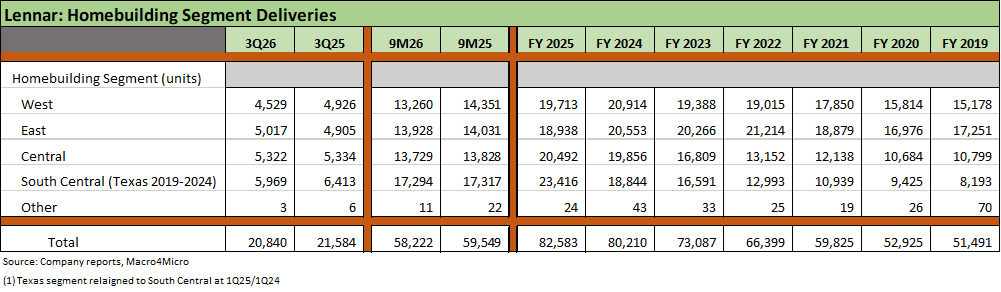
In a “price x volume” business, we see both going the wrong way for Lennar. Total volumes were lower in total for the quarter and 9M YTD period. Through 9 months, all four regionals are lower. For the 3-month period, the East managed a small increase with Central essentially a tossup. The West and South Central (heavy on Texas) segments were both lower.
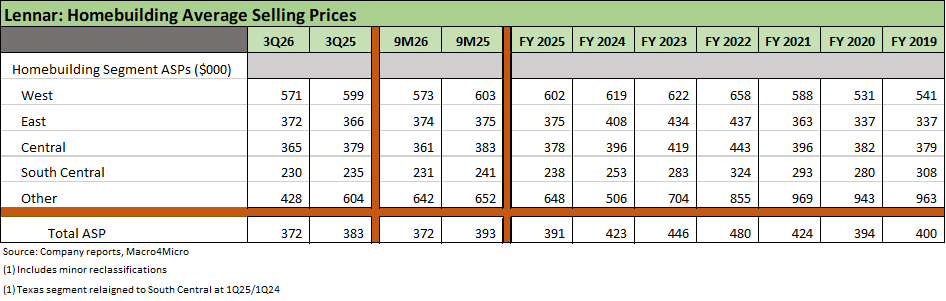
Average selling prices do not tell a good story in the 3Q26 period with 3 of 4 regional ASPs lower. For 9 months, 3 of 4 ASPs were down with one (the East) flat.
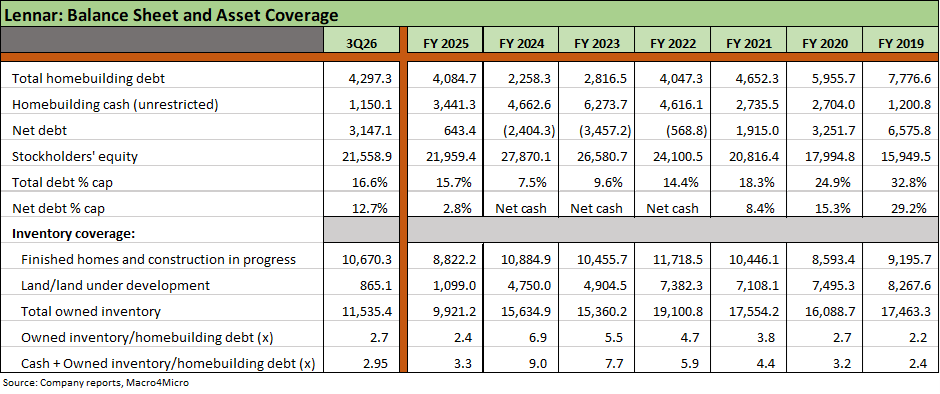
Financial risk is rising given the material increase in net debt with lower Homebuilding cash and higher Homebuilding total debt. Leverage on a total and net debt basis are both higher as detailed.
We like to use various “inventory to homebuilding debt” ratios as measures of asset protection including “cash + inventory.” Those have declined notably from the 2023-2024 peaks. Owned inventory/homebuilding debt is down to 2.7x at 3Q26 from 6.9x at the end of 2024. “Owned inventory + cash” is down to 2.95x homebuilding debt from 9.0x at the end of 2024.
The homebuilders intrinsically have a strong cash flow and liquidity story given working capital flexibility. That said, the scale of dividends plus buybacks in recent years give them less room to maneuver.