
Footnotes & Flashbacks: State of Yields 2-11-24
We look at another mildly unfavorable week for the UST curve but one that did not unsettle equities in a decent earnings season.


The week saw another round of mild rebellion against the yield curve bulls with an upward shift from 2Y out to 30Y with duration returns lagging for the 1-week and 1-month time horizons.
This coming week brings a fresh round of CPI and PPI numbers plus retail sales, industrial production, and consumer sentiment, so a fresh test lies ahead for market convictions on how lower inflation frames up alongside constructive industry fundamentals being delivered in earnings season.
The Fed is staying busy talking down the potential for multiple cuts early and often by pushing “slower and less” and that in turn can reset the table in short term asset allocation and cyclical handicapping.
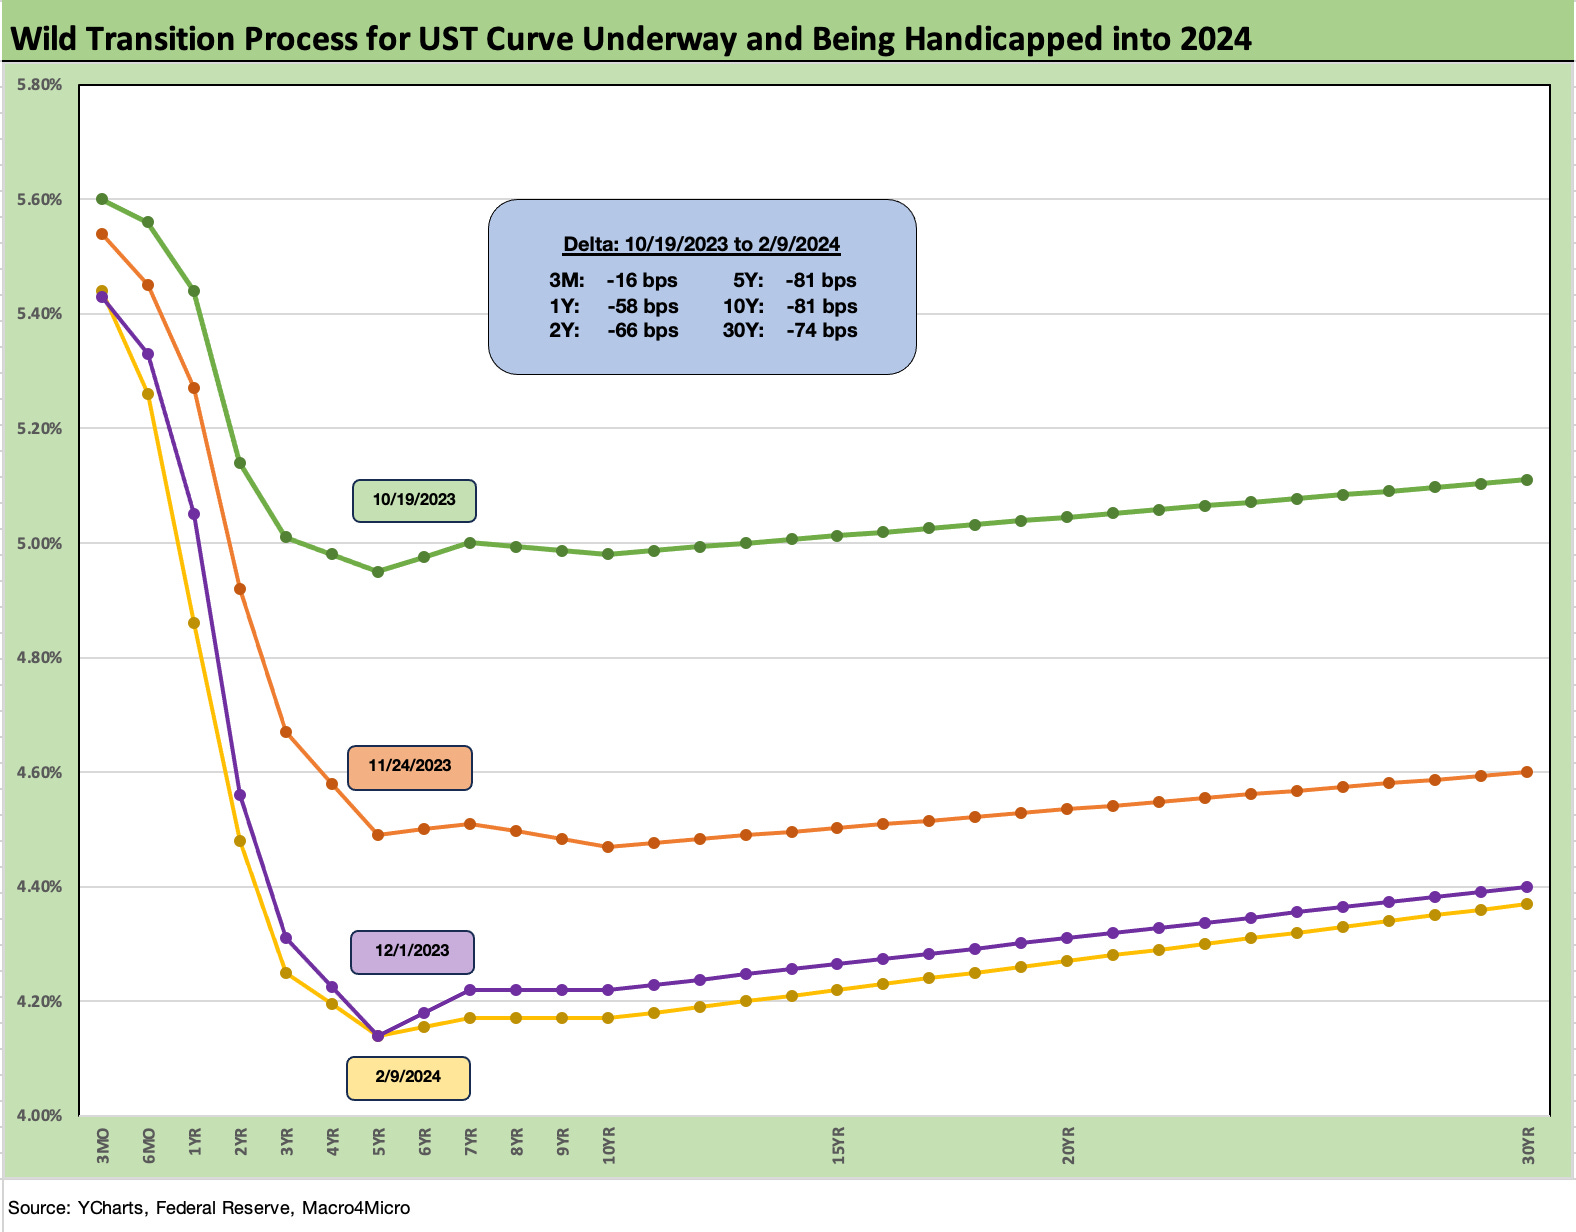
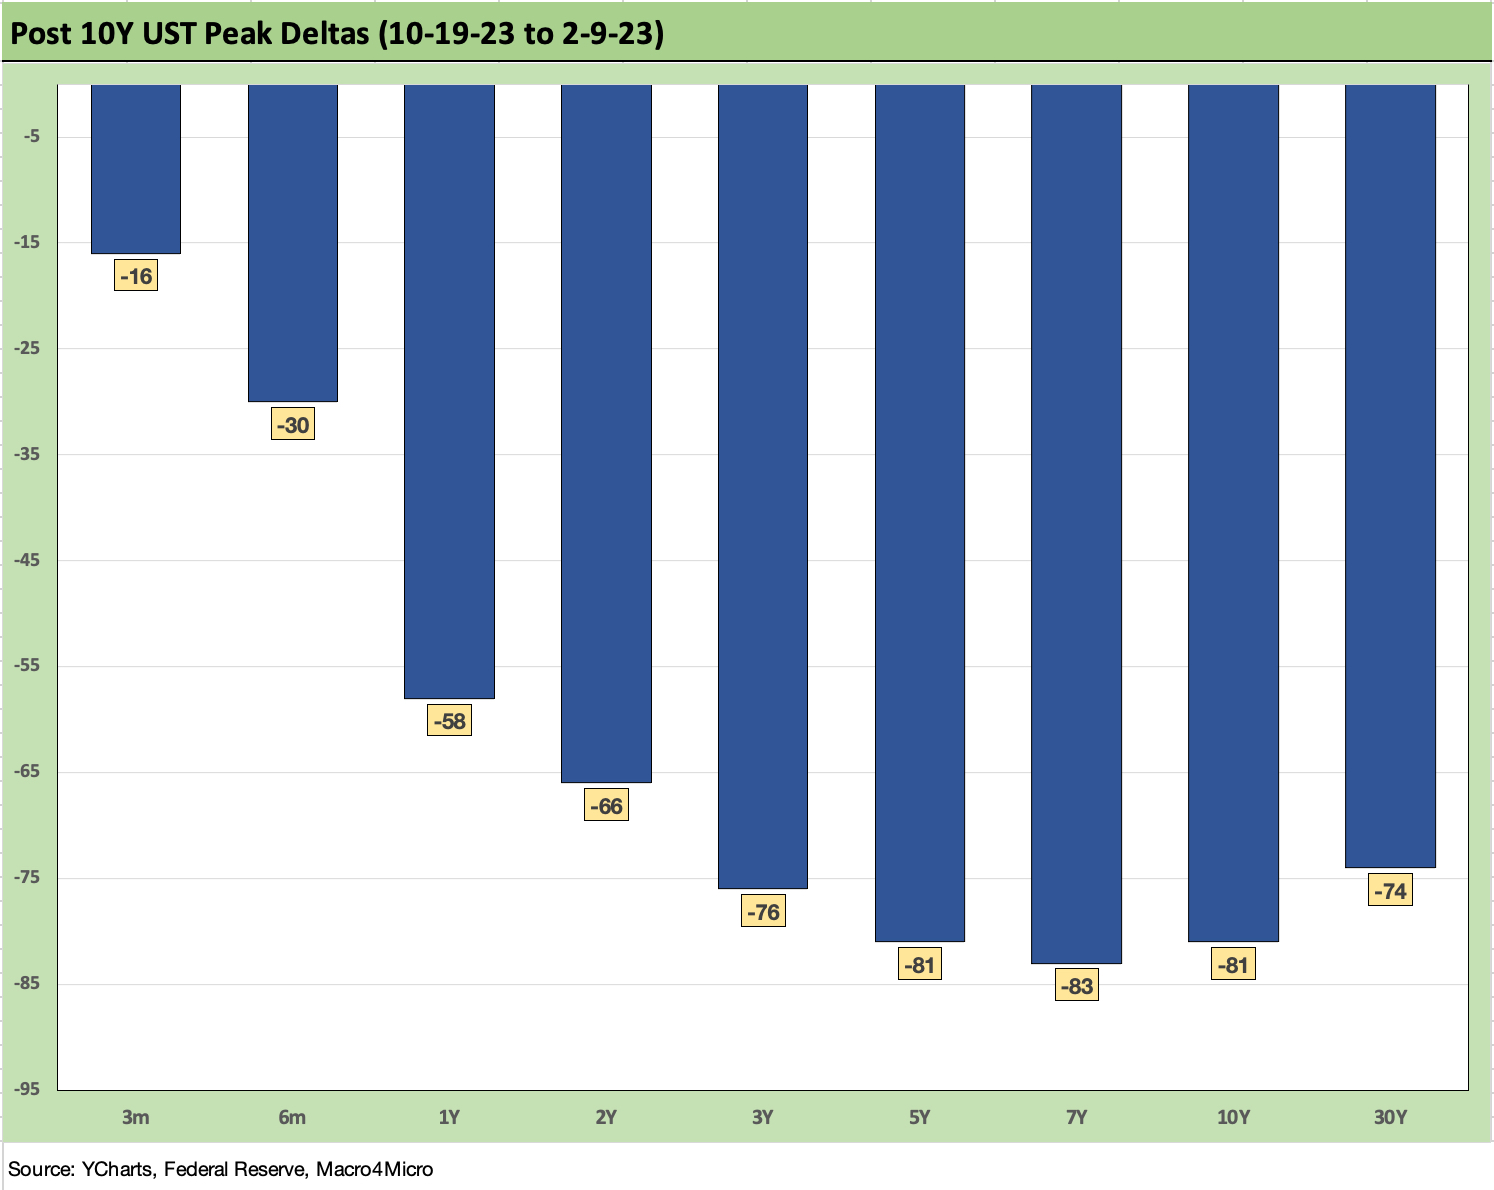
The above chart updates the state of the UST rally since the late Oct peak in the 10Y UST (we chose 10-19-23 for that start date based on the intraday 5% on the 10Y). We included the UST curve delta differentials in the box with the incremental downward shift from 5Y to 10Y leading the UST decline lower in what has been a bull flattener pattern.
We look at asset returns in our separate Footnotes publication that we will post later today, but the duration winnings of the rolling 3 months have been getting dialed back this past week and month with most fixed income ETFs in the red. The HY ETF (HYG) has hung in better during the past week and 1-month time horizon on less duration exposure and spread contraction as fundamentals are hanging in well and the sense that the short duration bond bucket has better risk-reward on Fed policy vs. how the market might vote further out the curve.
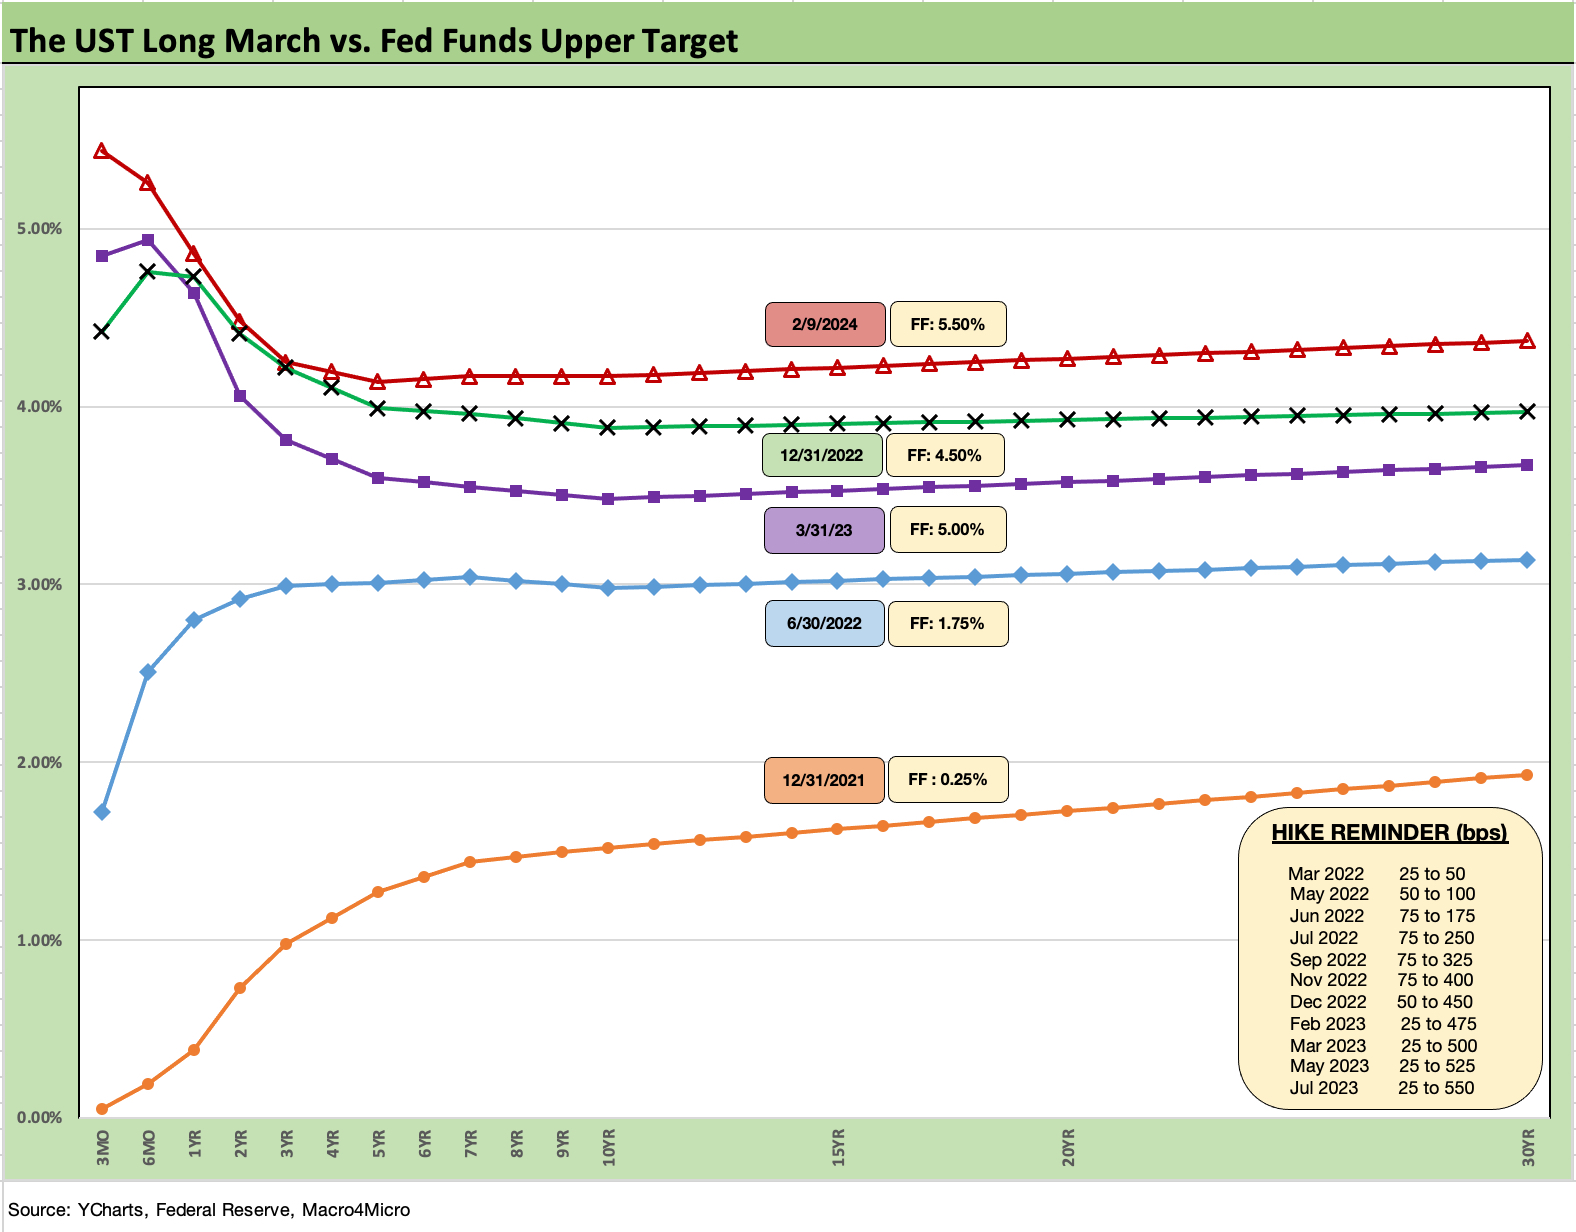
The above chart plots the updated migration pattern of the UST curve since the end of 2021. We include the Fed tightening cycles and dates in the “memory jogger” box featuring the 4x 75 bps moves from June 2022 to Nov 2022. The bear steepener that unfolded in 2023 after various short end rallies still leaves the UST curve higher and steeper than year-end 2022.
The inflation scenarios failed to play out as many expected under recession scenarios. The consumer sector kept rolling and payrolls kept hitting all time highs in body counts with a paycheck (even if too many are part time or structurally underemployed).
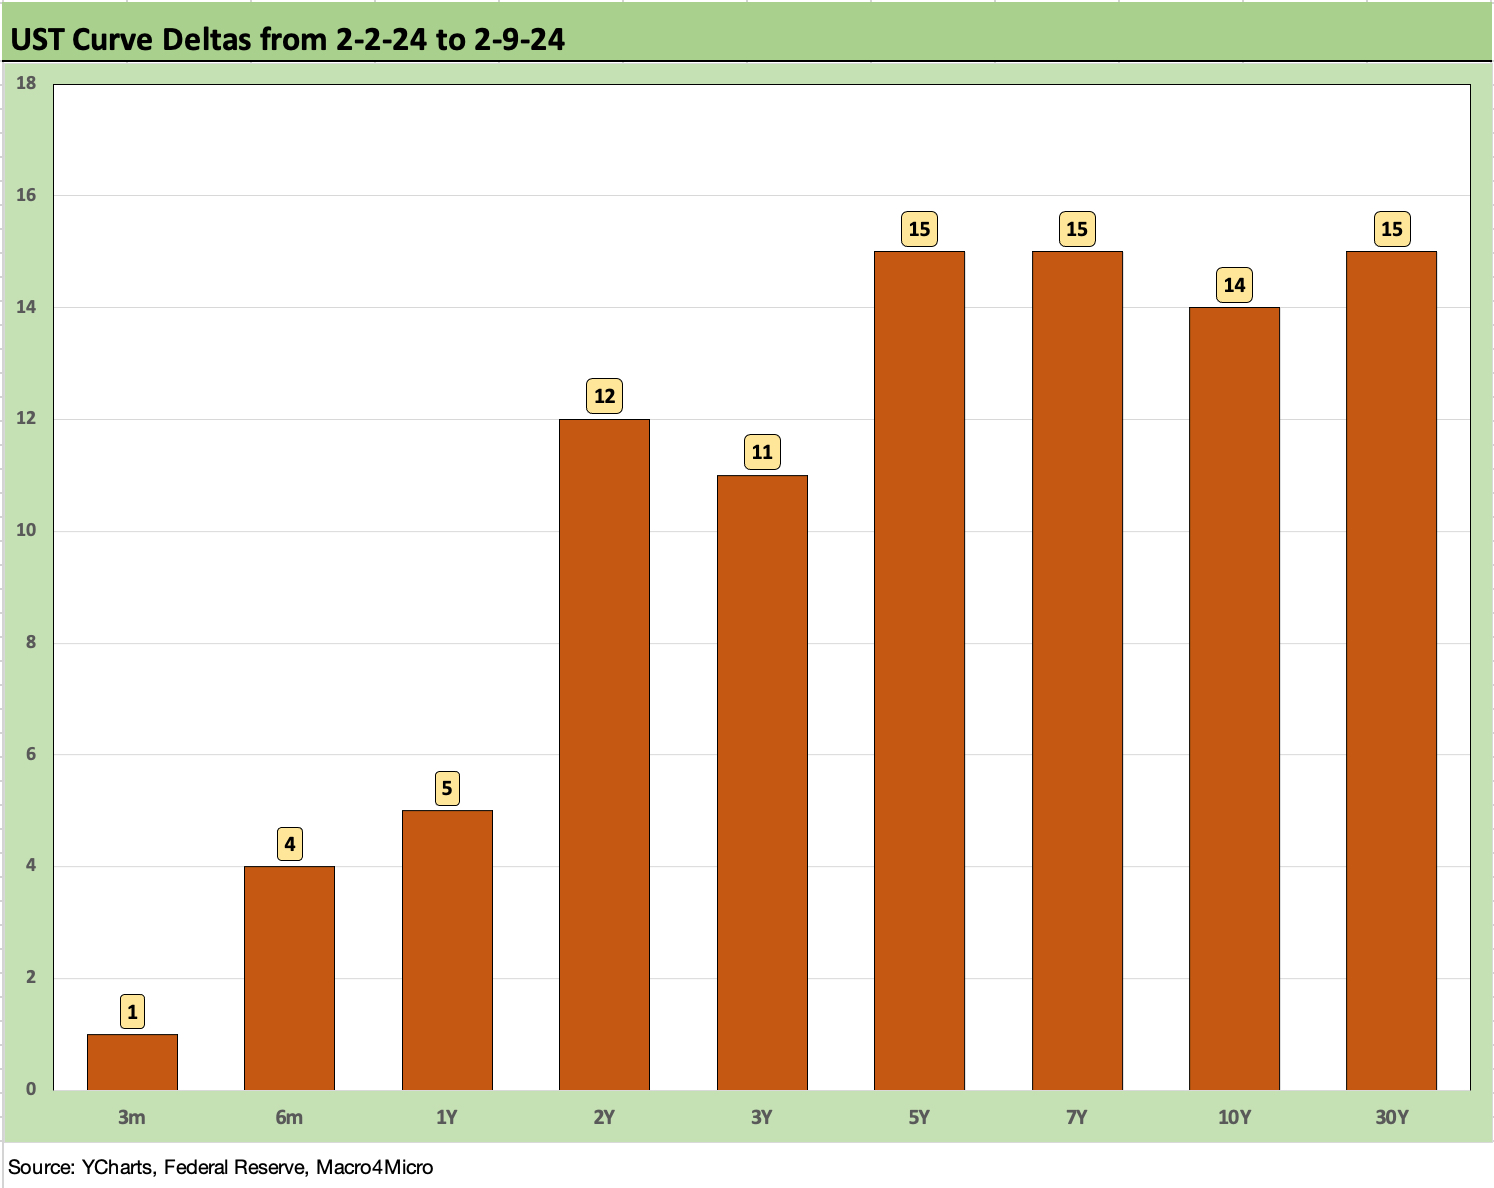
The above chart frames the UST deltas for the past week as duration turns against fixed income returns while credit spreads have resumed their tightening. The shape of the move for the week was a modest steepening from 2Y to 10Y/30Y and a less inverted 3M to 5Y and 3M to 10Y inversion as we update further below in our UST curve slope charts.
The above chart updates the UST deltas since the 10Y peak UST rates of late October. The material downshift and bull flattener offer a reminder of what drove the late year Nov-Dec rally but also dangles the threat of what could happen if inflation numbers do not stay on their positive course and the Fed keeps their “prevent defense” going into the summer.
At some point you are supposed to get a term premium for taking duration risk, but the overwhelming consensus says the risk-reward symmetry is aiming at the short end coming down faster than the long end. Upward sloping is the natural state of affairs, and the question is what path will get us there.
We will get a fresh CPI and PPI read on trends this coming week, and the Retail sales numbers always get a lot of attention around whether (or when) PCE will start to get reeled in even coming off a strong payroll report. The shelter inflation line has been a drag on the pace of CPI declines from headline to core and within services. The higher frequency metrics say those numbers should be coming down based on the diverse mix of rental trends, but the last push toward the 2.0% line for PCE and anything with a 2% handle for CPI is a grind.
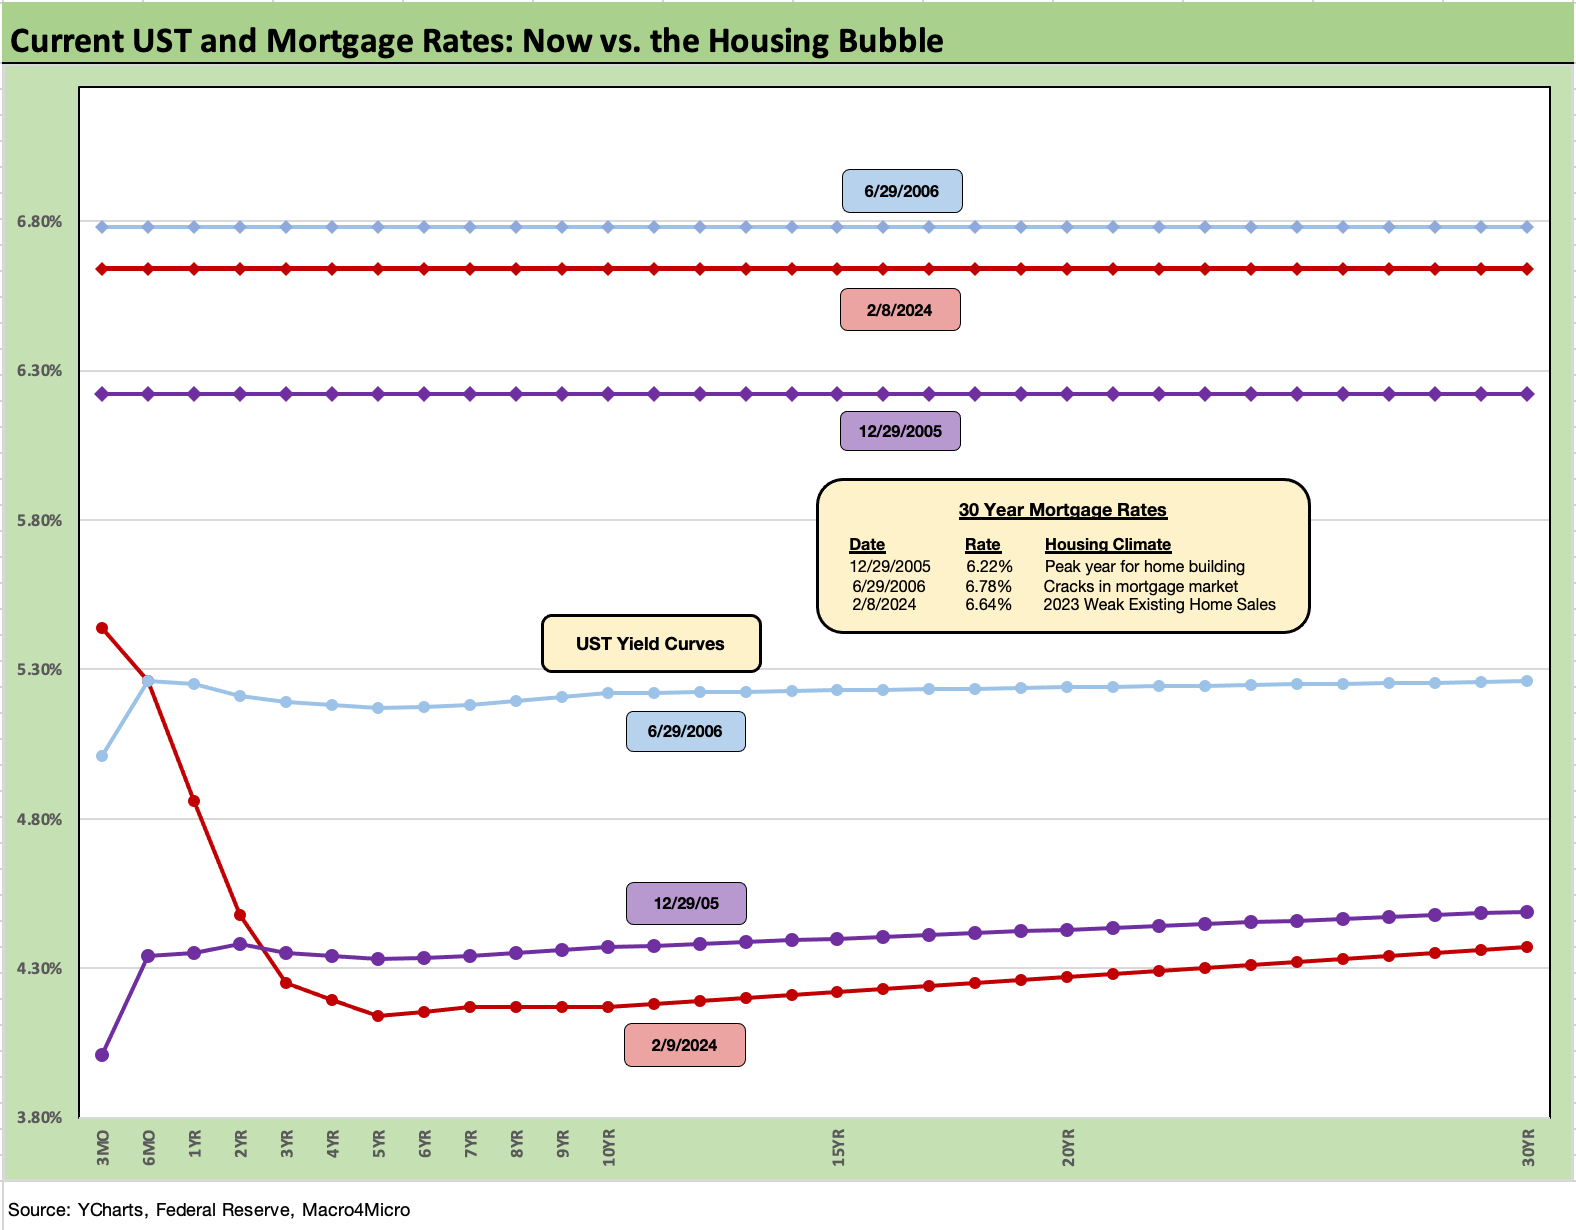
The above chart updates the Freddie Mac mortgage 30Y benchmark as it recovered to 6.6% from almost 6.8% last week ahead of some 7% area quotes on various mortgage providers by Friday. We plot the UST curve to end the week with the Freddie Mac rates and provide comparative context with the peak homebuilding year of 2005 and the mid-2006 time frame of the housing boom when RMBS was starting to show its true colors.
The housing cycle history offers a reminder that price combined with mortgage rates are what dictate affordability, and right now the combination does not work for many and notably with rates high and inventory for sale low. Meanwhile, the pace of the increase relative to the 60% of outstanding single-family mortgages below 4% slaps the golden handcuffs on many potential sellers.
We looked at some of the histories in more detail in our year end recap (see Footnotes & Flashbacks: State of Yields 1-1-24 ) and the situation remains pretty much at status quo for the affordability challenges that have driven so much downward inventory pressures relative to norms in existing home sales while squeezing out many buyers of new homes as well.
We have covered those affordability, golden handcuff, and monthly payment shock topics in our monthly housing commentaries on the usual three releases (starts, existing home sales, new home sales) as well as in our single name work (most recently D.R. Horton: Credit Stronger Even if Stock Takes a Step Back 1-19-24).
The builders have more tricks up their sleeves to drive volume in tandem with their mortgage units using various fee incentives and mortgage buydowns. The builder marketing flexibility plus the demographic needs and supply-demand imbalances helped the builders turn in a banner 2023 near the top of the stock return ranks. Housing starts are teed up again this coming week.
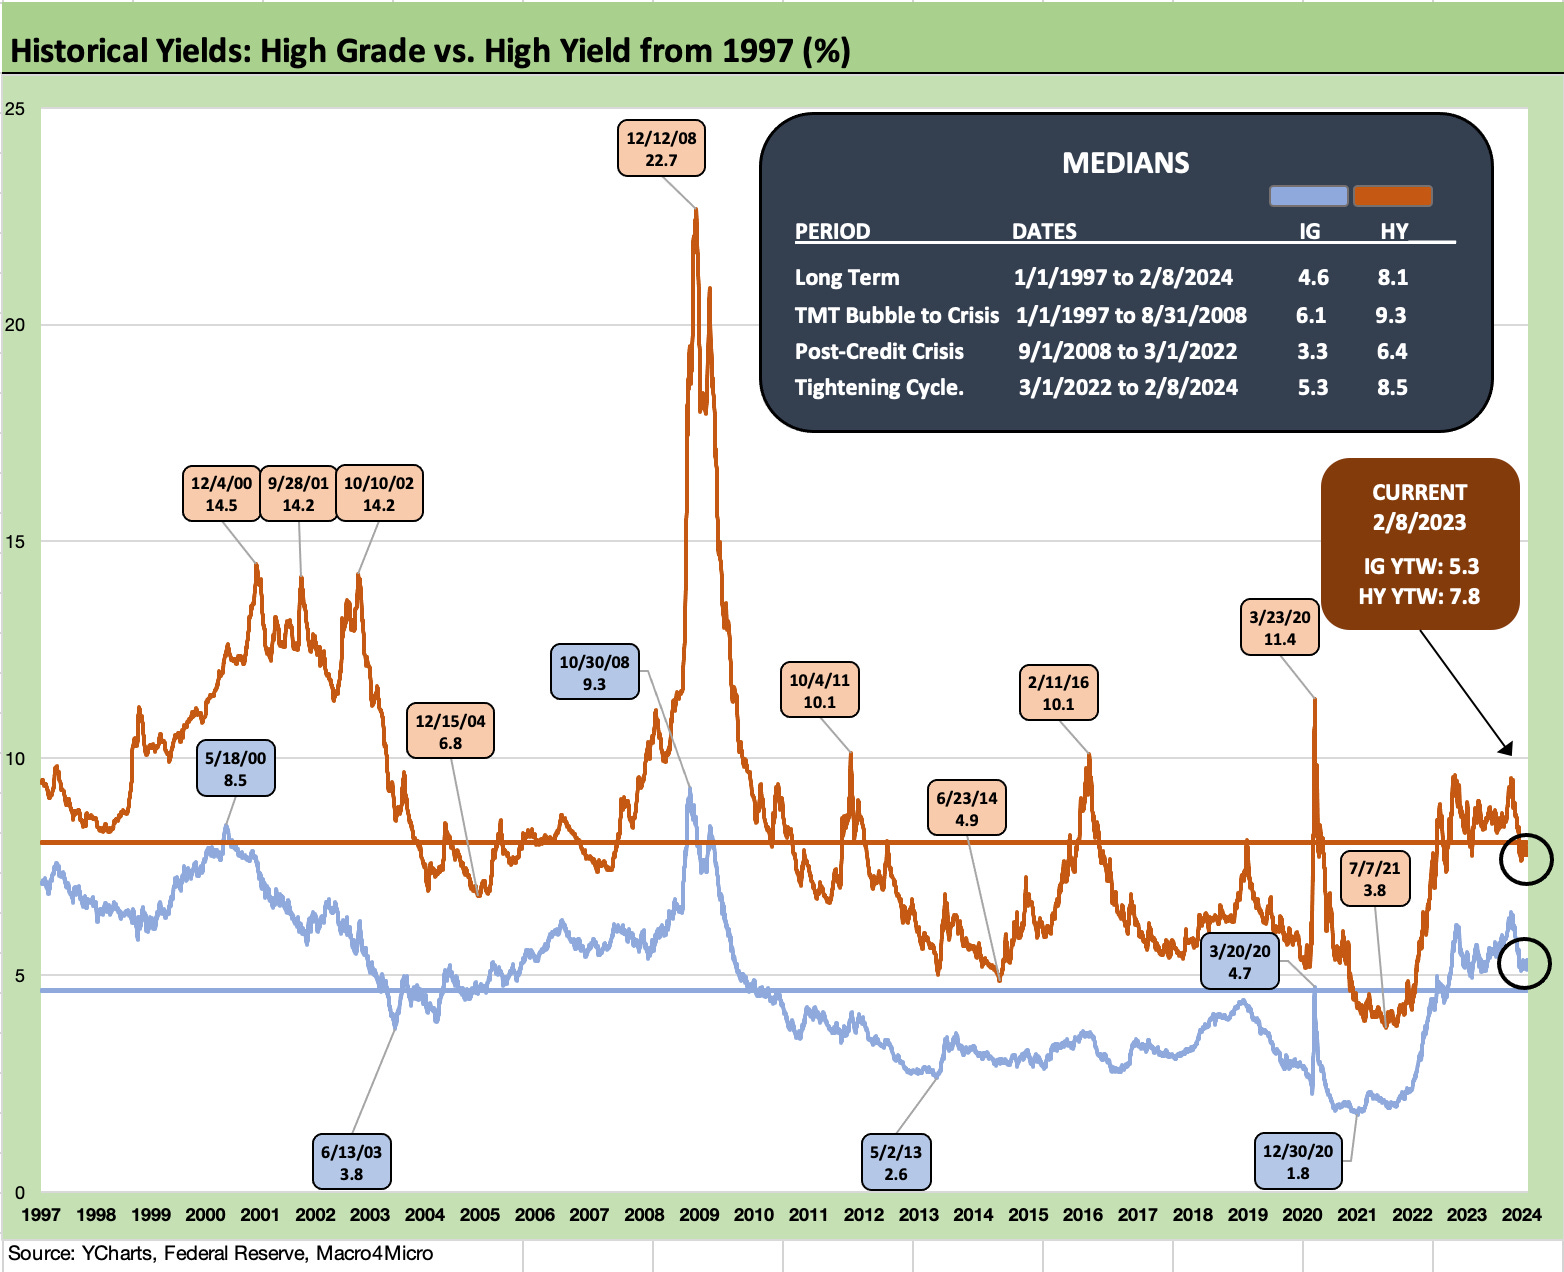
The above chart offers some historical context on all-in yields in a still-historically-low UST market outside the post-crisis and COVID years that saw long stretches of ZIRP and bouts of QE.
At 5.3%, IG yields are ahead of long-term median of 4.6%, but below the median of 6.1% during the stretch from the TMT years to the time right before the Lehman meltdown of Sept 2008. The post-crisis median through just before the tightening cycle of March 2022 was +3.3% for IG. The 5% handle for today’s 3M UST offers some context on those yields.
HY yields at 7.8% are below the long-term median of 8.1% and further below the TMT Bubble to Crisis median of 9.3%. For US HY, spreads are low and this week’s +333 bps OAS wrap on Friday just again dipped below the June 2014 HY credit cycle lows (+335 bps on 6-23-14) before the later cyclical low point for OAS in early Oct 2018 of +316 bps (10-3-18).
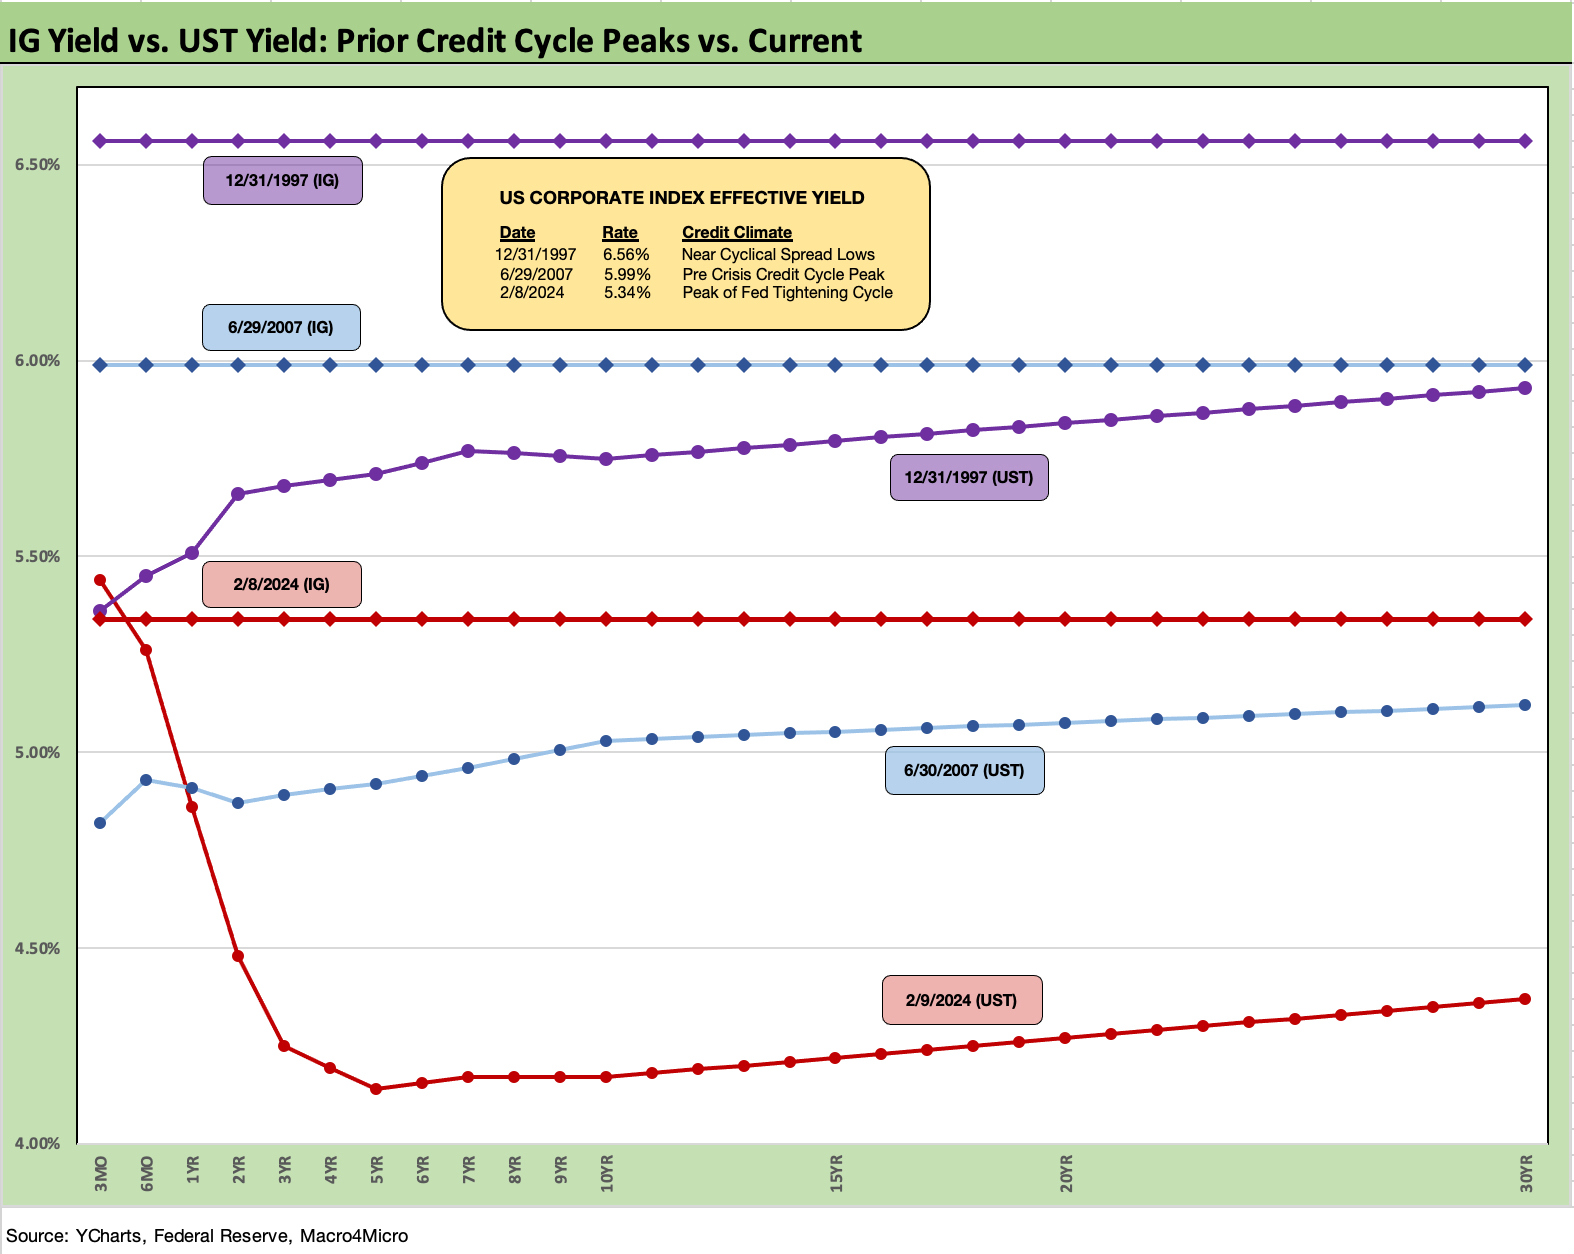
The above chart gives more context to where IG yields and the UST stand today vs. prior peak credit cycles in June 2007 and Dec 1997. We review and compare those periods to today in our 2023 recap (see Footnotes & Flashbacks: State of Yields 1-1-24).
Today the UST curve is materially lower than the 2007 and 1997 credit cycle peaks, but Friday’s IG spread close of +100 bps is very close to the running averages of 1997-1998 and 1H04 to 1H07. The all-time low for IG was +53 bps in Oct 1997. That Oct 1997 number was an outlier.
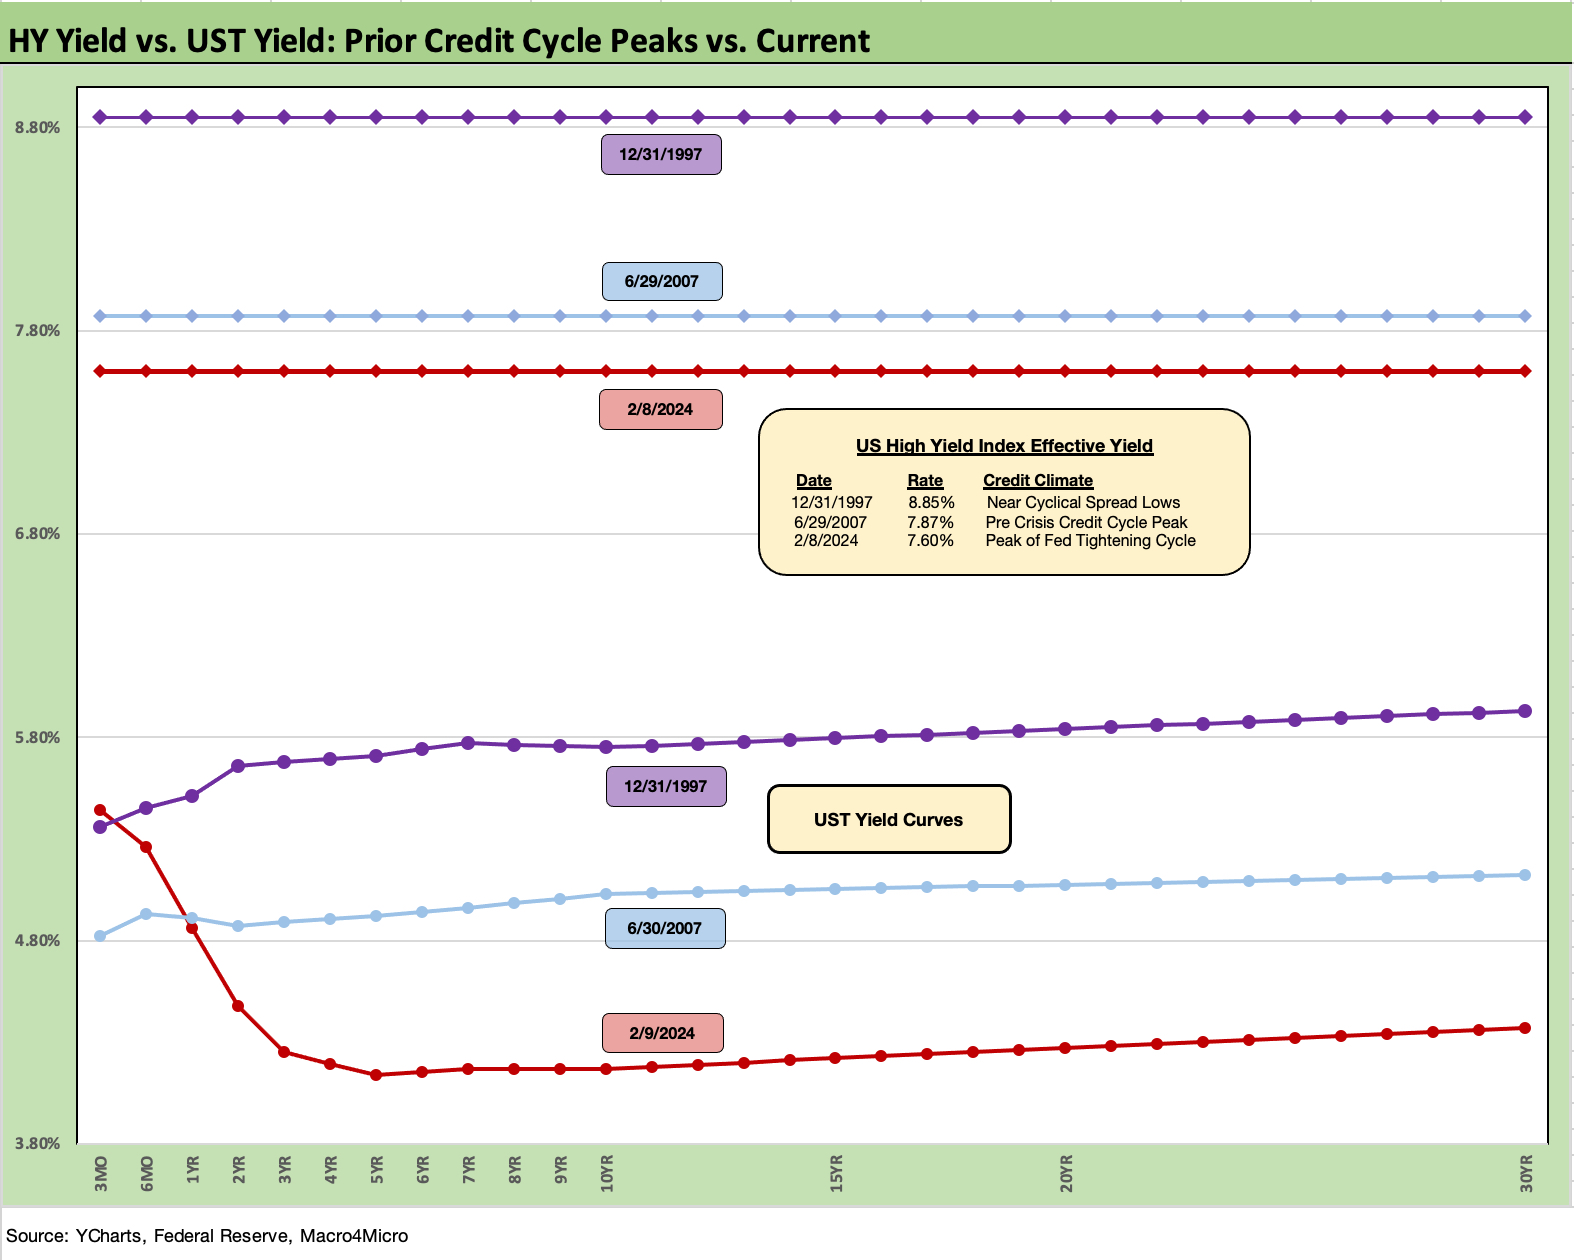
The above chart does the same exercise for the HY index and UST curves of the 2007 and 1997 credit peaks. As we have covered in the 2023 recap (see Footnotes & Flashbacks: State of Yields 1-1-24), HY spreads remain well above the 1997 and 2007 lows with a higher overall average quality mix today with a heavier weighting of BB tier exposure than the credit bubble of 2007 with the record sized LBOs and the 1997 TMT excess.
That level of yield relative to the post-crisis years has been enough to keep holders in the game. Such yields have not been seen routinely since the pre-crisis period except during periodic HY spread waves such as 2011, 2016, and during COVID as detailed in the earlier IG vs. HY yield chart.
The compressed spreads of late 2023 and early 2024 leave a lot of room for error on cyclical handicapping, but the fundamentals do not show signals of recession yet – let alone a hard landing. It is generally very hard to spook seasoned HY managers.
Asset allocation trends have also favored credit risk of late in retirement asset allocation. We see that in the daily (hourly?) headlines in the press, social media, and trade literature covering private credit and direct lending. We are also in BDC earnings season with the brand name credit leaders giving their views.
Overall, the yield starvation from depressed UST rates for so many years has caused many investors with a longer time horizon to be less focused on fair spreads and more on yield levels.
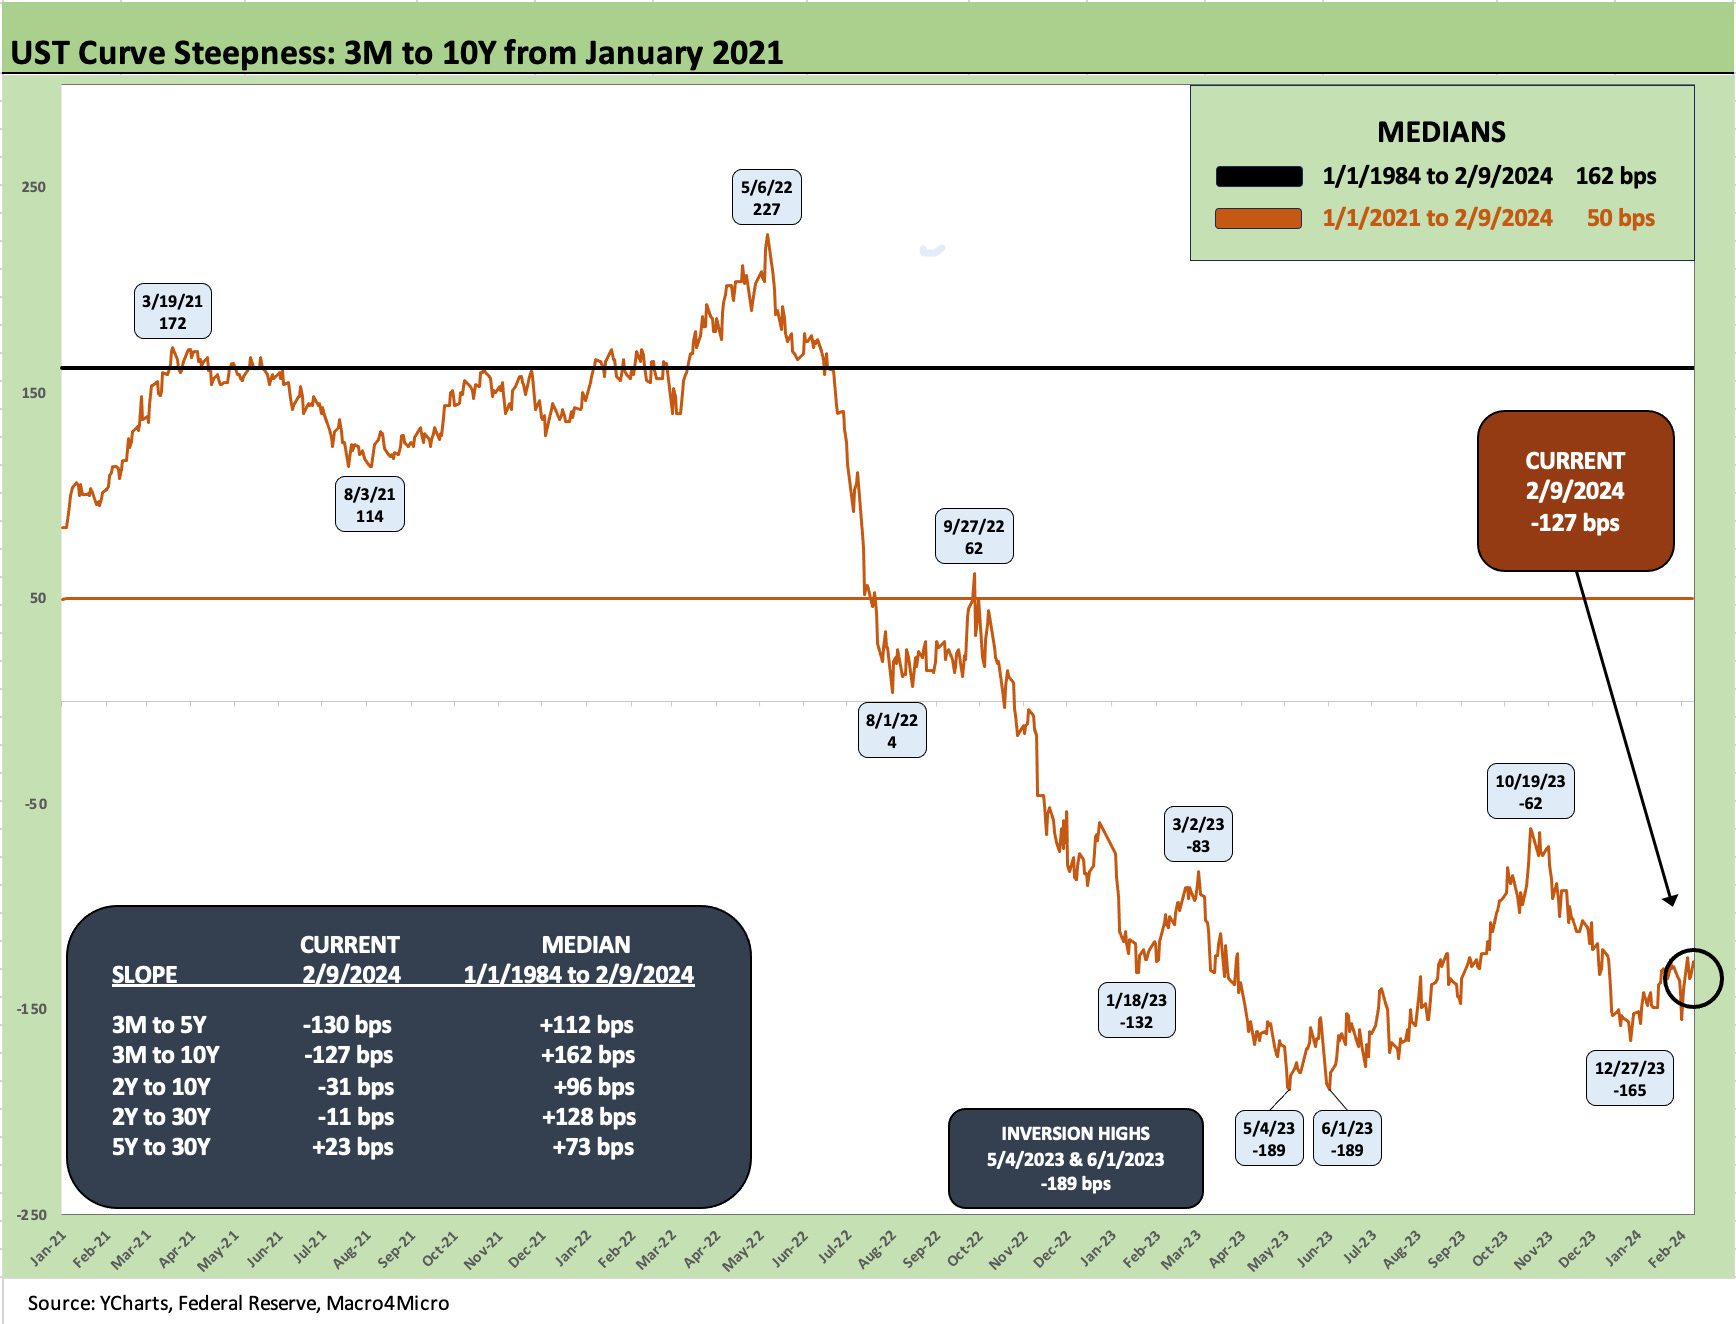
The above chart updates the 3M to 10Y UST slope chart from Jan 2021. The inversion of -127 bps is still well short of the -189 peak inversion seen in the late spring of 2023. Nothing the Fed has said signals a near-term end to this inversion. The threat could come from the long end with more upward migration of the 10Y if inflation (PCE or CPI) does not keep cooperating as the trend has to date.
We also update the slope of the other yield curve segments we like to watch and include their long-term upward sloping medians. As of now, the only segment on the list we track which is upward sloping is the 5Y to 30Y.
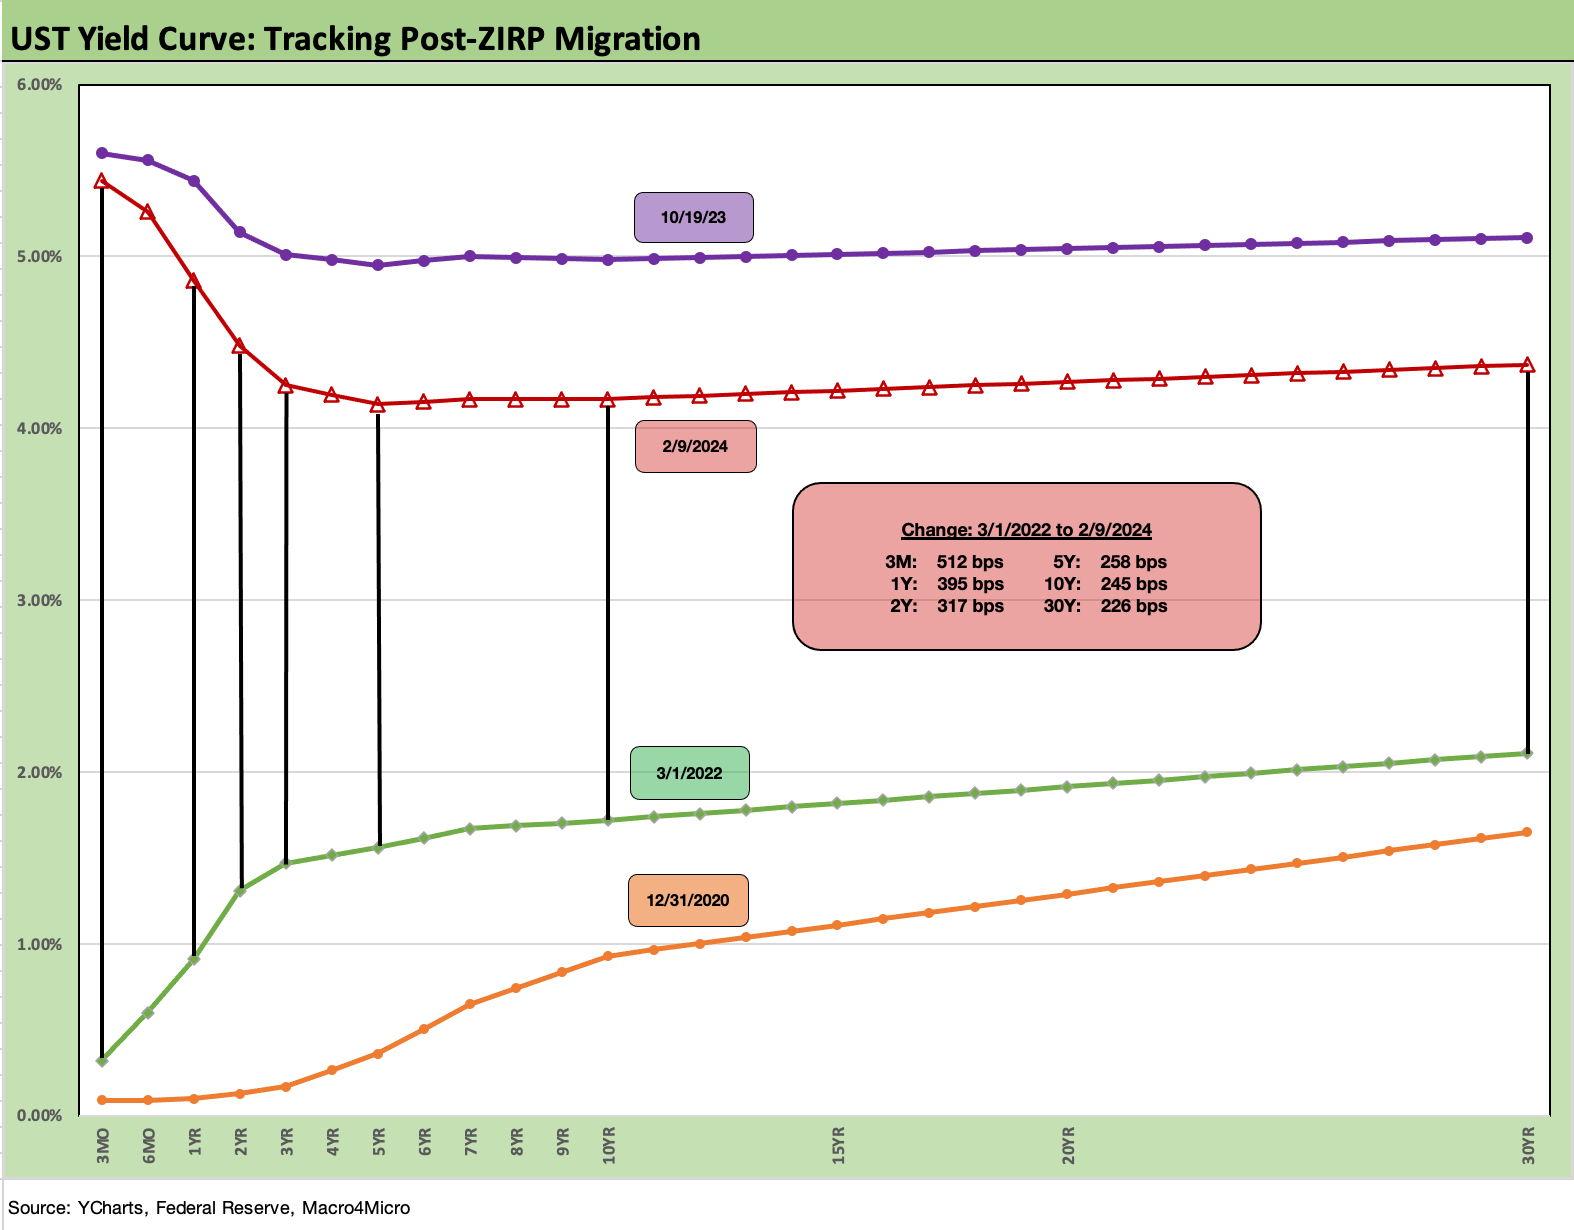
We wrap with our usual final chart that tracks the running migration of the UST curve from the start of March 2022 when ZIRP ended (the move off ZIRP went into effect on March 17) through last week. We also include a 12-31-20 UST curve as a frame of reference along with the UST curve on 10-19-23 around when the 10Y UST peaked. We include a box with the UST curve delta from the start of Marh 2022 to Friday of the past week.
The bear inversion numbers during that time frame included a lot of action on the way to the current shape of the curve. The lingering threat and the fear of a “steepening toward a flattening” if Goldilocks takes the wrong direction in life or inflation refuses to cooperate. For now, the balance of indicators (see links below) show progress on inflation and a mix of metrics that on balance are not pointing at “too hot” given the slowing on the rate of growth on the consumer side in some important metrics and some mixed manufacturing results. We also see industrial production this coming week.
See also:
Fed Funds vs. PCE Inflation: Peaks and Valleys Across Time 2-7-24
Payroll Jan 2024: Big Swing 2-2-24
Productivity: Takes the Edge of the 4% Handle YoY ECI 2-1-24
Employment Cost Index Dec 2023: Compensation Mixed Picture 1-31-24
JOLTS Dec 2023: “Little Changed” on Replay 1-30-24
PCE Release Dec 2023: Consumption Strong, Inflation Favorable 1-26-24
Consumer Sentiment: Multiple Personalities 1-19-24
Dec 2023 CPI: Big 5 and Add-Ons, the Red Zone Challenge 1-11-24