
Footnotes & Flashbacks: Asset Returns 2-11-24
We look at asset returns in a bad week for bonds and a good week for stocks as earnings season continues to please.


UST setbacks for fixed income and duration damage was the theme of the week with the long duration UST 20Y+ ETF (TLT) the second worst performer in our benchmark/ETF peer group of 31 that we track with 5 of the 6 bond ETFs in the red with HYG just across the line in the positive zone.
One theme was a better breadth of recovery in stocks beyond the big tech names and tech-centric ETFs vs. the prior week with small caps making a move along with Transports and Builders.
Regional banks got off the mat but still limped to a negative week with the larger mix of financials (XLF) barely positive as interest-sensitive Utilities (XLU) and Consumer Staples (XLP) also faltered in a bad week for UST.
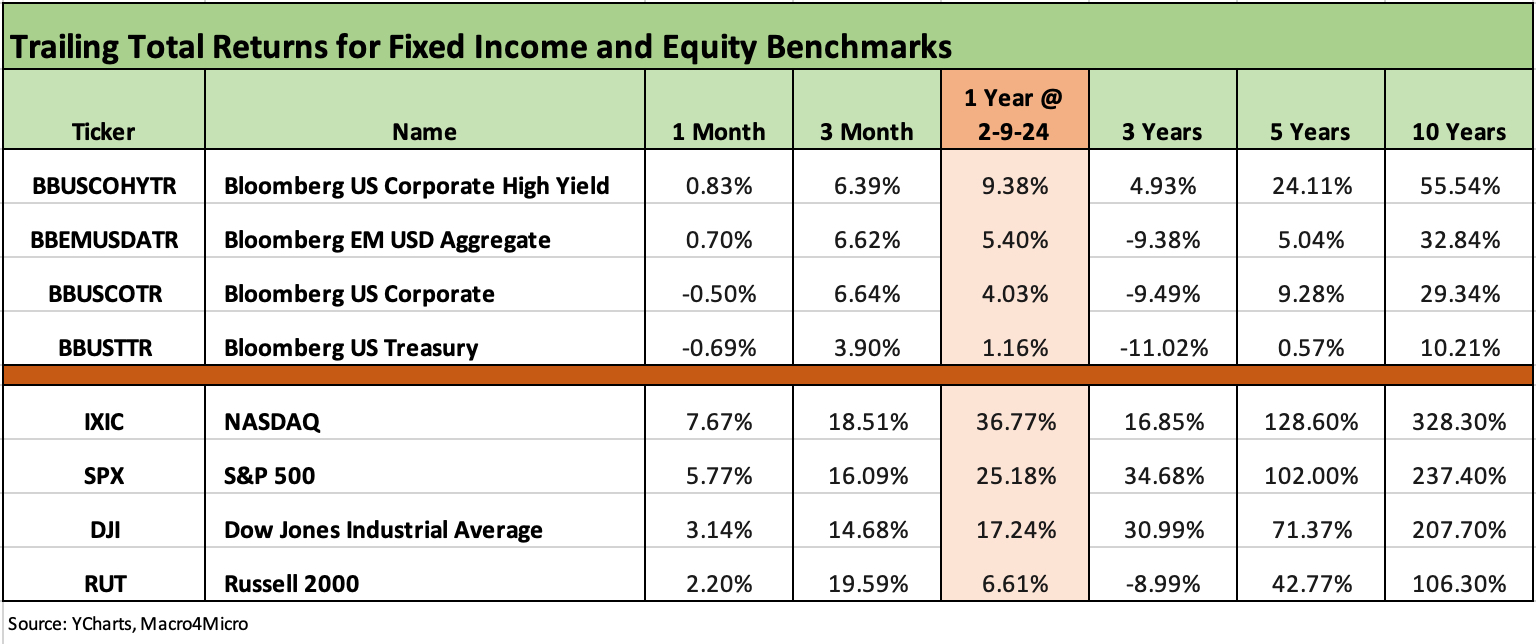
The above chart updates the running returns for the major debt and equity benchmarks we follow. We see the IG Corporate and UST benchmarks in the negative zone for the past 1-month horizon after another adverse yield curve week. Last week was bullish for UST until the Friday jobs numbers ate into it with a surprise upside pop (see Payroll Jan 2024: Big Swing 2-2-24, Footnotes & Flashbacks: State of Yields 2-4-24). Earnings season has helped across a range of industries and with so many major bellwether companies now having reported.
The year finished so strong for so many asset classes in Nov-Dec that the 3-month horizons are still living off 2-month numbers that for some asset classes would make for a respectable year. Equities are off to a good start in 2024 for many bellwethers with some “record” headlines for the Dow and S&P 500 (crossed 5,000, etc.) while small caps were making a stronger stand this week. Tech is still at the helm after an especially strong performance for the rolling month through last week (see Footnotes & Flashbacks: Asset Returns 2-4-24).
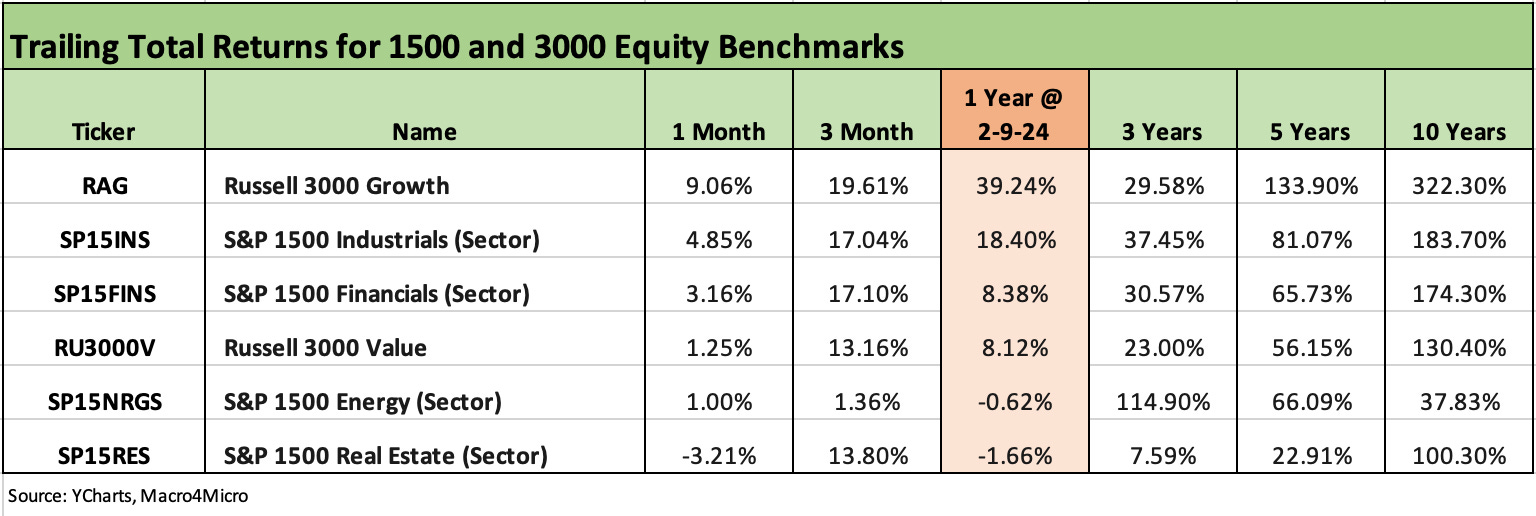
The above chart updates the 1500 and 3000 series, and the themes around the outperformance of growth stocks just keep on coming at +9.1% for the month after a very strong finish to a bullish 2023 for tech. The rolling 1-month numbers improved over last month with a new week dropped in with Industrials and Financials edging higher and Energy moving out of the negative range for the 1-month period. Real Estate was still ugly but less negative for the rolling period compared to last week.
The rolling return visual
In the next section we get into the details of the 31 ETFs and benchmarks for trailing periods. The collection of four charts below looks a lot like some recent Footnotes publications and we still see a bias toward the positive side for the current 1-week collection at 18-13 vs. 21-10 last week and down from 26-5 the prior week.
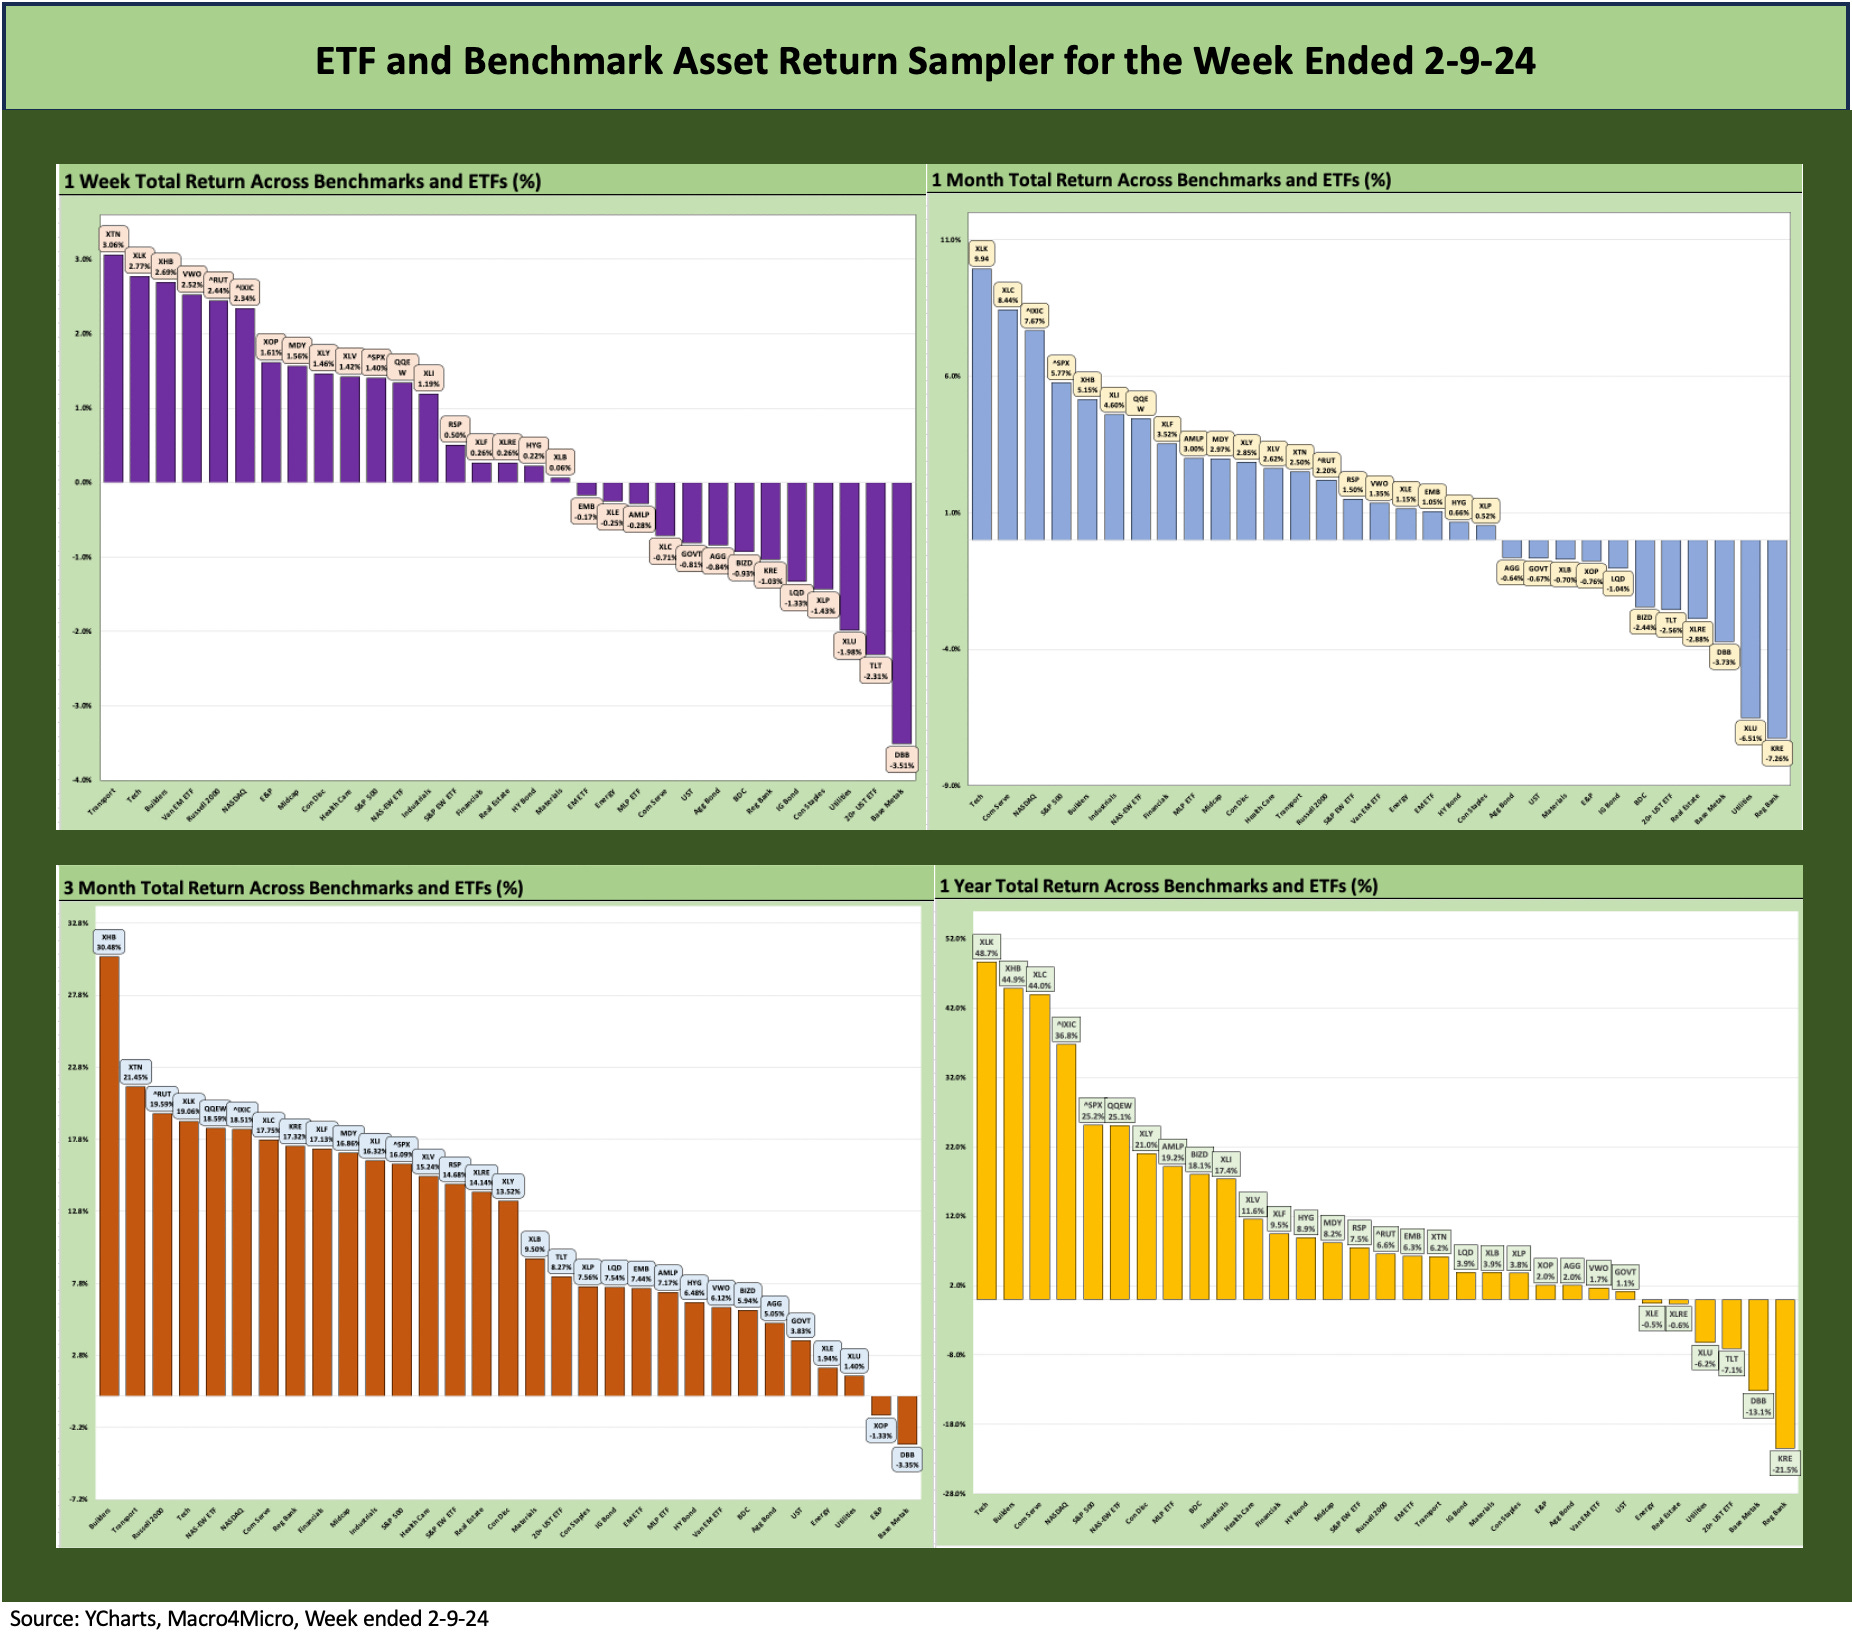
It will take some weeks to move the needle from the very strong numbers in Nov-Dec 2023 that in many cases included double digit return finishes to the year over 2 months. We see only 2 line items negative over the rolling 3 months at 29-2 with 25 positive and only 6 negative over the trailing year.
We look at the returns of the 31 benchmarks and ETFs in more detail further below.
The Magnificent 7 heavy ETFs…
Some benchmarks face issuer concentration elements that leave them wagged by a few names. When looking across some of the bellwether industry/subsector ETFs, it is good to keep in mind which narrow ETFs (vs. broad market benchmarks) get wagged more by the “Magnificent 7” including Consumer Discretionary (XLY) with Amazon and Tesla, Tech (XLK) with Microsoft, Apple, and NVIDIA, and Communications Services (XLC) with Alphabet and Meta.
The past week was more mixed across the group of 31, but the trailing 1-month period has the top 4 of the top quartile either tech-centric or Mag 7 heavy in the returns. For the rolling 3 months, the Top 3 included the Builders (XHB) at #1, the Transports at #2, and small caps at #3, but below that we still see Tech and Mag 7 as half the top quartile. The steady performance of the builders has been one of the more notable events this past year and the rolling 3 months.
ETF and benchmark time horizon returns…
In the next 4 charts, we look at 1-week, 1-month, 3-month, and trailing 1 year returns for the full range. We include 6 fixed income ETFs in the mix across UST (GOVT), long duration 20+ Year UST (TLT), IG bonds (LQD), the Aggregate Bond index (AGG), EM Sovereign (EMB), and HY Bonds (HYG).
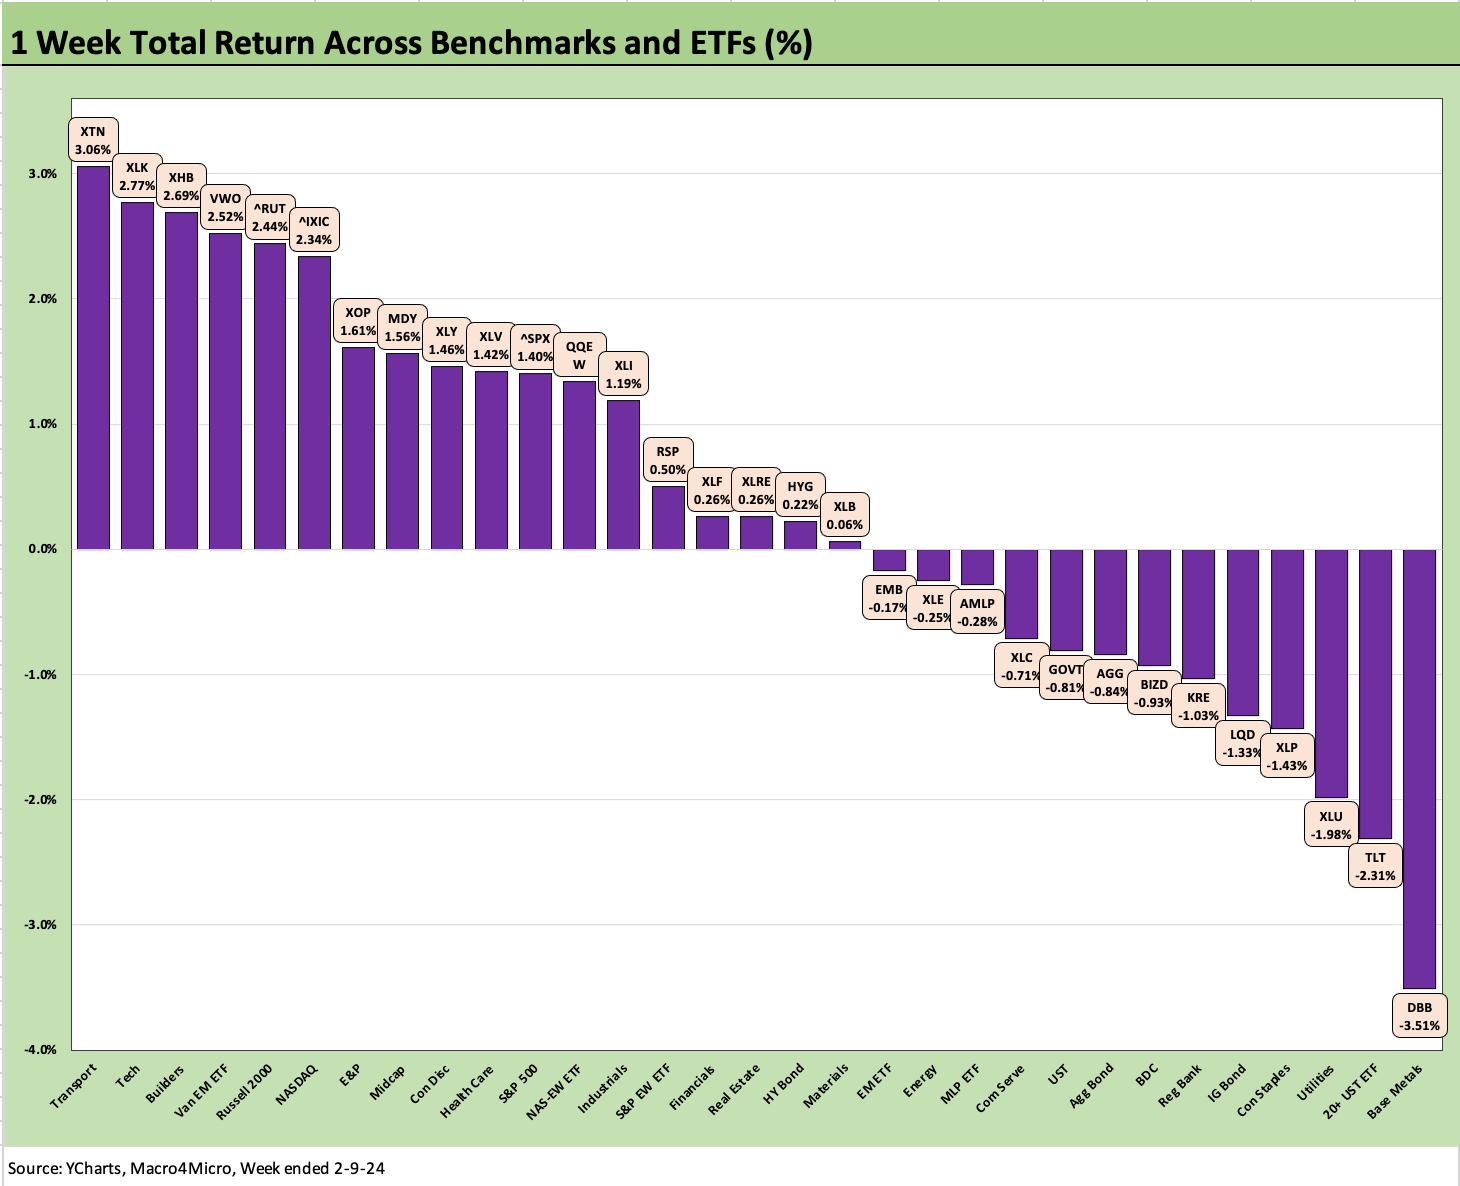
The 1-week numbers are still balanced to the positive side at 18-13, but we see 5 of 6 fixed income ETFs negative with only HYG edging into the positive zone this week. TLT was a big victim on the long rates moving higher with a -2.3% week in second to last only trailed by Base Metals (DBB) at -3.5%.
We see an eclectic mix at the top for the week with Transports (XTN), Tech (XLK), Builders (XHB), EM Equities (VWO), and Russell 2000 small caps (RUT) taking the Top 5 and NASDAQ (IXIC), E&P (XOP) and Midcaps (MDY) rounding out the top quartile.
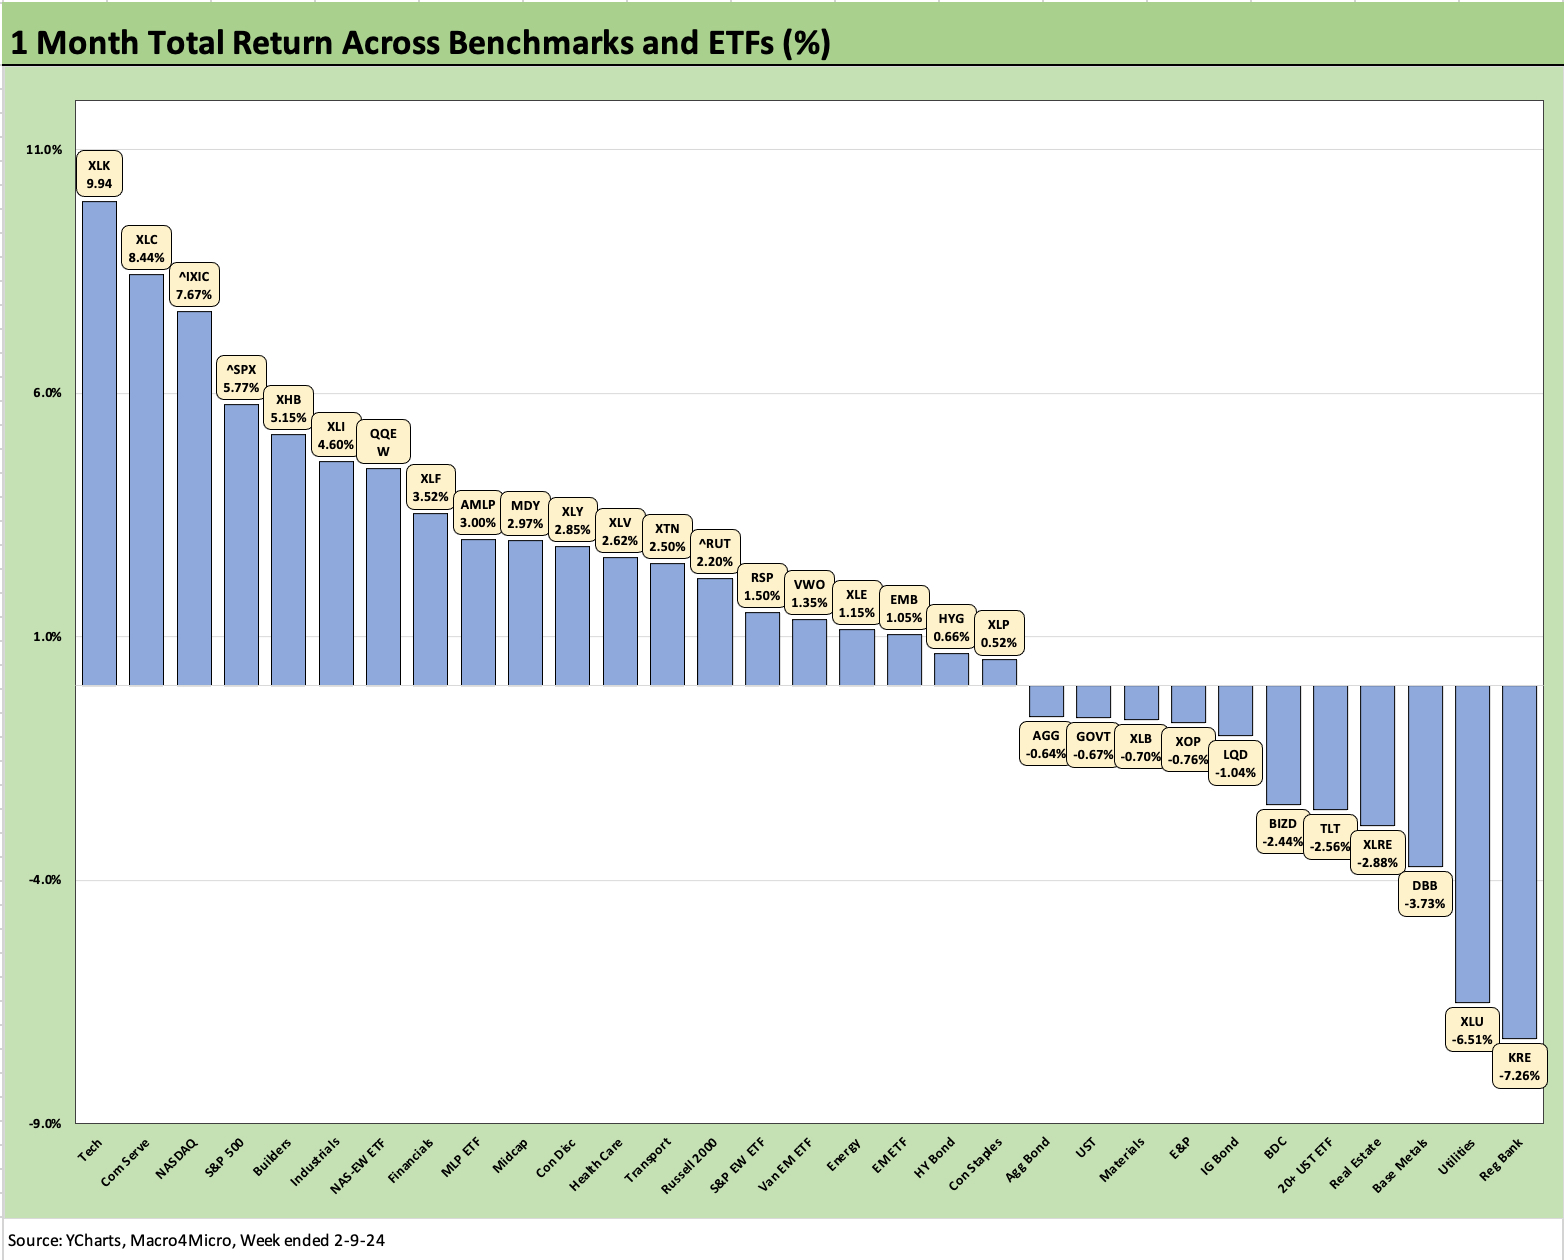
The 1-month returns have held in well at a 20-11 score. The biggest victims on the right side of the chart above have been Regional Banks (KRE) and the interest rate sensitive sectors such as Utilities (XLU) and Real Estate (XLRE) while 4 of the 6 fixed income ETFs came up in the red with TLT the worst on the duration effects of the UST shift so far in 2024. HYG and EMB made it across the positive line. X
As mentioned above, Tech and Mag 7 carried the month with XLK, XLC, IXIC, and SPX riding the Mag 7 and tech-centric and growth plays broadly with the equal weighted NAS 100 ETF (QQEW) making the top quartile also.
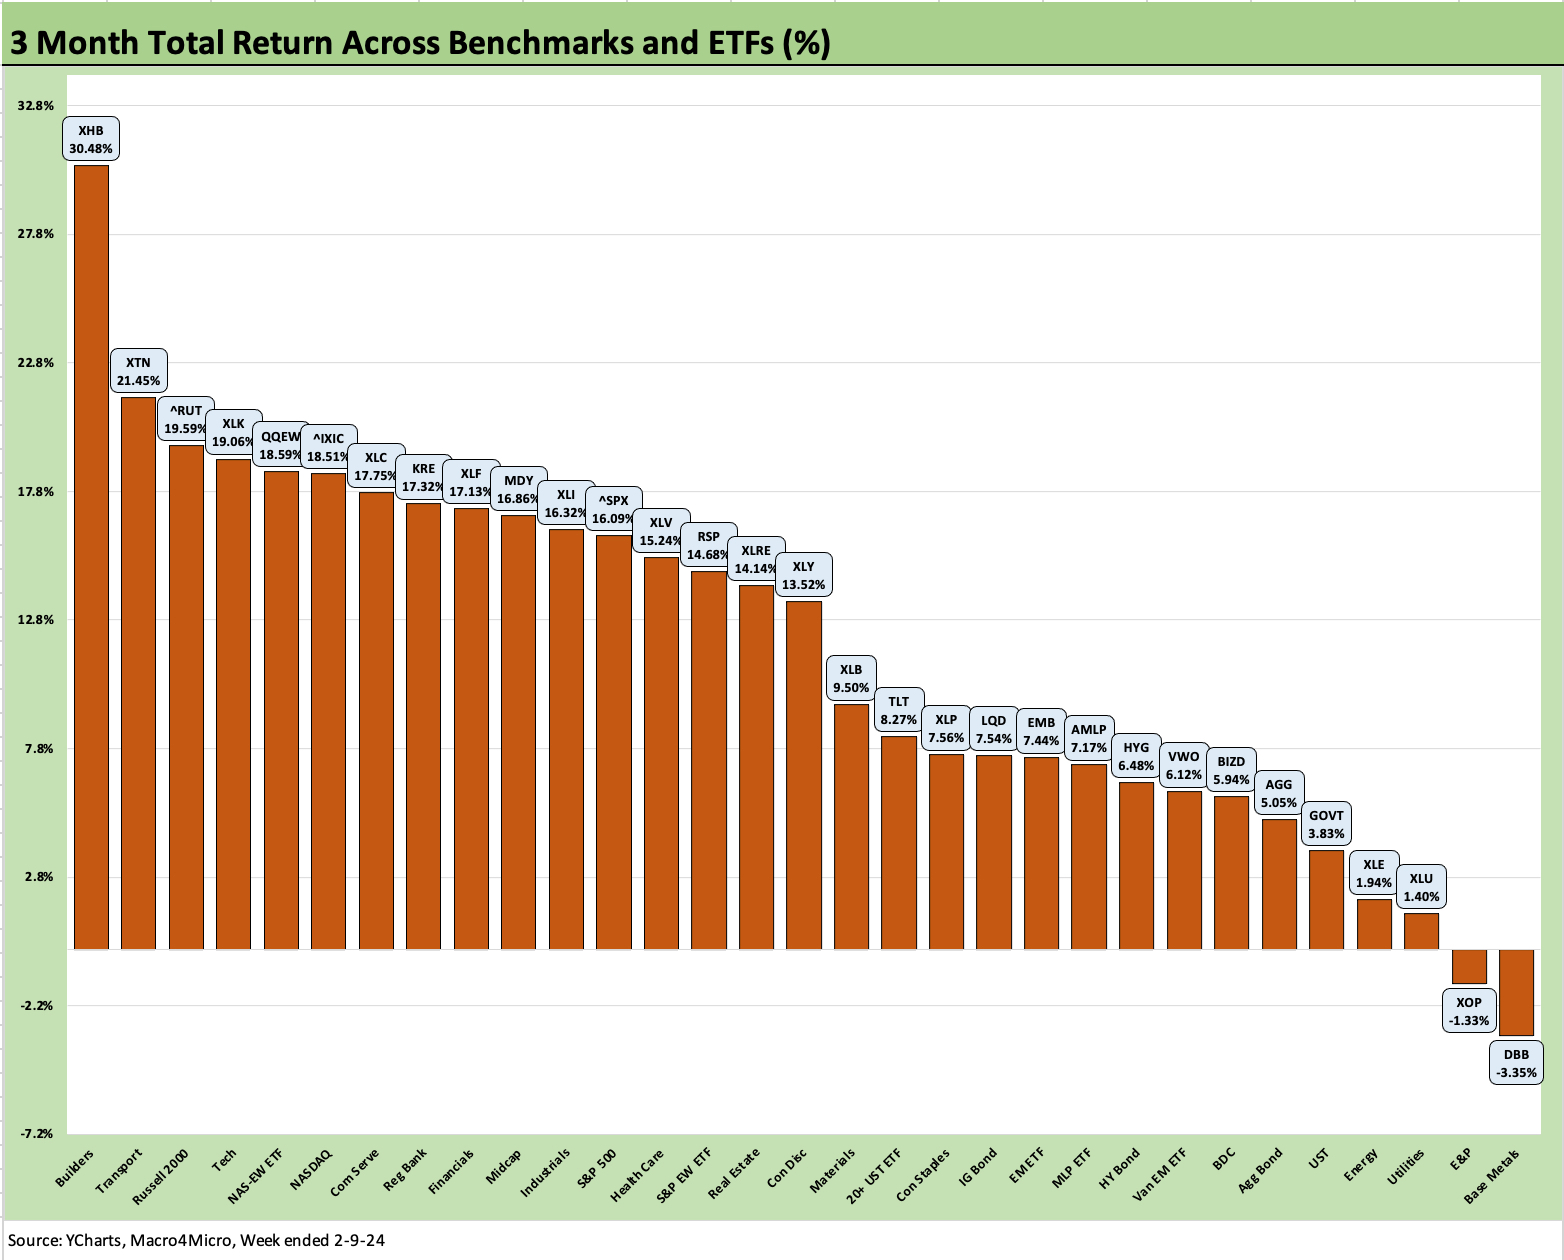
The rolling 3 months has only 2 names in the red with the Base Metals ETF (DBB) at -3.4% just ahead of the E&P ETF (XOP) at -1.3% for 3 months. We see 2 fixed income ETFs (GOVT, AGG) in the bottom quartile and 4 in the 3rd quartile with HYG, EMB LQD, and TLT. TLT and LQD are still riding the strong Nov-Dec duration returns with TLT at +8.3% over 3 months.
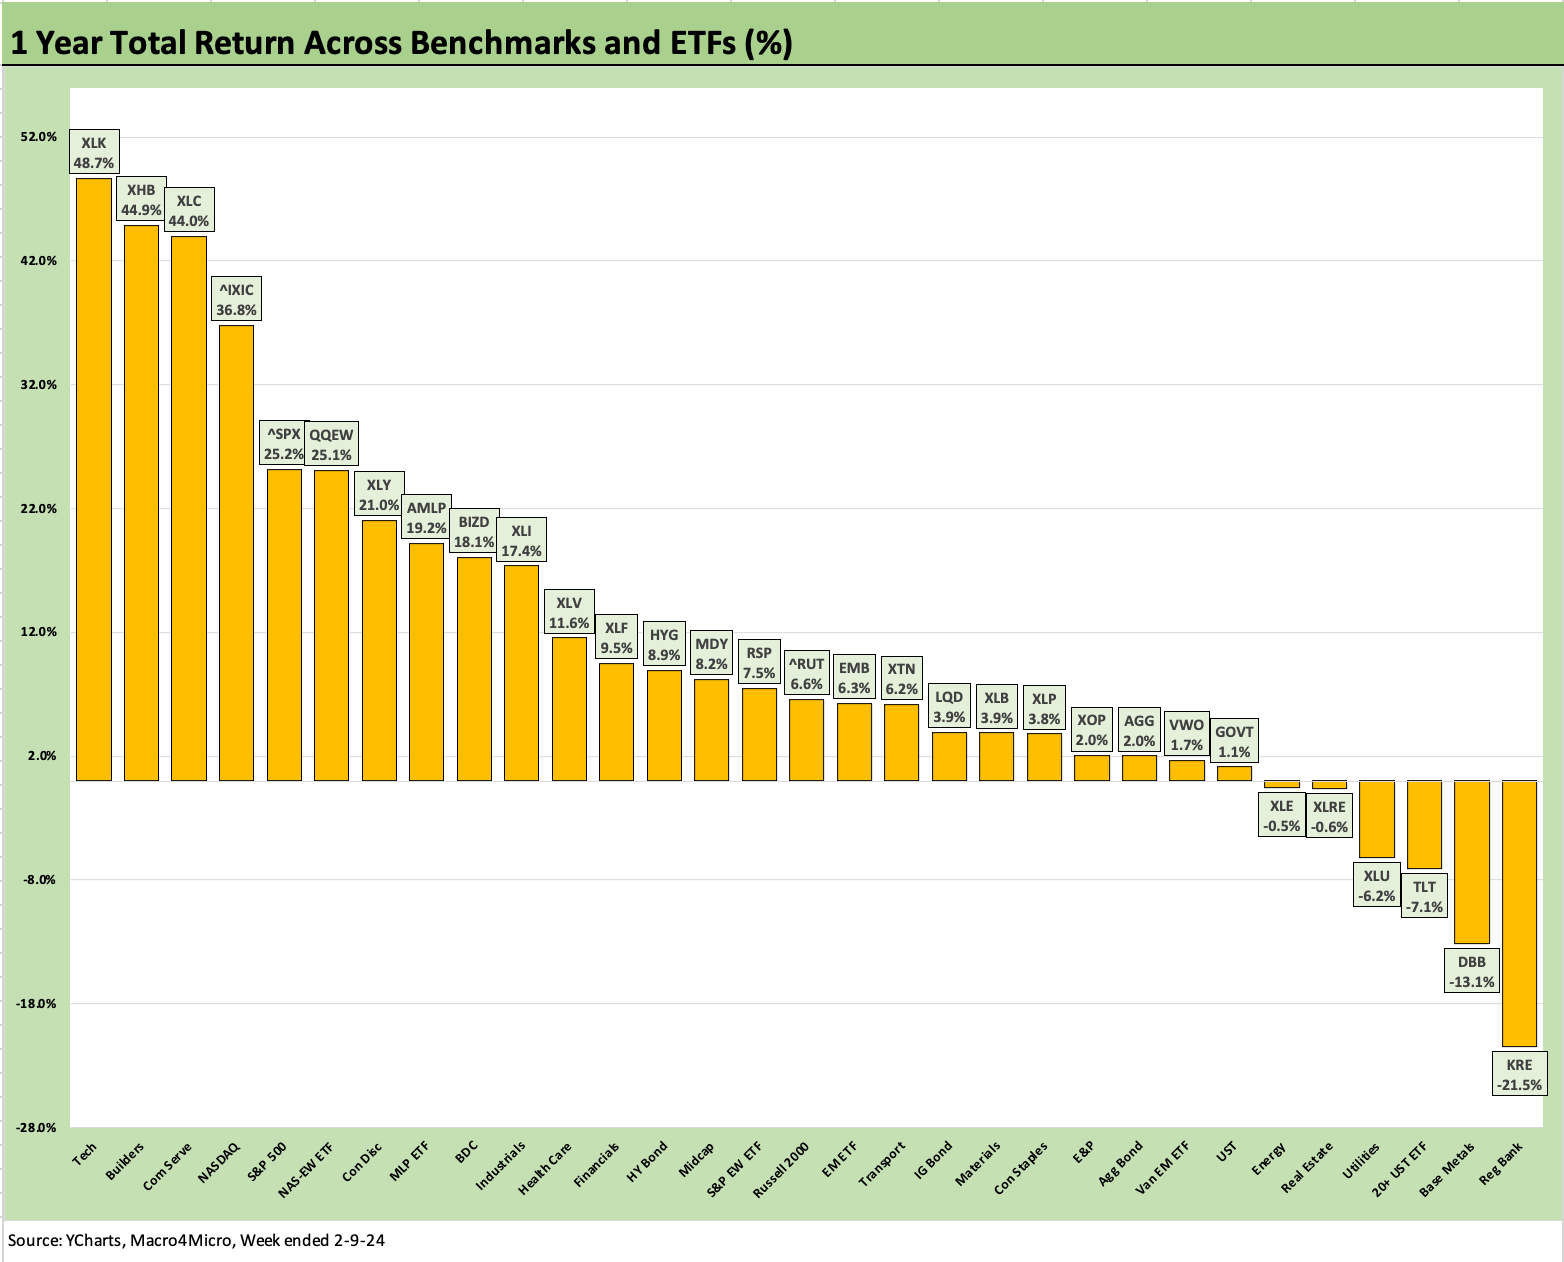
After such an impressive year 2023 turned out to be after so much of the year showing a lack of breadth in equities and considerable confusion around where the UST curve was heading. The scoresheet of 25-6 for the trailing year is good news but with the Regional Bank ETF (KRE) back in the ugly zone at -21.5%. The Base Metals ETF at -13.1% makes a strong statement about the low confidence in China while TLT is a volatile duration play. XLU and XLRE are still heavily about UST curve concerns and asset quality risk in some cases.
We covered the winner of the 1-year battle in the 2023 recap (see Footnotes & Flashbacks: Asset Returns 1-1-24 ), and that mix will take time to move around. We see 6 of the 8 in the top quartile from the Tech or Mag 7 mix with Builders (XHB) and Midstream Energy (AMLP) in the mix. The AMLP performance on the left is a reminder of the value of high dividends and lower volatility given the performance of XLE in the bottom quartile over on the right.
See also:
HY vs. IG Quality Spread Differentials and Comparative Returns 2-6-24
BBB vs. BB: Revisiting the Speculative Grade Divide Differentials 2-5-24
PCE Release Dec 2023: Consumption Strong, Inflation Favorable 1-26-24
Histories: Asset Returns from 2016 to 2023 1-21-24
Credit Performance: Excess Return Differentials in 2023 1-1-24
Return Quilts: Resilience from the Bottom Up 12-30-23
HY Refi Risks: The Maturity Challenge 12-20-23
Coupon Climb: Phasing into Reality 12-12-23
HY vs. IG Excess and Total Returns Across Cycles: The UST Kicker 12-11-23
HY Multicycle Spreads, Excess Returns, Total Returns 12-5-23