
Footnotes & Flashbacks: Asset Returns 3-3-24
Another good week for asset returns keeps a solid 6-week streak going with more breadth than the tech headline domination might imply.


The equity markets could boast breadth and depth in a strong performance this week with the NASDAQ and S&P 500 hitting all-time highs to end the week and the Dow off slightly, but small caps took weekly honors while Builders, E&P, Real Estate, and Midcaps joined some Mag 7 heavy ETFs in the top quartile.
With another UST curve rally on the week, after a mixed bucket of economic reports including PCE (inflation, income, and consumption), the 2nd estimate on 4Q23 GDP, durable goods and ISM manufacturing, we saw bond ETFs in positive range for the week (even if barely).
Our collection of 31 benchmarks and ETFs scored 23-8 on the week and is rolling along at 24-7 for the trailing month with the long duration UST 20+ Year ETF (TLT) sitting on the bottom and Builders (XHB) running at #1 in a striking divergence between two interest rate sensitive ETFs.
The 7 negatives for the trailing month include a bottom 4 comprised of bond ETFs joined by interest rate sensitive Utilities (XLU), Regional Banks (KRE), and Base Metals (DBB).

The above chart updates the debt and equity benchmarks we track with debt showing some wear and tear from the adverse yield curve moves in recent weeks and YTD while credit risk (notably HYG) has seen the benefits of spread compression over the past month.
Negative returns for UST and IG Corporate have not been running according to the UST consensus on duration risk to start the year, but there has been enough balance in the inflation indicators to keep growth equities on track and see the breadth of the equity rally support a wide range of industry groups. We cover those trends in the ETF and benchmark sections further below.

The 1500 and 3000 series update keeps the rally party going with both Growth and Industrials posting a great month and a very strong rolling 3 months. As usual, we line up the asset classes in descending order of 1-year returns, and that was a very strong year for Growth after a punishing 2022.
Of the subsector line-ups presented, the UST curve and asset quality concerns have kept Real Estate in check, but that mixed sector has fought its way back to upper single digits for 6 months and the trailing year. Energy has been all over the map but turned in a month only slightly below the trailing year.
The rolling return visual
In the next section we get into the details of the 31 ETF and benchmarks for trailing periods. The collection of four charts below stays consistent with recent Footnotes publications with the positive return side of the scoresheet continuing its streak.
The past week posted a strong performance at 23 positive and 8 in negative range across the 31. That is down from last week’s 29-2 favoring positive. That comes after the prior 4 weeks posted 16-15, 18-13, 21-10 and 26-5 for the remainder of the rolling 6 weeks. After some mixed weeks in January, the positive bias has been steady.

The above chart gives an easy visual for the shape of returns over various trailing time horizons across 1-week, 1-month, 3-months, and 1-year time horizons. The record highs for the NASDAQ and S&P 500 to close out the week made a statement on risk appetites and optimism even if it does not show up in voter polls.
The Dow, as one of the most quoted and cited by tradition but least representative of the economy (even with Amazon now joining the Dow), faded during the past week. We don’t expect Trump will be posting the above chart on Truth Social unless he flips it upside down.
We do not include the Dow in our group of 31, but we include benchmarks/ETFs to capture Midcaps and Small caps along with the S&P 500, NASDAQ, equal weighted S&P 500 (RSP), and equal weighted NASDAQ 100 (QQEW). We don’t monitor or watch (or even pay much attention to) Bitcoin, but that also hit a high in a sign of the mood in the market.
We even have seen the weekly and trailing month numbers show a lot more breadth after a tech heavy start. We look at those trends in the time horizon section below.
Record high total payroll numbers to date are likely to see a fresh round of the word “record” this week based on consensus numbers. We also have JOLTS this week. The consumer sector has undermined the super bulls on UST YTD, but the UST curve rally the past week did boost the six bond ETFs we track into positive range. We see 4 of the 6 we watch in the red zone the past month with High Yield (HYG) and EM Sovereign (EMB) still positive.
The Magnificent 7 heavy ETFs…
Some of the benchmark and industry ETFs we include face issuer concentration elements that leave them wagged by a few names. When looking across some of the bellwether industry/subsector ETFs in the rankings, it is good to keep in mind which narrow ETFs (vs. broad market benchmarks) get wagged more by the “Magnificent 7” including Consumer Discretionary (XLY) with Amazon and Tesla, Tech (XLK) with Microsoft, Apple, and NVIDIA, and Communications Services (XLC) with Alphabet and Meta.
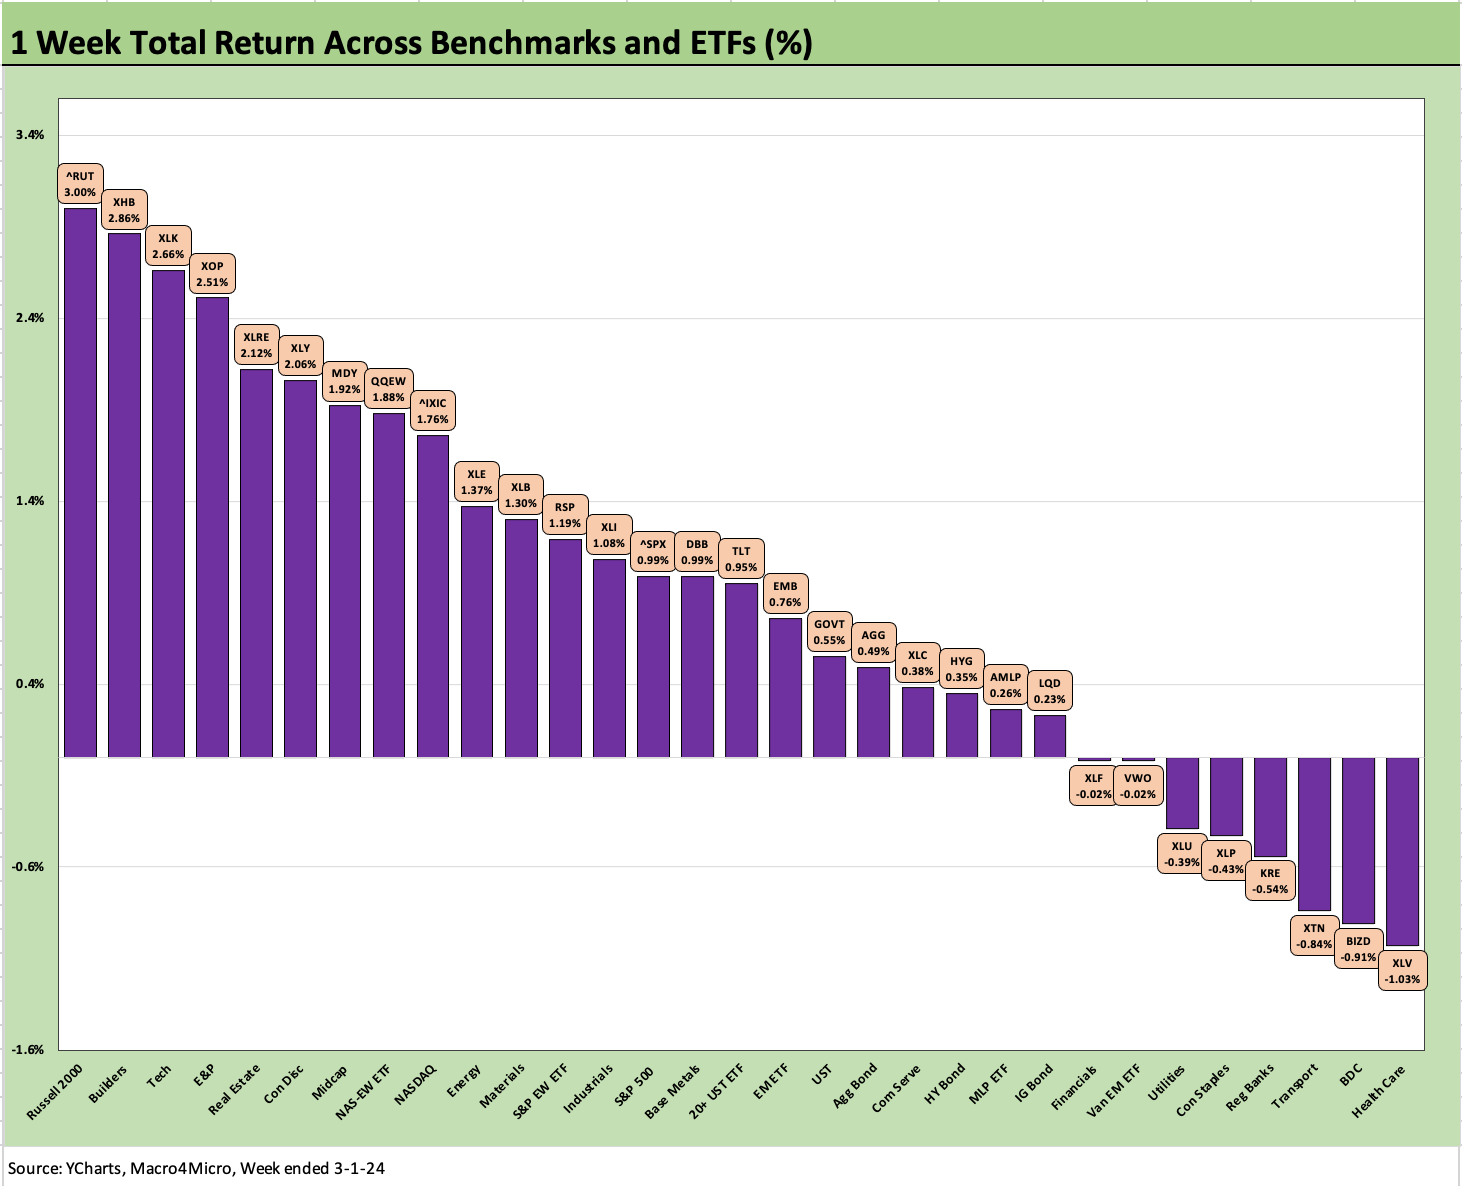
The above chart shows the 1-week weighing in at 23-8 with small caps at #1 and Builders #2. Both of those scored ahead of the Tech ETF (XLK) despite the new all-time highs on NASDAQ and another strong week for AI buzz. The NASDAQ hit its first high since late 2021, so that was the story of the week. We would note in the chart above that NASDAQ just missed the top quartile in our mix with the Tech ETF (XLK), the Russell 2000 (RUT), and Midcaps (MDY) ahead of it.
The always-volatile E&P ETF (XOP) weighed in at #4 behind RUT, XHB, and XLK with the often troubled Real Estate ETF (XLRE) having a good week in part on the back of rates. XLRE has been a 3rd quartile line item for most trailing periods in this bull market for equities including 1-month, 3-months, and 1-year. There is a lot more going on in Real Estate equities than leveraged office properties that capture the headlines as NYCB flares up. That said, interest rates do rule the roost for many REIT subsectors as dividend stocks and rates heavily influence the commercial real estate cycle.
Among notable bottom tier highlights this week, we see a modest mix of negatives with only the defensive Health Care ETF worse than the -1.0% line. The ETFs in the red include Utilities (XLU) and Staples (XLP) as frequent underperformers while Regional Banks (KRE) have been in and out of the doghouse with the NYCB headlines and stubborn short term rates undermining deposit costs as well.
We see the BDC ETF (BIZD) at 2nd from the bottom this week as BIZD running returns have weakened from its top quartile position to end full year 2023 numbers. BIZD is now at the upper end of the 2nd quartile for the trailing year with a rolling 3-month run in the 3rd quartile.
For the BDCs, the belief that floating rates are biased lower has to be balanced with the reality that portfolio quality held up in 4Q23 earnings reports. In addition, HY spreads are through the June 2014 lows and were closing in on the 2018 lows before this week’s 9 bps widening. The weight of important reported numbers and proxies for leveraged credit risk are not yet signaling material weakness. There are some concerns around loans as we covered last week (see Banks: Leveraged Loans, Classified, Special Mention Mix 2-28-24). Meanwhile, not a day goes by without a few articles in the financial media on private credit.
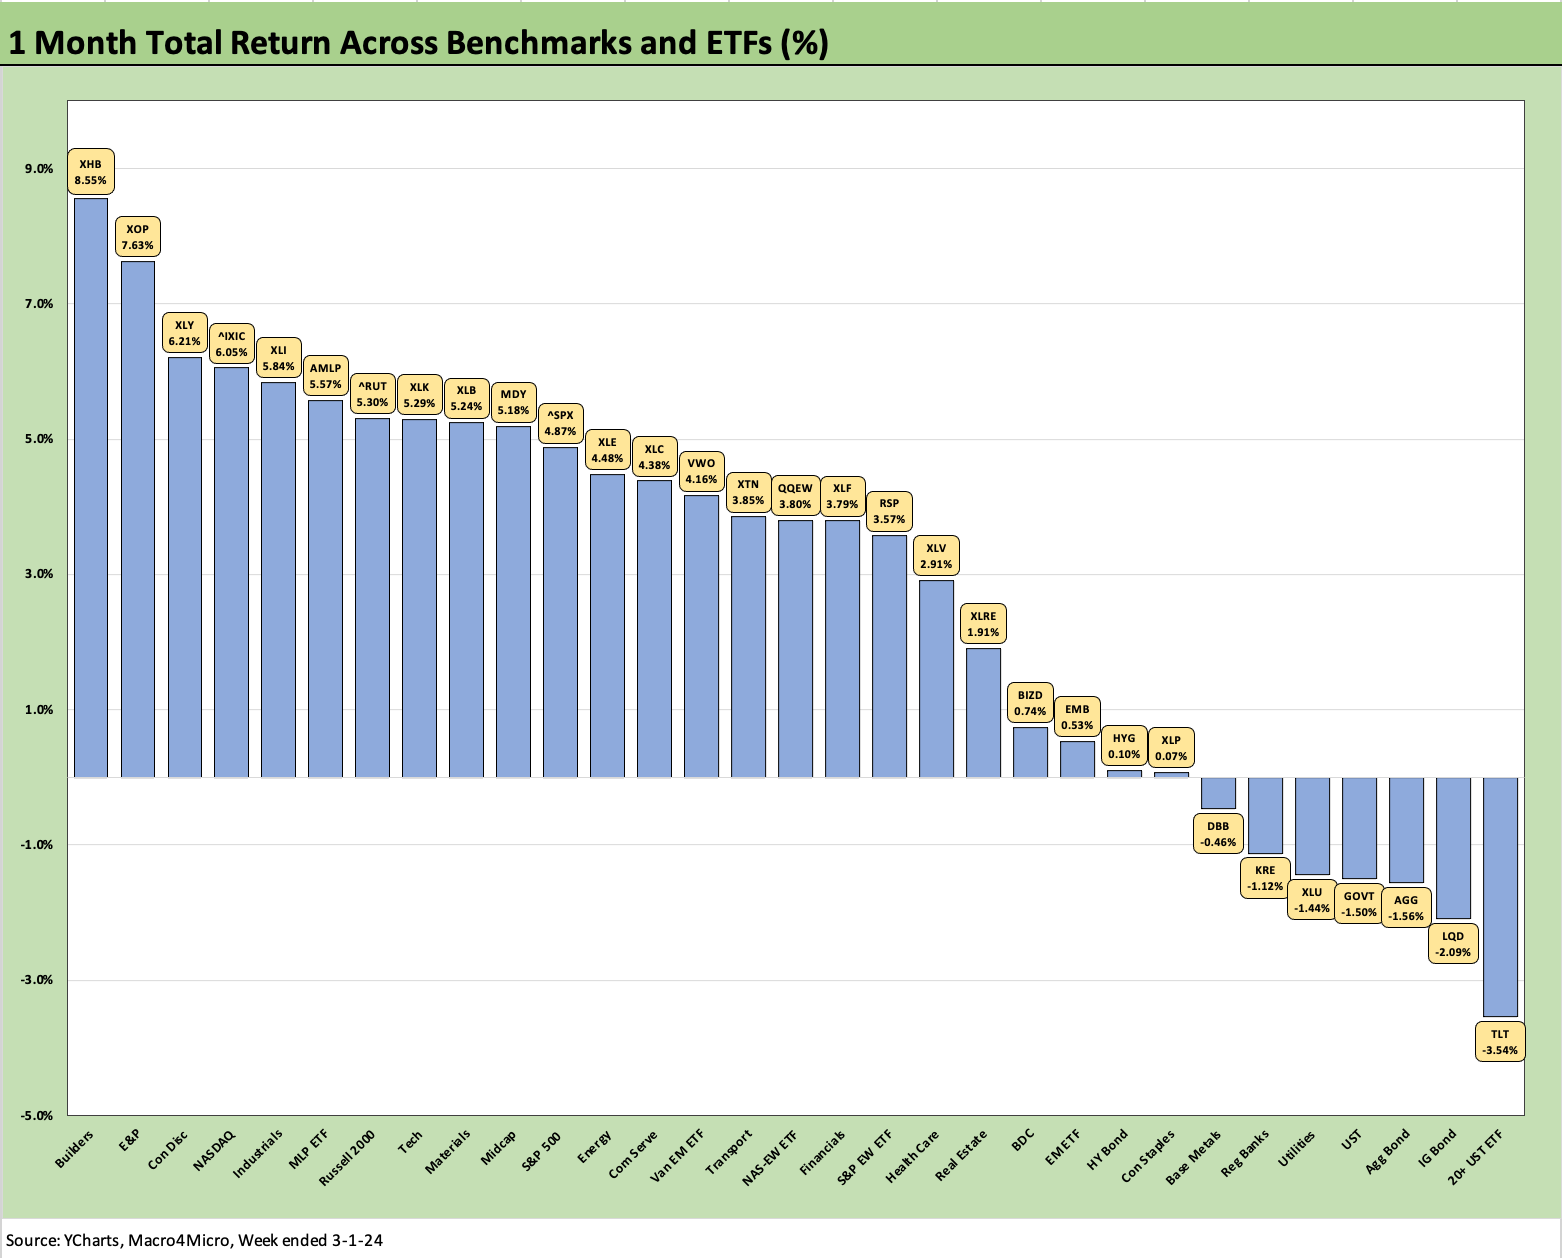
The score for the 1-month period is 24-7 and much like the weekly. The fact that Builders have been so resilient at #1 again is among the stories of the past year as the peak housing seasons of spring and summer are next up. This performance comes in the face of higher mortgage rates as we discuss in our separate Footnote publication on yields. The story line in recent housing sector releases have been constructive (see New Home Sales Jan 2024: Sales Steady, Prices Resilient but Softening 2-26-24).
E&P (XOP) has made a strong push this past month with WTI closing the week at just under $80 and a lot of consolidation chatter in the markets. The M&A risk symmetry to E&P equities can cut both ways whether the acquirer or the acquired. XOP is a bottom quartile resident for the trailing 3 months and 3rd quartile over 1 year. There are winners and losers based on production mix of oil vs. natural gas since natural gas has tanked into the sub-$2 range. The 1-month includes the high dividend Midstream ETF (AMLP) in the top quartile.
The UST curve has hit the bond ETFs for the past month with 4 of the line items in the negative zone being bond ETFs. HYG and EMB managed to barely edge into the positive zone. Utilities (XLU), Regional Banks (KRE), and Base Metals (DBB) rounded out the lineup of 7 negatives.

The 3-month running returns came in 29-2 with this time horizon still being a steady positive profile in returns. The returns still include the banner Dec 2023 performance that rewarded “everything” across duration and fundamental risk and both debt and equity (see Footnotes & Flashbacks: Asset Returns 1-1-24 ). Dec 2023 saw an especially strong performance by the long duration 20+ year UST ETF (TLT).
In the bond ETF collection, HYG carried the rolling 3 month returns on the back of spread compression and less exposure to the duration setbacks of the YTD period that we detail over in our separate State of Yields Footnotes publication (we will post later today).
The Builders (XHB) stand out in the 3-month returns and were reinforced by some bullish earnings reports such as Toll Brothers. After XHB, however, the Mag 7 heavy and Tech story takes the lead again over 3 months with more than half the top quartile comprised of Communications Services (XLC) at #2, NASDAQ (IXIC) at #3, Tech (XLK) at #4, NAS 100 Equal Weight (QQEW) at #6, and the S&P 500 at #7. The S&P 500 Equal Weight ETF (RSP) was down at #12 around 3 total return points behind the market cap weighed S&P 500 (RSP).

The 1-year running returns weigh in with an updated score at 27-4 with the Builders (XHB) at +57.4% edging out Tech (XLK) at +56.9%. The Hi-Lo range for #1 vs. #31 was just under 77 total return points framing XHB vs. Regional Banks (KRE). If we throw out the Hi-Lo lines and tap the next in line, then the differential is still over 67 total return points when comparing #2 XLK to #30 DBB. Sound fundamentals carried the day for builders while growth stocks were still big winners even with the UST curve and fed funds stubbornly high into 2024.
The Mag 7 and Tech-heavy line items carried 6 of 8 in our top quartile for 1 year. The bookends for the top quartile were the Builders (XHB) and Midstream Energy (AMLP). As breadth goes over the LTM period, at least the Midcaps and Small Caps made it into the 2nd quartile and the same for the Equal Weighted S&P 500 ETF (RSP) as did Industrials (XLI), BDCs (BIZD), Financials (XLF) and Health Care (XLV). That is a broad mix, but it was a rare industry that could crack the Tech and Mag 7 lineup during the post-2022 tech rally and AI mania underway.
See also:
Banks: Leveraged Loans, Classified, Special Mention Mix 2-28-24
BB vs. CCC: Quality Spread Differentials, Yield Relationships, Relative Returns 2-20-24
HY vs. IG Quality Spread Differentials and Comparative Returns 2-6-24
BBB vs. BB: Revisiting the Speculative Grade Divide Differentials 2-5-24
Histories: Asset Returns from 2016 to 2023 1-21-24
Credit Performance: Excess Return Differentials in 2023 1-1-24
Footnotes & Flashbacks: Asset Returns 1-1-24
Footnotes & Flashbacks: State of Yields 1-1-24
Return Quilts: Resilience from the Bottom Up 12-30-23
HY Refi Risks: The Maturity Challenge 12-20-23
Coupon Climb: Phasing into Reality 12-12-23
HY vs. IG Excess and Total Returns Across Cycles: The UST Kicker 12-11-23
HY Multicycle Spreads, Excess Returns, Total Returns 12-5-23