
United Rentals: Finetuning Strong Run Rates on Equipment Demand
With all the 1Q24 GDP chatter on economic trends last week, URI offers a bellwether’s ringside view of nonresidential and industrial markets.


United Rentals (URI) reported 1Q24 results and gave guidance showing sustained strength in earnings and cash flow as the stock market responded with a 5.5% pop on earnings day on top of a very impressive run over the last year.
The expanse of exposure across so many verticals makes URI a very good cyclical bellwether, and the market dynamics are still showing support for many (not all) cyclicals in 2024 despite the stubbornly high rates.
From a credit risk standpoint, we still view URI as an investment grade caliber risk based on absolute run rates of cash flow, low leverage, intrinsic financial flexibility of capex and used equipment sales to properly size the portfolio, and most importantly a strong track record across some wild cycles since the late 1990s when it first burst onto the scene.
URI boasted that their 10Y bond deal in the quarter to fund the Yak acquisition was the lowest spread for any bond of any tenor in their history, so the credit side of the story justifiably remains in market favor.

United Rentals reported 1Q24 earnings and held an investor call to wrap up last week, and the call added to color that fills in some sea level topics after the 1Q24 GDP report showed solid fixed investment numbers (see 1Q24 GDP: Too Much Drama 4-25-24, 1Q24 GDP: Looking into the Investment Layers 4-25-24) +2.5%).
The top-down angles on equipment and industrial activity from GDP this past week were quite constructive, but we saw a drag on headline GDP at +1.6% after a -1.2% negative hit from trade flows and private inventory deltas. Some key investment line items were positive with fixed investment north of +5% and Equipment above +2%.
The stock chart above underscores the market is feeling good about URI’s core fundamental prospects and shareholder enhancement consistency. URI popped by +5.5% on earnings day. The chart compares URI to two ETFs including the Industrial ETF (XLI) and Materials ETF (XLB) for a cyclical comparison. Clearly URI is getting a bullish vote from the market for more reasons than just the cycle.
The challenge to URI from here is sustaining growth metrics when markets such as construction face tougher comps after the 2023 construction boom. The URI model is about gaining share in business lines and product segments where it has acquired revenues as well as riding the secular trends that show leasing growing faster than equipment demand.
We have covered the greater use of leasing in earlier commentaries. The list favoring leasing includes the capital and financing costs of ownership, operational flexibility for the user, limited time horizon use of some equipment categories, and the rise of complex connected equipment and personnel demands, and the cost to service the equipment, etc.
URI by the numbers…
The fact that URI is a massive bond issuer in its own right makes it a good name to follow, but we also look to United Rentals each quarter for its importance as a key supplier to nonresidential construction, industrial markets, and such narrow verticals as Power and Energy.
The URI presentation breaks out a detailed list of such verticals. That is a big chunk of the US economy in those customer markets across many regions. URI is as close to customer activity as you can get with its #1 North American market share, over 1500 North American branch locations, and 1600 global branches (including 983 GenRent and 617 Specialty).
URI’s guidance and color benefits from their daily planning, pricing strategies, inventory management, and service activity. URI benefits from short lead times on ordering and selling equipment, so they can change their plans quickly. Every quarter brings useful inputs with their revenue line and capex decisions as useful proxies. The 1Q24 review did not raise flags, but the stock has really run and there are still questions on the impact of rates on the pace of investment.

The above chart highlights the steady growth of revenues and EBITDA off the COVID lows as organic growth from reinvestment and acquisition-driven expansion flow into URI numbers. The Equipment Rentals line is the focal point. Revenues are growing and margins have been slightly squeezed at the gross profit line and EBITDA margin level.
While the high EBITDA margins are on the lower end of a narrow range vs. history, they are still very strong margins when put in industrial sector context. The high EBITDA margins still need the context of consistent investment and the reality that a high rate of capex is required for the replacement of equipment to sustain earnings. Replacement capex and growth capex are both needed to drive shareholder value.
Guidance remains positive for 2024 with a $14.95 bn to $15.45 bn revenue range, which translates into over +6% growth at the midpoint. Yak is expected to contribute $300 mn in revenue and $140 mn of EBITDA in 2024, so Yak is small in the context of the total revenue line. The Yak deal is consistent with the history of vertical expansion and URI’s very successful history of bolt-on deals and new product strategies that support its customer retention and growth. It is the latest of many.

The above chart updates the segment breakout across General and Specialty with the higher growth specialty operations continuing to climb. Specialty is the higher margin growth unit where URI continues to expand organically and via acquisition.
With its extensive branch system and customer base and role in so many larger scale projects, expansion into new product segments feed into a virtuous cycle where URI can acquire a company (such as Yak) and then drive organic growth. The Yak example calls for URI to double the size of the operation in the next 5 years. It is an acquisition system that has worked for years. Acquisition-driven growth becomes organic growth after such deals.
URI also emphasizes how the lower growth business lines with lower price equipment can deliver very high returns as they end up in a package of services on many long-term projects. Such equipment types can be leveraged by URI and generate high utilization levels even for “low margin” equipment categories. It is about the returns and not the lower margins in such cases.
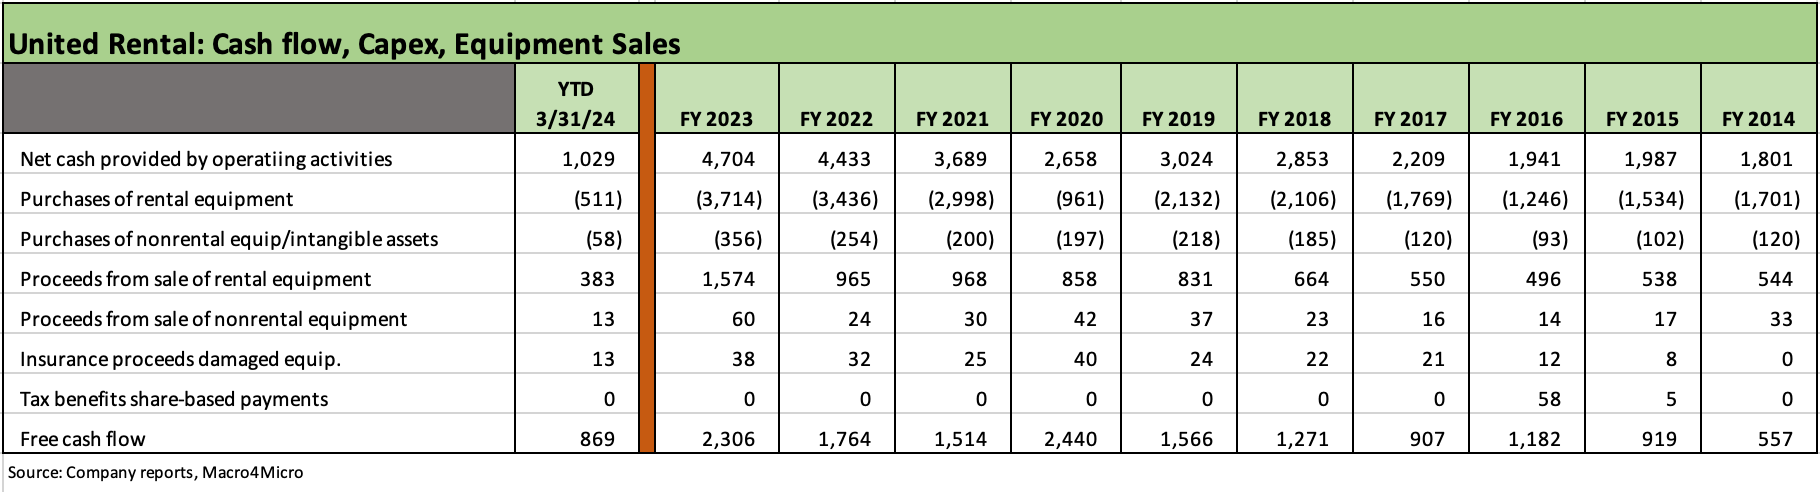
The above chart is one we lift from the quarterly URI slide pack. This table is about the free cash flow and moving parts of the equipment lines. M&A and shareholder rewards are separate (see cash flow chart further below).
The history above tells a detailed story of the moving parts of the equipment lines (purchases and sales, net capex, etc.) that translates into the growth in size and evolving mix of the earning asset base (equipment). When COVID hit and the supplier chains melted down, URI was well positioned with its extensive equipment inventory to be a reliable supplier and service provider and to take the opportunity to sell used equipment into a strong market to refresh its fleet.
The table shows high purchases and high sales into 2022-2023 and especially as construction rebounded (see links at bottom). URI has been the leading supplier to “national accounts” long before the mega-projects of recent years, so they can bid on equipment types on a large scale with a high level of confidence.

The above chart updates the high-level view of the balance sheet with leverage at 1.7x even after a billion-dollar acquisition. A billion-dollar cash deal has become routine in the life of URI. In addition to the equipment asset value as a source of comfort for lenders, bond market access is not a question from secured to unsecured. Execution and how much demand they can attract from traditional BBB tier buyers is the main swing factor in unsecured bond demand and pricing.
The ability to use ABL lines or issue bonds with ease has supported the equity story as well since the M&A also feeds into the organic growth story. Current ABL borrowing capacity is $2.85 billion at 1Q24.
We have covered the dynamics of the M&A and shareholder policies of URI in prior commentaries. The ability to generate revenue growth from a combination of favorable secular trends, M&A, and organic growth has attracted a lot of attention in recent years as evident in URI’s $46 bn market cap (URI was added to the S&P 500 back in late 2014).

The above chart details a few important cash flow lines. The earlier table covered URIs details on its free cash flow and capex lines and focused more on operations. The above updates the running M&A, buybacks, and dividends but we also drop in the equipment purchases and sales as well.
M&A has become a routine strategic fact of life. In the meantime, deal integration risk has faded as a risk factor after URI executed on so many including much larger deals when URI was a smaller entity in the years and cycles after its 1997 beginning. Those were very eventful periods they navigated including a credit crisis and a pandemic. Those are some “real world stress tests.” URI came out on the other side bigger and stronger than ever.
As noted in the table, FY 2023 brought URI into the ranks of dividend payers. The $406 million of dividends and $1 bn in buybacks with balance sheet leverage in the low end of the target range and URI generating record net income rounds out to a positive story line.
See also:
United Rentals:
United Rentals: In the Market, Right on Cue 3-7-24
United Rentals: Another Billion Out of the Gate 3-4-24
United Rentals: Another Bellwether Supporting the Macro Health Story 1-31-24
Rental Equipment: A Cyclical Confidence Booster 9-15-23
Credit Crib Notes: United Rentals (URI) 9-12-23
Ashtead 4Q23/FY 2023 - Company Comment 6-14-23
United Rentals: Investor Day Backs Up Bulls 6-11-23
United Rentals 1Q23: Company Comment 4-29-23
United Rentals: Nonresidential Construction Proxy 1-27-23
Macro View:
1Q24 GDP: Looking into the Investment Layers 4-25-24
1Q24 GDP: Too Much Drama 4-25-24
4Q23 GDP: Final Cut, Moving Parts 3-28-24
GDP and Fixed Investment: Into the Weeds 1-25-24
Construction Spending: Timing is Everything 12-1-23
Construction: Project Economics Drive Nonresidential 10-2-23