
United Rentals-Investor Day Backs Up Bulls
We review the very strong credit and fundamental story that came out of United Rental Investor Day.

We run through some of the macro tailwinds cited by United Rentals as well as the micro level positives that make URI an investment grade equivalent risk at the unsecured level despite the layers and conventions of the credit rating tiers that keep URI unsecured in the BB tier.
The color commentary and extensive detail from Investor Day offers infill on a very convincing case on URI’s positive business fundamentals at a time of cyclical debate in the market.
The combination of record EBITDA, record operating cash flow, and record free cash flow in FY 2022 with 1.9x leverage (1Q23) on the way to 1.6x by year end 2023 makes for a good story line as URI lobbies for better valuation treatment in the equity market vs. the S&P 500.

When major issuers conduct a full-blown Investor Day, it offers a chance to step back and hear about the state of the issuer and related industry trends. Such events are especially important for industries that are somewhat more “off the run” with distinctive operating characteristics. United Rentals and the equipment rental industry fit that description.
In its recent Investor Day, URI offered some macro transparency that reinforces the generally positive view of the name in the market. URI shed more light on the major initiatives in the current market (infrastructure, climate, semis, EVs, LNG) and how those translate into demand at sea level.
The above bar chart certainly makes a case of how well URI has done over the past decade on the way to record numbers in its recent FY 2022. The EBITDA guidance for FY 2023 is for another record. FCF will post a material increase to over $2.2 bn even with a major increase in capex. A high rate of equipment rental purchases on top of the latest multi-billion-dollar M&A deal reflects the optimism that URI is seeing at the branch and customer level in its core sector verticals. URI’s color goes in the “worry about Fed hikes” column on fundamentals.
The 2020 FCF peak in the chart above comes with an asterisk of a plunge in rental equipment purchases during the pandemic year. Equipment rental purchases were only modestly ahead of used equipment sales by $103 million. That is the financial flexibility profile in a snapshot, but such defensive moves have been seen before in market crises. The cash flow generation and intrinsic flexibility to reshape the size and mix of the fleet “portfolio” is rare for what is an essence an asset-rich industrial, and a company heavier in variable costs than fixed costs.
2023 guidance affirmed on Investor Day…
The bottom line is that FY 2023 will feature high organic growth through high gross and net rental equipment purchases comparable to 2022. That heavy capex comes on the heels of the $2 bn cash acquisition of Ahern (closed Dec 2022). Investor Day offered some important insights into the mega-projects that are really providing important additions to spending that are somewhat independent of the usual cyclical question marks. We look at some of those below.
Since URI is heavily plugged into so many end markets in industrial and nonresidential construction, the presentation offered a good microcosmic view of cyclical conditions in the industrial and nonresidential construction cycle. The fundamental story line of URI will see some additional industry inputs from Ashtead’s results this week as the strong #2 player in the sector reports results for FY 2023 (April 30 fiscal). With its 13% North American market share, Ashtead goes head-to-head with industry leader URI, who holds 17%.
URI as an important bellwether name in the debt and equity markets…
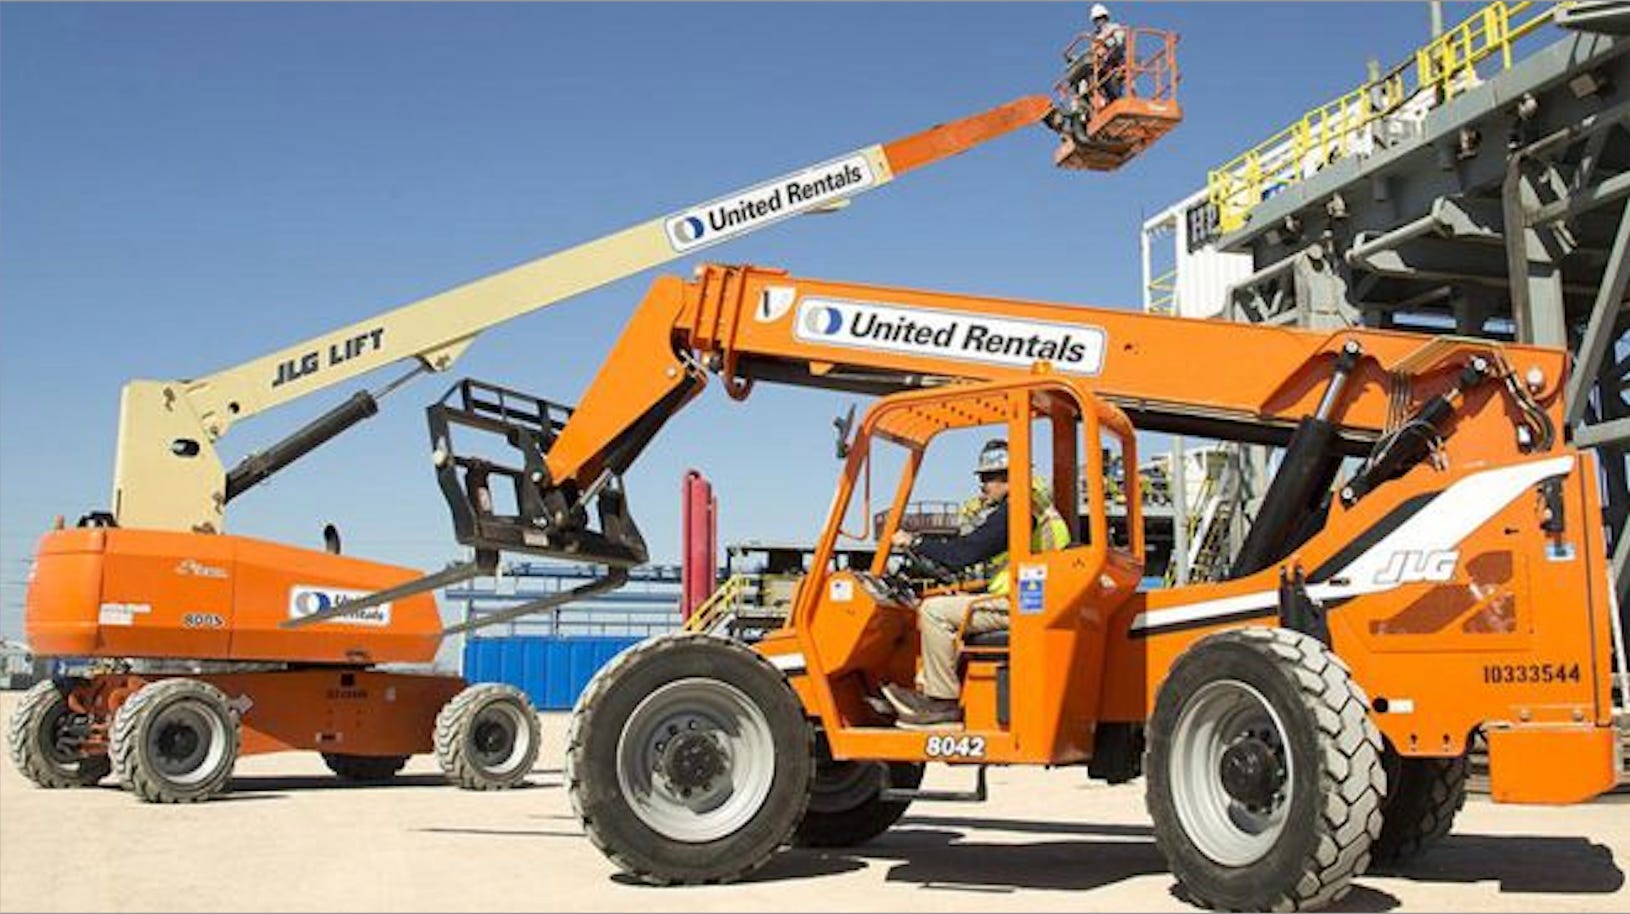
As we covered in our 1Q23 comments (see Signals & Soundbites: United Rentals 1Q23 4-29-23), URI has a market position and scale that offers investors the ability to get a macro read on numerous critical multiplier effect markets in industrial and nonresidential construction. With around 1500 locations across North America, that covers a lot of industries in its customer base. That includes Energy (notably midstream and LNG) and Autos (EV assembly plants, batteries, etc.) as industry groups are seeing so much action in climate initiatives. The macro trends of reshoring and bringing more chip production back to the US is part of the tailwind theme for equipment rentals. It is more than a theory and is flowing into the numbers now.
We have been a fan of the credit fundamentals of URI for years, and we had a chance to watch it from a research management standpoint when it broke onto the scene in the late 1990s after its IPO as an entrepreneurial roll-up. The company freely used HY debt to grow its business, and the main scare along the way was an “almost-LBO” in 2007 before the plug was pulled by Cerberus as the credit crisis backdrop emerged. URI then blasted through into the next two cycles riding the secular growth prospects of equipment rental as an industry group.
Credit quality can improve on a discretionary basis…
There is every reason to overweight URI in both debt and equity markets given its core operating and financial strengths. URI now straddles the IG/HY index lines in the bond market with its secured and unsecured bonds. While credit metrics still make a good case for higher credit ratings, the layers impair the optics more than the substance. Now that URI has a few record cycles under its belt, investors have an easier time seeing how it can grow.
As a much smaller operation, URI demonstrated its resilience in the face of the TMT crash (that came with related capex setbacks in some bellwether sectors such as power and telecom). URI kept growing after the financial systemic crisis (including CMBS pain that impacted key end markets and hobbled real estate lenders). ZIRP and QE helped get expansion and investment back on track as URI kept on making major acquisitions that we covered in prior lives. They just kept growing their fleet and successfully integrating bolt-on deals. Eventually, a billion dollar buy seemed small. We always thought the rating agencies unduly haircut the credit ratings with low leverage expectations relative to so many high fixed cost cyclical manufacturers. The M&A track record of cash/debt acquisitions at some point should be an assumed event that is easily navigated.
After the longest US expansion in history, URI then pushed through a crippling pandemic even when many end markets had to pause. Most construction projects were deemed as essential services and continued, and that was a major factor in 2020 mitigating downside. When post-pandemic supplier chains were melting down, after the pandemic, guess who had the equipment?
Gut checking leverage…
That history shows a lot of real-world stress testing, and URI is now stronger and more diverse than ever. The main headwind on credit ratings might be the balance of shareholder and bondholder interests and how the agencies want to view the billion-dollar buybacks. URI generates extraordinary levels of free cash flow, and that is what makes them both a safe credit and a solid equity. The combination of credit metrics does not make URI a speculative grade name in our view whether a 2-handle on leverage or the 1.6x expected by year end. The use of secured bonds in the IG index has broadened the investor base. URI is an ideal unsecured bond for IG funds with some BB tier flex.
In portfolio context, if an investor is worried about the capital goods sector with all of its high fixed costs and ugly earnings symmetry in hard landing scenarios, the BB unsecured URI bond presents less risk than a manufacturer. Interestingly, the street equity research coverage is typically a capital goods analyst. That is also why we include a cap goods bellwether in the equity comp chart along with the handful of other major equipment leasing companies (Ashtead, H&E Equipment Services, Herc Holdings).
Some equity comps tell a clear story even at a discount to the S&P 500…

The above chart highlights how well United Rentals has done in the context of the S&P 500 (URI is an SPX constituent. Joined in Sept 2014). That chart also shows Ashtead running alongside given the similar operating fundamentals and impressive growth trajectory. While both are active in acquisitions, URI has been the busiest consolidator in the industry with Ashtead more rooted in capex and organic growth. The case for the secular growth in leasing has been made by the equipment leasing companies for years, and URI has grown at 3x the rate of the industry by combining M&A with high investment in fleet.
The equipment rental business has gone more mainstream as a sector over the years with much better investor awareness of the secular trends and opportunities as rental grows as a core part of corporate finance planning by users of such a wide range of equipment. Whether it is the economics of equipment usage, financial costs, or the efficiency of staffing and servicing demands (more complex and digital-intensive equipment and diagnostic needs, etc.), leasing is a winning sector outpacing economic growth. That has not changed over the past few cycles as underscored by the growth of both United Rentals and Ashtead.
The lower tier of the Top 10 equipment rental names kept disappearing into other companies via M&A. Then some Top 5 names started disappearing. The reality is that either URI or Ashtead could buy HEES ($1.5 bn in market cap) without missing a beat while Herc ($3.4 bn in market cap) has a different mix and would be a bigger bite. In proportion to the balance sheet of URI and its cash flow, HRI would not be even close to its biggest deal. In other words, we do not worry about the event risk side of the equation. In the event of a major deal, a temporary detour from buybacks and a trimmed relative capex program would quickly offset the financial risk. The usual challenge would be operational integration risks and margin protection.
The easiest part of the URI story has always been the financial health attributes with its high margins, strong free cash flow, and inherent flexibility to make rapid adjustments to capex planning or fleet size. That is the usual story, and the multiyear charts included in this piece on EBITDA, free cash flow, cash from operations and capex underscores URI’s financial strength. URI covered a lot of other material in the presentation. We summarize some critical points below.
HIGHLIGHTS FROM INVESTOR DAY
Investor day sees URI making its case on valuation to the equity markets: URI gave a lot of attention to the equity markets as it framed a range of metrics vs. the S&P 500. They were highlighting where URI stood vs. S&P 500 quartiles across a wide range of broadly accepted metrics. The two cuts of the comparison were from 2013 to 2022 and for the most recently completed 2022 fiscal year. They were making a good case that “long term or short term, our metrics stand out.” The metrics include CAGR for revenue and EPS growth, profit margins, free cash flow margins, returns (ROIC), and cash conversion (free cash flow % net income). Those pages are very busy and worth a look for anyone that owns or is interested in URI.
URI makes a very convincing case for investors to revalue the company from a multiple standpoint. The URI metrics show a healthy mix of high quartile and even top decile performance. The fight for a revaluation of its multiple from a 5-handle on EV/EBITDA could change the view on what 2.0x leverage means in the context of asset value coverage. This is a small group and multiple expansion via marketing is an uphill battle.
The company’s track record of financial performance offers evidence of resilience across some 100-year floods over the last two decades. Seeing such a major discount to market valuations is not too logical. The events of the last two decades crushed more than a few higher multiple issuers and overhauled a few industries. So mid-single digit EV/EBITDA multiples does not make a great deal of intuitive sense in market portfolio context across cycles. The same relative value comp of low/mid-teens on NTM P/E ratios saw URI making the case for materially better treatment relative to the 20x area seen around the bottom of the second quartile of the S&P 500.
The stock has done well, but in relative multiple context, URI is the Rodney Dangerfield of the cash flow machines. No respect.
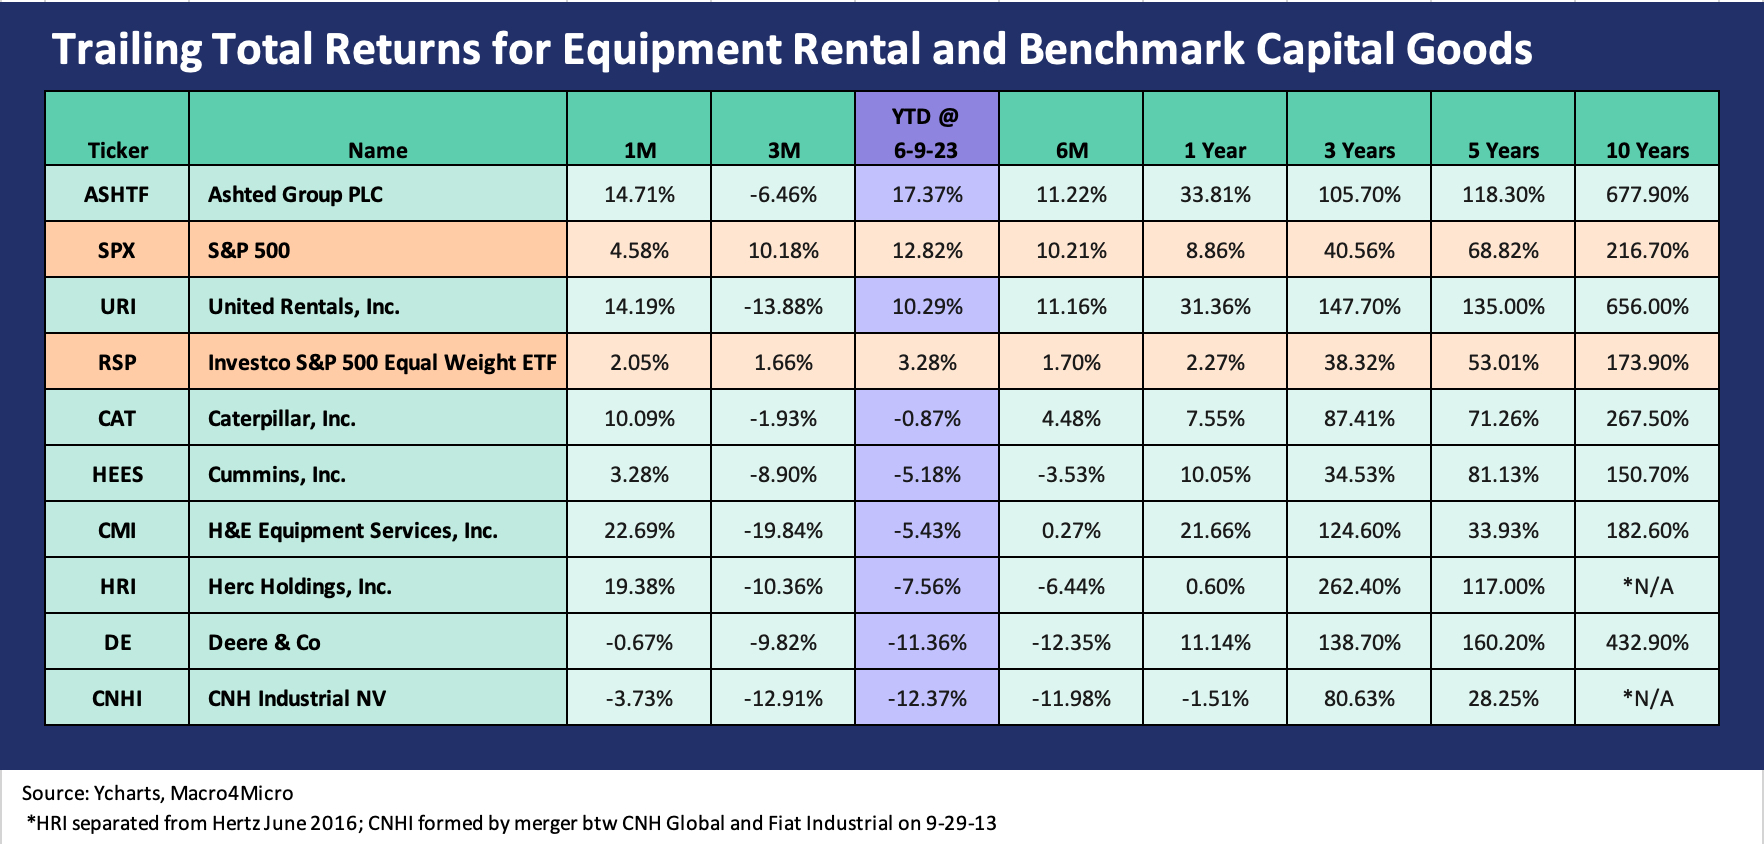
URI equity market performance held up very well across time: As detailed in the stock return table above, URI equity returns have held in well in the face of the rising rates and inflation. We line up the companies and benchmarks in descending order of total return YTD with Ashtead and United Rentals holding down the #1 and #3 spot and the S&P 500 at #2. It is worth notating that URI and Ashtead both materially outperformed equal weighted benchmarks (not shown) as the “Magnificent 7” names drove the overall S&P 500 performance (see Reversal, Takedown, or Escape? Market Weighted vs. Equal Weighted 6-6-23)
If we look back across more trailing time horizons, the URI and Ashtead numbers hold up very well. We see some solid results at HEES and HRI also although HRI has a complicated story with its legacy neglect in the Hertz family tree and a different product and end market profile than URI and Ashtead. The 10-year trailing horizon makes a statement when you frame URI and Ashtead vs. bellwethers such as CAT, DE, and CMI.
Fundamental color for industrial and nonresidential markets is solid: As we covered in a recent construction update (see Construction Spending: Demystifying Nonresidential Mix 5-9-23), the volumes in myriad markets in industrial construction and various subsectors look quite strong year over year. That is a separate and distinct issue from some of the legacy exposures the banks and CMBS holders might need to worry about such as offices and some retail subsectors.
The demand side of the equation for URI has been quite strong as the combination of growth in Specialty Equipment as well as steady demand from both manufacturing markets and nonresidential markets fueled growth. We see a mix of trends from secular growth tied to climate initiatives to supplier chain reshoring to legislative support for rebuilding US semiconductor capacity.
Specialty Solutions are up to almost 30% of revenues in 2022 from 7% in 2012. The broad categories include such areas as Power & HVAC, Climate Solutions, Fluid Solutions and Mobile Storage among others. URI was quick to point out that is it not just about margin in analysis of the asset base since some low margin segments can bring high ROIC value to the bigger valuation story line. Similarly national accounts and high concentration contracts can be leveraged for better returns in multiyear projects. URI “covered a lot of real estate” in Q&A. The CAGR of 28% in Specialty over the past 10 years was a notable number they cited.
Some discussions around the energy sector were useful. Energy is always a moving target around oil and gas prices, but the much-expanded climate initiatives have added some secular twists and government initiatives that have kept the wheels turning. The same is true in EV-related outlays from batteries to new parts and assembly plant investments. Some of these topics can be found in URI’s investor day presentation (chart collection). The infrastructure bill and IRA were among key tailwinds cited.

The free cash flow and discretionary capex programs anchors the credit risk profile: URI posted record net cash provided by operating activities in 2022 and is guiding modestly higher levels in 2023. Gross equipment capex at the midpoint is guided slightly lower. The lead time with OEMs offer ample opportunity to flex up or down. The inherent financial flexibility of URI took some time to get driven home to the market over the years, and the liquidity strengths and ability to rapidly fine tune “net capex” (purchases vs. sales of used equipment) has always been a source of comfort in the financial risk picture. That is not “in theory” but in practice and in history. A systemic credit crisis and hard landing in 2008-2009 and a pandemic offered real world stress tests. The same back in the TMT bubble bursting and various upstream energy capex meltdowns such as 4Q14 to 1Q16.
M&A is a matter of opportunity and price and more seems inevitable in light of history: Both sides of the balance sheet have grown through sustained high capex and sustained M&A across time. United Rentals is the dominant consolidator in this still-fragmented industry, and the track record is clear enough in its numbers. The roll-up of the companies below the Top 3 players has reinforced where the industry is still headed with Ahern the latest major to get folded into URI.
Leverage metrics are very solid and heading lower by year end: The 2022 year-end 2.0x ticked down to 1.9x at 1Q23 and is heading toward 1.6x by the end of FY 2023. The room for more M&A is supported both by a projected operating cash flow midpoint of $4.6 bn and free cash flow of $2.23 bn (midpoint of range). Fixed rate debt is 68% of total with no bond maturities until 2027. The company has a complicated capital structure with multiple layers across ABL, credit agreements, 1L, 2L, and unsecured.
Capital allocation still shows a healthy historical balance: The newly instituted dividend (~$416 mn run rate at 1Q23 before projected buyback impacts) broadens the equity investor base. The share buyback program is estimated at $1.0 bn for 2023. Since 2012, URI has repurchased 40% of its share count, and URI framed the cost at $5 bn spent for shares now worth $16 bn. As buyback statistics go, that metric sets a bar for others to follow to make their case on the success (or lack of) in buyback programs. It really has little to do with today’s challenge or tomorrow’s activity other than to make it clear that their overall performance has been optimally balanced across investment and shareholder rewards. After all, they have posted impressive growth and are calling for 1.6x leverage by year end. That sets them apart from many companies.
The role of mega-projects: When pressed on cyclical scenarios, the challenges in calling the risk of contraction brought some discussion of past downturns. The theme was that URI could still push through a recession just on the impact of the various major initiatives underway. The major mega buckets are bringing tailwinds across the Infrastructure Bill ($500+ bn over 5 years), Electric Vehicle investment ($300 bn 5-10 years), Semiconductor manufacturing spend ($200 bn 5-10 years), the expansion of North American LNG ($100 bn 5-10 years), and the Inflation Reduction Act ($1+ trillion over 10-20 years). Note: those numbers were from a URI slide. Regardless of how anyone feels about legislation and politics, the equipment leasing companies benefit.
URI offered some perspective on how major project managers prefer to be more efficient with fewer vendors where possible. Such contracts can offer major advantages to URI through multiyear deals. That supports efficient equipment utilization and lowers capex risks. The scale of the initiatives noted above play out over various long-term timelines, but they are underway and having multiplier effects on jobs and the economy. It was useful to hear granular discussions from a line operator on the value of these programs without political noise playing around it. The discussion could go under the category of cyclical risk mitigation.
Green initiatives bring opportunity: The pervasive climate focus flows into fleet selection and thus usage by customers with sustainability initiatives. URI’s fleet is 27% electric or hybrid and growing (Those on the “anti-woke” circuit have plenty to choose from in old school equipment). More customers can look to equipment rental leasing for next-gen fleet options to meet sustainability initiatives depending on their shareholder expectations and location. For the presentation, URI touted and detailed their lower GHG intensity and 2030 goals. URI cited some other aspects of ESG including the fact that it was upgraded to a AA level ESG rating by MSCI. URI also ranked in the 1st tier on CPA-Zicklin Index (score 98.6).
Industry verticals cut across a wide range: URI spent some time clarifying their growth across various markets including higher margin specialty equipment and the important role still played by general equipment in their account base. They cited a lower exposure to the high beta segments such as upstream E&P as opposed to the major projects underway in midstream and LNG. The takeaway is that they have an edge as a major scale player with some of the newer mega-projects underway in Energy. The tailwinds from the Infrastructure bill, private sector EV investment, the legislative support for onshoring semiconductor capacity, the LNG buildouts and related infrastructure action, and IRA will get fleshed out in coming quarters and get more infill on the details. The equipment rental players are right in the middle of it.