
United Rentals 1Q23: Company Comment
We look at 1Q23 United Rentals earnings as low leverage and high free cash flow rule the story.

United Rentals (URI) has posted strong earnings and free cash flow in 1Q23 while its favorable guidance offers a wide-angle vantage point on end market demand for equipment at a critical point in the economic cycle.
URI’s strong liquidity, low leverage for its credit tier, leading business position in a growing industry subsector, and demonstrated ability to grow by acquisition and execute on integration still make for a solid credit profile that even managed to get an IG rating on its last secured bond issue.
The 1Q23 results and reaffirmed guidance for 2023 paint a picture of sustained and steady demand fundamentals with an expectation for 20% growth in both revenues (16% pro forma) and EBITDA with a midpoint EBITDA margin estimate holding around 48% for FY 2023.
For a company that can be seen as a proxy for the health of nonresidential fixed asset investment, the guidance and broad details on end markets provided by URI certainly pushes back on recession scenarios emanating from the construction markets and industrial capex planning in 2023. They hammered home how their guidance reflects a broad level of more insulated activity from the cycle debates and category worries that hit the headlines (e.g., offices).
URI 1Q23 earnings and guidance showed healthy demand from a well-diversified customer base. The macro and micro level color and bullish expectations from URI is favorable for credit quality even if the recurring debate on cyclical expectations could lead to more questions in the equity markets on what multiple to assign to that strong base of earnings. The cash flow story, margins, and low leverage are a mainstay for bondholders.
Multiyear lows in leverage and high free cash flow are impressive. The company could easily be rated higher in the ratings tiers based on metrics and its history across a lot of turbulent times. In URI’s case on credit ratings, the layers of the capital structure complicate ratings for the unsecured. The overall profile of URI is investment grade caliber and could in theory get rising star status on an unsecured basis. The $1.5 bn of secured bonds (6% of 2029) used to fund the Ahern deal are in the IG index, but below that BBB3 composite rating is a single 2L BB1 composite bond with the bulk of unsecured bonds at a BB2 composite.
The profile of liquidity and debt protection metrics show low risks vs. many BBB tier bonds and notably vs. high fixed cost cyclicals with higher leverage and more volatile earnings. URI has stood the test of wild times since the company started a leveraged roll-up operation in the 1990s and that includes the longest HY default cycle in history (1999-2003), the credit crisis, and the pandemic. The company has been tested and kept on growing.
URI as a bellwether indicator….
Away from the desire to stay on top of the operating fundamentals and financial risk trends of an issuer that has been consistently in the Top 50 US HY names, United Rentals also offers a broad look at a wide range of end markets in nonresidential construction. URI markets cut across a dozen major verticals and a wide geographic swath of regional markets in North America. Being more US-centric is a virtue these days given the geopolitical state of affairs. The theme of “the return of the supplier chain” offers favorable risk symmetry for URI on domestic capex.
In terms of recession risk, URI has shorter lead time in decision-making to adjust net and gross capex plans, so their actions tell a story about the macro side of the ledger as well. Watching URI can give insights into the risks facing less flexible cyclical issuers and especially those with a high level of fixed costs.
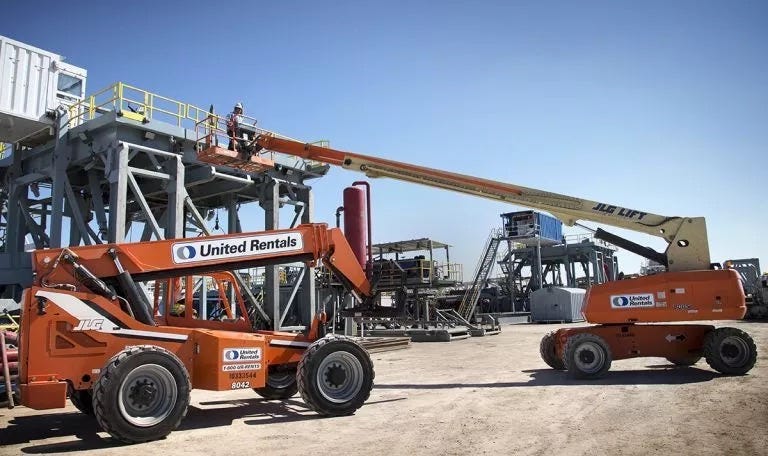
With a leading 17% market share in North American equipment rental, over 1500 rental locations, over 1 million equipment units, and almost 25,000 employees servicing an active customer base, that is a lot of market color for a company making capex decisions and managing a portfolio of equipment including used equipment for sale every year.
In other words, URI customer feedback and equipment purchasing plans roll up to a forecast. They rely on bottom-up color to make these decisions, so the optimism in their guidance is useful input for recession risks. The GDP numbers released this past week show the uneven nature of the fixed asset investment categories (see GDP 1Q23: Devils and Details 4-27-23), so we will use what we can find for signals. For URI, the customer mix is Industrial & Other (48% of revenues), Nonresidential Construction (47%) and Residential (Multifamily at 5%).
The company offered details on the range of markets showing strong demand and clarity on how to look at the pieces of “nonresidential” and industrial verticals across the public sector vs. manufacturing vs. power. Their point was to not get too caught up in “offices” story lines when the word “commercial” is used. They commented on the broad “commercial” market in a manner that was interesting. They cited offices as a category at 8% of total, but highlighted sectors such as “public” at 40%, manufacturing at around 12%, and power around 11%. URI frames the broader checklist of verticals as offering a very wide range of opportunities.

The comparative stock return chart above frames URI vs. Ashtead (ASHTF) as the #2 player in the equipment rental market. We compare those two major rental operators to the S&P 500 across the period starting in early 2019. The favorable performance of equipment rental vs. the broad market is evident (and then some).
The time series underscores how well positioned United Rentals has been in a sector that continues to post favorable secular trends. We see URI well out in front in terms of the breadth of the customer base using leasing as its growing equipment financing choice. We also see the URI stock showing how expanding dealership ranks and service quality has driven profitable growth at Ashtead (the Sunbelt brand), who is a formidable and very successful competitor. Ashtead is a “plc” and UK-based, but it is a US operation by any objective standard (the UK is not known for its “Sunbelt”).
I have directly or indirectly been watching URI’s performance in various research and risk roles since the late 1990s, and the cyclical turmoil of the ensuing years has been met head-on and pushed through by URI. Those situations offered the debt and equity market a chance to see how the inherent financial flexibility in capex and free cash flow make URI a lower risk HY name even if the growth multiple on the equity side can start to be debated after so many years of breakneck growth in its business through reinvestment and M&A. The challenge of moving the needle on a $25 bn market cap company is not easy.
In more recent years, the financial resilience matters to bondholders across what has been a wild period by any standards after the experience of COVID, supplier chain disruptions, multiple acquisitions, and now the protracted backdrop of inflation and Fed tightening. We look at the capex flexibility and shorter capex reaction time in the balance sheet and liquidity section at the bottom of the commentary.

The above chart lines up a peer group of four major rental companies (URI, Ashtead, H&E Equipment, and Herc Rentals), three major equipment manufacturers (Caterpillar, Deere, and CNH Industrial), and the S&P 500. We line them up in descending order based on the total returns for the rolling 3-month period.
We included the manufacturers as another frame of reference on how the markets might be viewing capex planning and demand for machinery and equipment. CAT and CNHI have more in common with the mix at URI than Deere given the rental fleet mix tied to construction and industrial equipment as well as energy and power.
The chart shows a weak performance by the “equipment-exposed” over the past 3 months and YTD with all of them underperforming the S&P 500 over the 3-month period highlighted. We see URI and Ashtead holding in better than the rental peers and ahead of capex intensive and high fixed cost operations such as CAT and CNHI.
The global scale and manufacturing profile make those companies very different animals, but we include those as other proxies for the cycle and demand. URI is North American centric, and we view that as a positive. Looking back over the 1Y time horizon, we see URI and Ashtead at the top of the group in double-digit return range.
As favorable as the guidance was from URI in the 4Q22 earnings reported and reaffirmed in the 1Q23 release, there will still be questions on pricing power and supply and demand factors on the scale and mix of the fleet in total or by region. That is the fine print analysis on utilization, pricing, and used equipment value risks that the micro analysis needs to dig into and which handicaps how far URI stock can rise (or falter).
The nuances of utilization and rates and related risks will be a debate among URI stock watchers as we wade further into the cycle and the “hard landing, soft landing, and no landing” handicapping keeps the beat going. For credit quality, a weak economy and soft demand for equipment leads to a pullback in net capex. Those are decisions that can be made on a short timeline unlike those for manufacturers of equipment.
As URI highlighted on its call on a topic that we have been routinely discussing in our work, the next round of capex decisions for numerous sectors are marching to a less cyclical beat right now. Public sector infrastructure and the IRA bill changes the scale of recession threats to spending even in a downturn. Sectors such as electric vehicles (and battery plants), semiconductors, energy, and power are about complex plans that need to get underway and stay busy. Discussions of multiyear projects such as EV-related plants were among the talking points in the URI Q&A. That does not mean capex will not get cut in a recession, but some needs mitigate the downside.
In terms of the macro threats to capex levels, there is the equation of simply who is choosing to change their methods of equipment finance and embracing leasing. Leasing can pick up share in a weaker capex market. That is more about the secular growth story in leasing than the cyclical discussions. We will be out on this topic as we cover this sector. Ashtead, the #2 player, has an April 30 fiscal year and usually releases around mid-June. Their color will be useful as an investment grade issuer that worked its way up from the BB tier. Ashtead also had some secured bonds on the way up the ladder, so this is not a new story line.

The above chart runs through the period from 2019 through 1Q23. The period that started in 2019 saw the backdrop of a slowing economy that prompted Fed easing (many revisionists forget the weaker economy in 2019 and blame it all on COVID later). The tariff backdrop spooked capex levels back in 2019 but COVID erased history by mid-March 2020.
URI numbers in the chart above cut across adverse reactions to COVID and a shocking cyclical swoon during the pandemic. ZIRP, QE, and massive fiscal support drove a demand rebound that was characterized by massive supplier chain problems. If there was a compelling need for equipment to ride the recovery in 2021 and into 2022, the simple question is “Guess who had equipment?” The major rental operators did.
URI revenue grew by over 24% over the four fiscal years to 2022 and Adjusted EBITDA rose by 29% with a modest expansion of EBITDA margins from 46.6% to 48.3%. Gross margins bottomed out at a very healthy 37.3% in 2020 and expanded to 42.9% in FY 2022, the highest gross margins of that stretch. For 1Q23, we see a record high for the rental revenue line and marked a 26% increase over 1Q22.
The $2.0 bn Ahern deal closed in Dec 2022, and that starts a fresh round of integration of a Top 5 leasing operation. The deal was funded with a $ 1.5 bn senior secured bond deal and use of the ABL revolver. On a pro forma basis including Ahern, rental revenues were up 16.6% so URI was growing at a good clip ex-Ahern. That bond deal was an investment grade 1L deal and thus allowed URI to further diversify its funding sources in the IG markets.
The guidance offered by URI shows a target revenue range of $13.7 bn to $14.2 bn, Adjusted EBITDA of $6.6 bn to $6.85 bn, net rental capex of $2.0 bn to $2.25 billion (after gross capex of $3.3 bn to $3.55 bn), and free cash flow of $2.1 bn to $2.25 bn. Those are some hefty numbers after a revenue line of $11.6 bn in 2022 and an Adjusted EBITDA line of $5.6bn.

The above chart breaks out the relatively simple segment mix of General Leasing vs. Specialty equipment. The margin % differential is material, but the lower margin segment is still looking at gross margins above 30% even if they are tailing off in 1Q23. Some of the margin pressure in General Rentals was tied to the Ahern acquisition as they purchased a lower margin business that they will look to integrate into a higher margin operation. That is a story line seen before for the acquisition-intensive URI, and the history has been a good one.
In an equipment market where the fleet has more technological sophistication, more complex digital applications, more service requirements (use of the equipment as well as servicing and supporting customer needs) and a broader range of specialized markets across a diverse customer base, the “Specialty” label means something. URI breaks out various equipment categories in its detailed presentations. The period from 2012 to 2022 shows CAGR for specialty revenues of almost 28%.
In a downturn, managing fleet capacity can be a challenge, and the ability (or willingness) to protect pricing is always a question mark subject to how quickly a downturn comes on and how hard that landing may be. URI has pushed through economic crisis moments in recent years with the credit crisis and pandemic and has come out bigger and stronger as we noted in the earlier stock return charts going back 10 years.

The above chart runs through the history of debt, leverage, and notable cash flow statement line items since 2019 through 1Q23. Leverage of 2.0x at year end was the lowest for the 12-31 balance sheet date since before 2012 (detailed in URI’s presentations) and ticked down at 1Q23 to 1.9x. URI states a target range of 2.0x to 3.0x.
URI has no long-term bond maturities until 2027, so the refinancing flexibility comes down to rates and planning. As an aside, URI has consistently run its leverage at very manageable levels for a protracted period. Older hands can start to forget URI almost did an LBO in 2007 that fell apart when Cerberus pulled the plug in the face of a credit market crisis unfolding (Nov 2007).
Leverage of around 2.0x is low relative to URI’s history of financial profitability and cash flow metrics and its operating track record across cycles and across acquisitions. That level of financial risk together with operating consistency would seem to be worthy of higher credit ratings based on multiple risk factors. The company perhaps has too many layers (1L, 2L, unsecured) for unsecured bonds to make it to IG ratings in 2023 or even 2024.
IG ratings are not on their stated priority list, but URI could in theory get there just on consistency and the cleanup of some layers. The redemption dates on the secured issue could be the start (redeemable at the end of 2025) and getting their bank lines changed. That will take time, so it is not likely even a 2024 event. That still makes URI a very solid crossover bond and the 1L issue a rare, secured BBB tier bond. There is little incentive to clean up low coupon layers such as the 3.875% 2L bond of 2027.
Profitable growth and ongoing expansion to reward shareholders remain near the top of that priority list. That is evident in the investment strategies, stock buybacks and now a newly initiated dividend. For 2023, URI is looking to complete the $1 bn in buybacks after $303 mn were detailed for 1Q23 in the cash flow statement.
Based on both longer term and very recent history, URI is still focused on steady growth and rolling up a space that has seen the concentration of the Top 10 move from around 20% in 2010 to 40% at the end of 2021. URI and Ashtead have been driving more of that market consolidation than anyone else, and URI boasted a 17% share as of year-end 2022.
URI easily has the free cash flow and financial flexibility to keep that consolidation process going without impairing credit quality and driving accretive growth for shareholders. In the meantime, URI has also shown that debt-financed M&A can be delivered alongside buybacks and more recently even dividends.
The capex lines are laid out in the chart above. URI covers capex histories for longer time horizons in URI’s quarterly presentations. The gross capex line has a lot of flexibility as highlighted in 2020’s gross capex line while the used equipment market is very deep and liquid. Thus “net capex” can really swing around on short timelines to defend against hard landing scenarios or to exploit surprises to the upside.
Long ago in its earlier years, the company even had a brief period of “negative capex” as the company went defensive during a period of market turmoil. “Negative capex” is simply portfolio/fleet liquidation. That is not relevant to today’s market other than to highlight how much “give” there is in the capex numbers to defend free cash flow and liquidity metrics.