
Market Commentary: Asset Returns 6-14-26
We update running timeline asset returns as a relief rally on Iran this week meets a mixed tech sector stock performance.


JFK in Berlin: “We cannot negotiate with people who say what’s mine is mine and what’s yours is negotiable.”
We review the asset return results across a range of time horizons after a week with ugly inflation trends, and an Iran “deal” announced on Sunday (or MOU in process that could be signed this coming Friday). The details are not clear nor are the scale of side deals which will not likely get reported. An end to the reckless, poorly planned fiasco is worth celebrating if it holds.
Inflation has stayed grim, but the market has been looking past the May inflation numbers. There were many “worst since 2022” references the past week with many stand-alone lines posting bad numbers that do not get much media visibility (see Producer Price Index May 2026: Too Many “Since 2022” References 6-11-26, CPI May 2026: The 4% Rubicon 6-10-26).
The Strait of Hormuz supply shock remains tenuous even if scenarios on the aftereffects (e.g., when does China step back in to buy?) have ebbed and flowed. The risk of escalation still cannot be ruled out after Trump issued a less-than-veiled nuclear strike threat over the weekend (see Geopolitical risk: Trump’s Nuclear Saber Rattling? 6-14-26). Like the long drive one experienced as a kid, some in the market will say “call me when we get there.”
The market gets its first Warsh-led FOMC meeting this week as investors will be looking for candor or hints of macro doubletalk and politicized ambiguity. Retail Sales will offer some new color this week on the consumers while Housing Starts will offer another important signal on how builders are dealing with traffic and mid 6% mortgage rates.
Toxic geopolitics, USMCA threats, a fresh wave of tariffs, and wholly dysfunctional domestic politics with some bad policy intent (voter suppression, fresh ICE swarm threats at NYC) have not taken a sentiment toll in the market (yet), but negative real wage growth and plunging savings rates are very real, tangible economic realities.
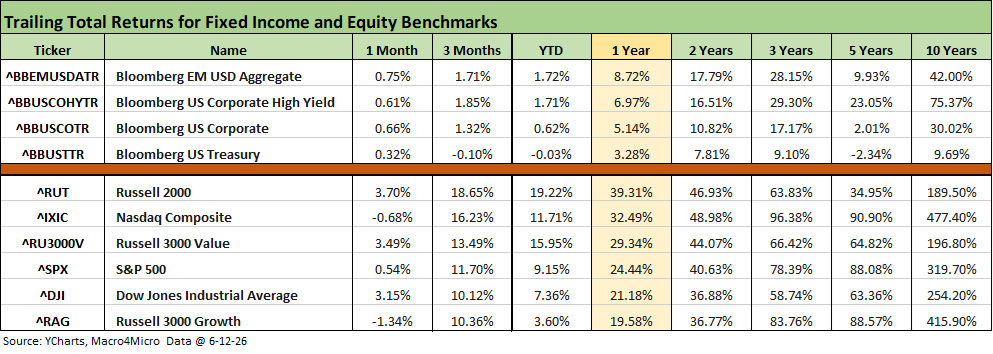
The above table breaks out various timeline returns for the equity and fixed income benchmarks that we monitor. The trailing 1-month, 3-months, and YTD show that the post-Iran period has not derailed the very strong equity markets. The semiconductor and AI ecosystem and infrastructure subsectors have dwarfed the setbacks in the software and SaaS-based services operators as we cover below in the charts.
In contrast, debt markets have felt the sting of duration but not credit risk pricing in high grade corporates or HY bonds. The world of private credit is a different story. The negative returns in UST markets over 3 months and YTD highlight the inflation worries and the spiraling UST deficits and supply scenarios.
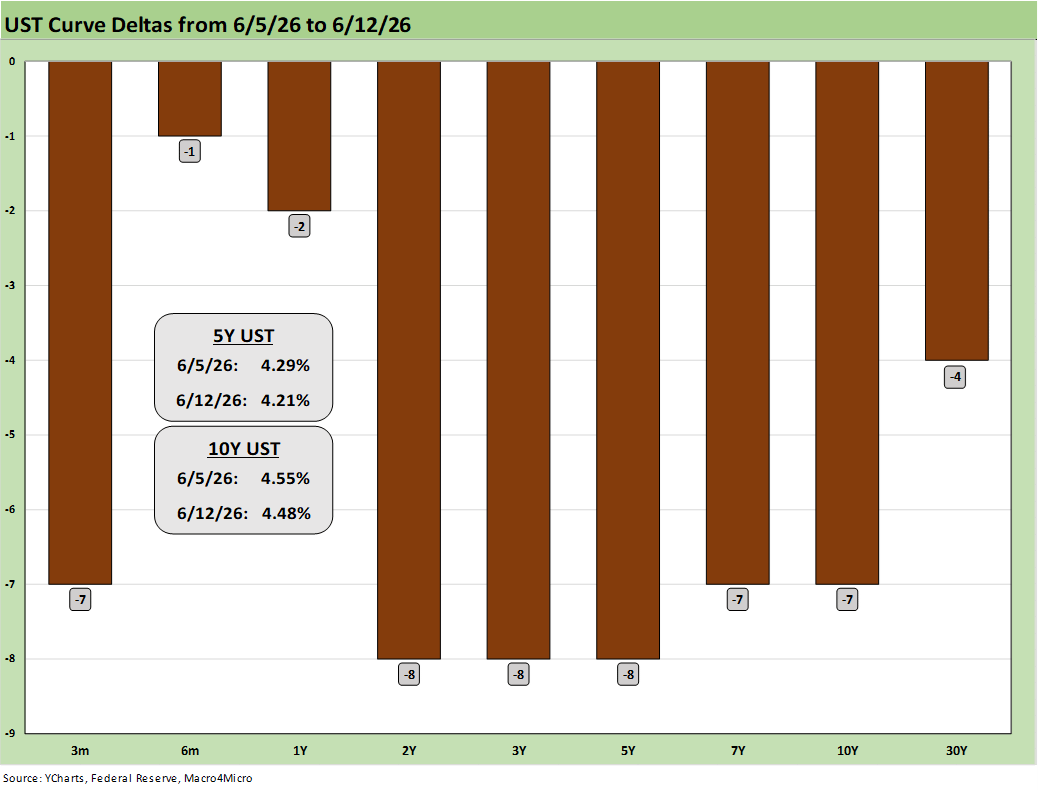
The weekly UST deltas above show a rally week as oil declined and investors looked past the May CPI and PPI numbers. Those inflation metrics posted trends that were decidedly unfavorable (see Producer Price Index May 2026: Too Many “Since 2022” References 6-11-26, CPI May 2026: The 4% Rubicon 6-10-26). The tough call is the question of “Where does oil go from here?” after the immediate dip we are seeing now. The proclamation of a done deal (in theory) subject to a final signature and process is getting a lot of qualifiers and caveats from experts outside the partisan theme spinners on each side. WTI is posting an $80 handle as we go to print down from $90+ to close last Friday (6-5-26).
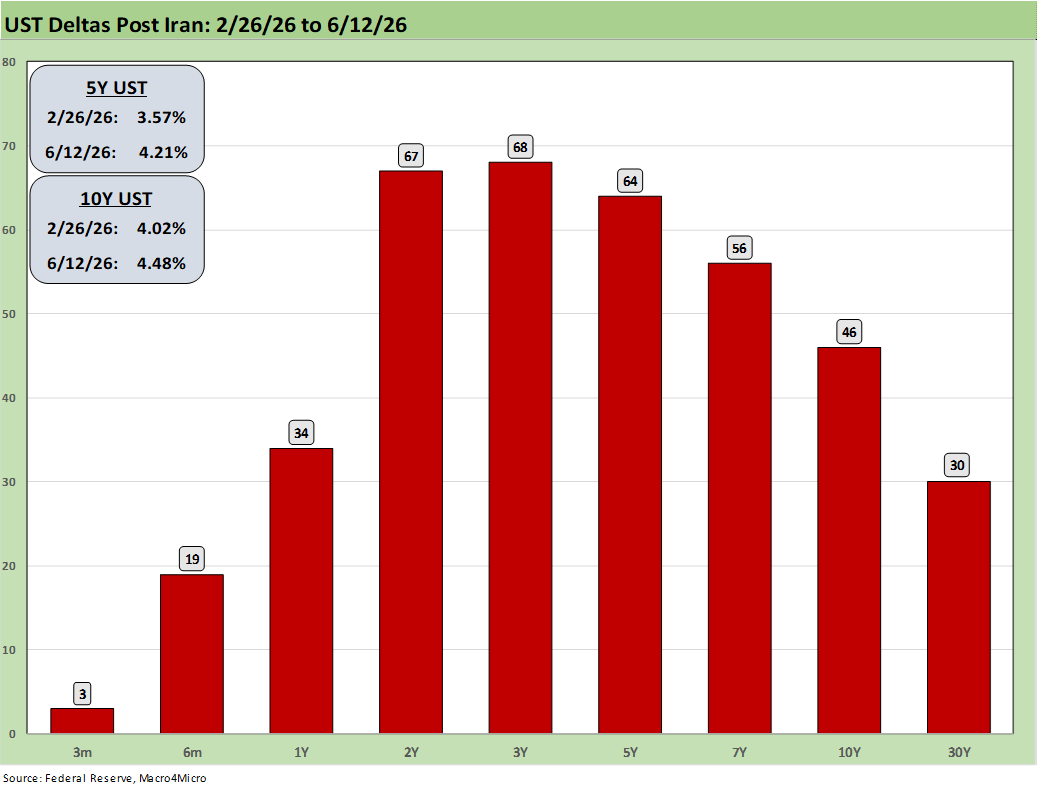
The above UST deltas cover the post-Iran period from 2-26-26 (the bombing started 2-28) through the end of the past week. A bear flattener was framed by +67 bps in the 2Y and +46 bps in the 10Y. We see the 30Y at +4.97%.
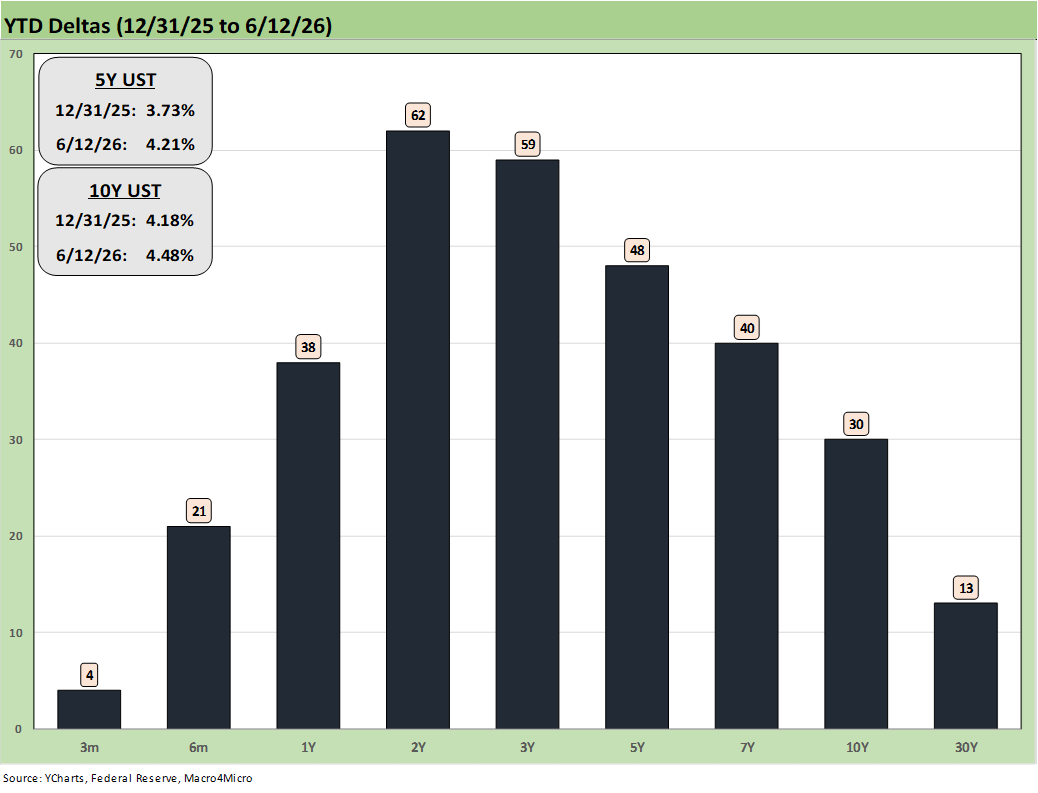
The YTD UST deltas posted above have been a headwind for bonds YTD. As we cover in other charts below, all 7 bond ETFs were positive but 5 of the 7 were below 1% returns YTD. The two above 1% were HYG at +1.65% and EMB at 2.29%.
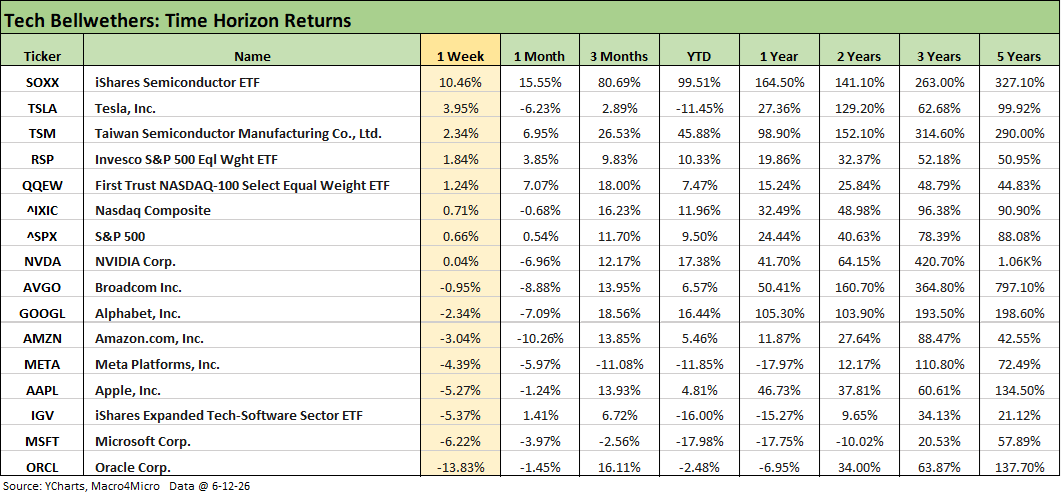
The tech bellwether table highlights the major divide of recent weeks between the semiconductor names and ETFs and software and SaaS names. The AI ecosystem in general has made winners of those attached to data centers and what goes in the data centers. On the negative side, the business model threats from AI to software-related products and services have put some companies in the badly out of favor bucket. We have been covering that in the weekly tech check commentaries and in various charts below where we break out more single names.
The above chart highlights the tale of two product subsectors again with Oracle on the bottom for the week at -13.83% and the Semiconductor ETF (SOXX) at #1 with 10.46%. The Software ETF (IGV) was 3 off the bottom at -5.37%. Microsoft is sitting in 2nd to last place for the week at -6.22%.
The Mag 7 weighed in with 2 positive in Tesla (TSLA) at +3.95% but NVIDIA (NVDA) was barely positive at 0.04%. The rest of the Mag 7 were negative.
The following is a cut and paste from a Saturday LinkedIn post with some edits and updates:
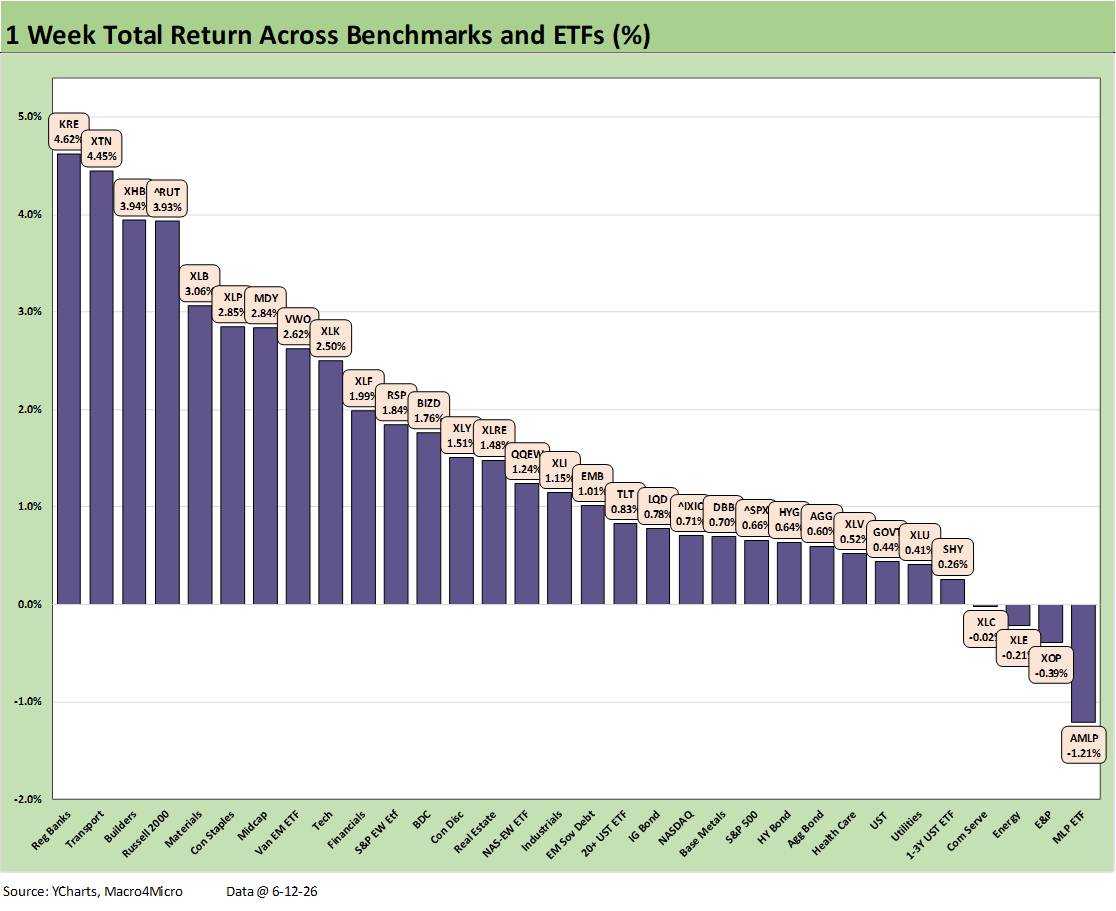
The chart updates the weekly total returns for the 32 benchmarks and ETFs we monitor. The week was obviously a winner with a score of 28-4 with 3 of the 4 lines in the red comprised of energy ETFs with the Midstream ETF (AMLP) in last place and the E&P ETF (XOP) joining the broader Energy ETF (XLC) in the bottom 3. The Communications Services ETF (XLC) was very slightly negative.
Notable winners this week included Regional Banks (KRE), Transports (XTN), and curve-sensitive Homebuilders (XHB) in the top 3. It is easy enough to point at the hopes for long-end curve relief if the Iran-Trump mind games finalize a solution with the skeletal detail from Sunday. WTI ending Friday quoted at $84.88 vs. $90.54 the prior Friday and $80+ as of Sunday with the Trump announcements on the “deal being done” (as he describes it). Lower oil can flow into mortgage relief via the curve. For Transports, lower oil is intrinsically favorable for jet fuel, diesel, and gasoline.
Duration was a winner this week on a favorable UST curve shift as detailed earlier despite some ugly inflation data in both the CPI and PPI releases. We covered inflation metrics on those release days in separate commentaries (see Producer Price Index May 2026: Too Many “Since 2022” References 6-11-26, CPI May 2026: The 4% Rubicon 6-10-26). We see all 7 fixed income ETFs in positive range.
There were some very important CPI lines near and dear to the consumer that got minimal focus in the headlines – or for that matter in the text below the headlines. The FedWatch odds are not promising easy times for Warsh. The FOMC as a group will be hard to convince. Payroll trends have been a “good news, bad news” item but do not help the easing odds.
As we go to print, there has been some notable realignment from earlier in the weekend (Saturday). The highest odds now are for fed funds unchanged by the Dec 2026 FOMC meeting at 49.4%. The prior reading on the weekend showed 1 hike leading at 42.3%. The 1-hike odds have now declined to 38.2%. The odds of a single fed funds cut by the Dec 2026 FOMC meeting is still quite low but have risen to 1.7% after posting a 1.0% probability late morning Saturday. The odds of 2 hikes have declined to 9.7% from 14.9% earlier in the weekend while 3 hikes are now 0.9% after 2.1% on Saturday. These will be rapidly moving around as the week kicks off and as the Iran news gets handicapped.
The S&P 500 showed a favorable sector return profile this week with 9 of 11 sectors positive. Of the 11 sectors, only Communications Services and Energy were in the red. The S&P 500 was still only in the 3rd quartile. The Equal Weight S&P 500 ETF (RSP) beat the broad benchmark and was in the upper half of the 2nd quartile vs. the lower half of the 3rd quartile for the S&P 500 index.
NASDAQ was also in the third quartile, joining the tech-heavy S&P 500 with a weekly return below 1.0%. The small cap Russell 2000 made the top 4 in the high quartile with Midcaps (MDY) a few more slots below in the top tier.
As we cover separately in the Tech Check weekly return chart, the tech equity mix was very divided with semiconductors rallying back impressively but software taking a beating. The Semiconductor ETF (SOXX) ranked at #4 with +10.5% on the week while the Software ETF (IGV) was at the bottom of the 3rd quartile at -5.4%.
The following is a cut and paste from a Saturday LinkedIn post with some edits and updates:
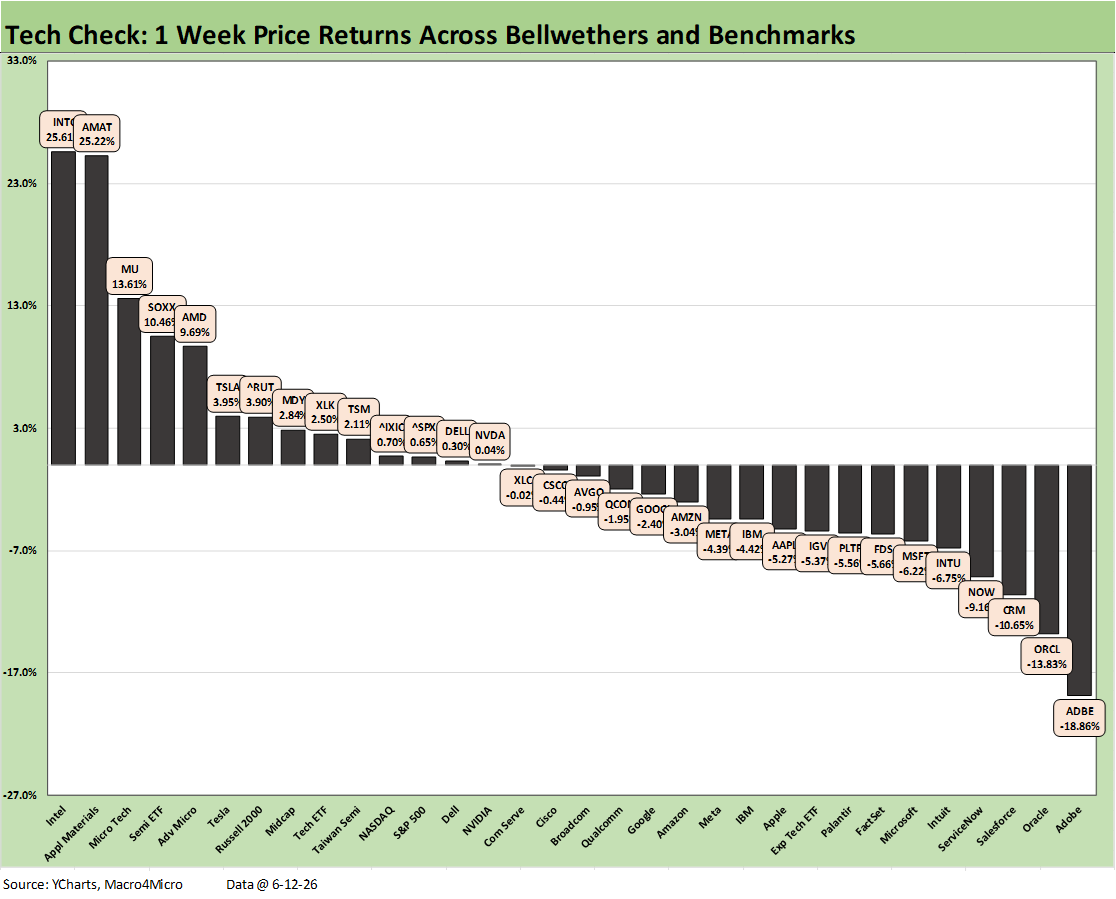
The Tech Check return chart this week shows the tech mix overall still having a rough time even with some major semiconductor names generating solid rebounds on the week. The price return score was 14-18 in this mix and shows a general theme of positive trends for semiconductor and critical AI ecosystem names. Meanwhile, software and SaaS-based services names were back in the tank.
We see 4 semiconductor names with positive double-digit returns on the week but with 3 software/SaaS names with negative double-digit returns. The Semiconductor ETF (SOXX) ranked #4 at 10.46% behind 3 major semi-based names in Intel (INTC) at #1, Applied Materials (AMAT) at #2, and Micron (MU) at #3. AMAT is wagged by global capex expansion and equipment demand.
The Software ETF (IGV) was at the bottom of the third quartile at -5.37%. That is a return differential for SOXX vs. IGV of 15.8 points in a single week. Adobe (-18.86%) and Oracle (-13.83%) earnings reports this week did not bring joy as those two names held down the bottom two positions.
The Mag 7 were once again spread out with MSFT in the bottom quartile, 4 in the 3rd quartile (AAPL, META, AMZN, GOOGL), NVDA in the 2nd quartile, and TSLA in the top tier. The “Mag 7 + 3” got little extra support from “the 3” with Oracle deep in the red, Broadcom (AVGO) at -0.95% and Taiwan Semi (TSM) a more muted +2.1%.
The CBOE uses a “Mag 10” mix on options (MGTN) that includes Broadcom, Advanced Micro (AMD), and Palantir (PLTR). PLTR posted -5.56% this week in the bottom quartile. Another broad frame of reference is the Tech ETF (XLK) at +2.50% at the top of the 2nd quartile. Not shown above is the Equal Weight NASDAQ 100 ETF (QQEW), which posted +1.24% on the week.
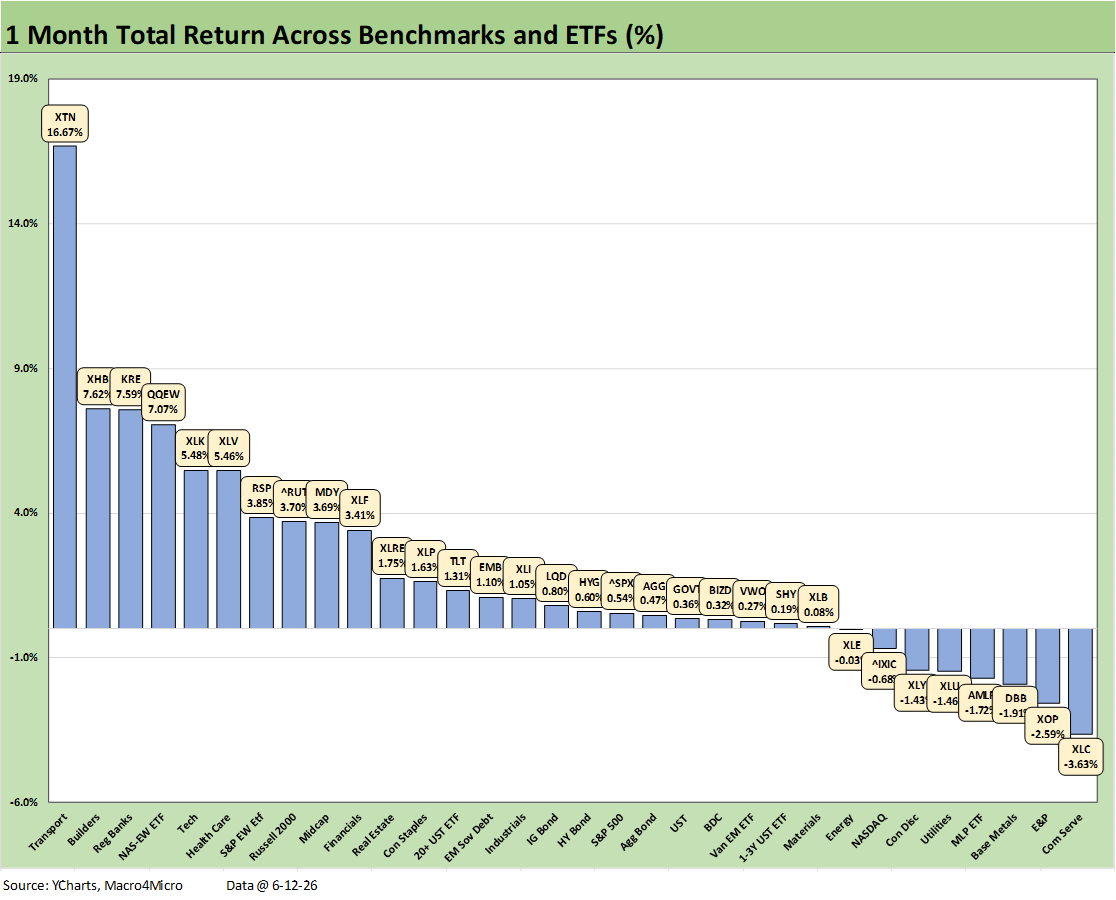
The 1-month score of 24-8 was still solid for the broader group of 32 benchmarks and ETFs. For the names in the red, we see 3 of the 8 from energy ETFs (XOP, AMLP, XLE) with the NASDAQ in the red and Communications Services ETF (XLC) in the bottom. With some hope for reduced supply shock out of the Gulf, we also see Base Metals ETF (DBB) in the bottom quartile. Consumer Discretionary (XLY) as a major S&P 500 sector was in the bottom tier, so that needs to be watched.
Among the big winners was Transports (XTN) way out in front at #1. XTN saw airlines soar on jet fuel relief and a range of freight and logistics operators saw major, healthy double-digit rallies for the month. Homebuilders (XHB) get wagged by mortgage rates and the Tech ETF (XLK) is heavy on the major semi names.
Of the major indexes, Russell 2000 was the winner in the top quartile with Midcaps (MDY) in the second quartile, S&P 500 in the 3rd quartile, and NASDAQ in the bottom quartile. The Equal Weight S&P 500 managed to end up in the top quartile just ahead of the Russell 2000.
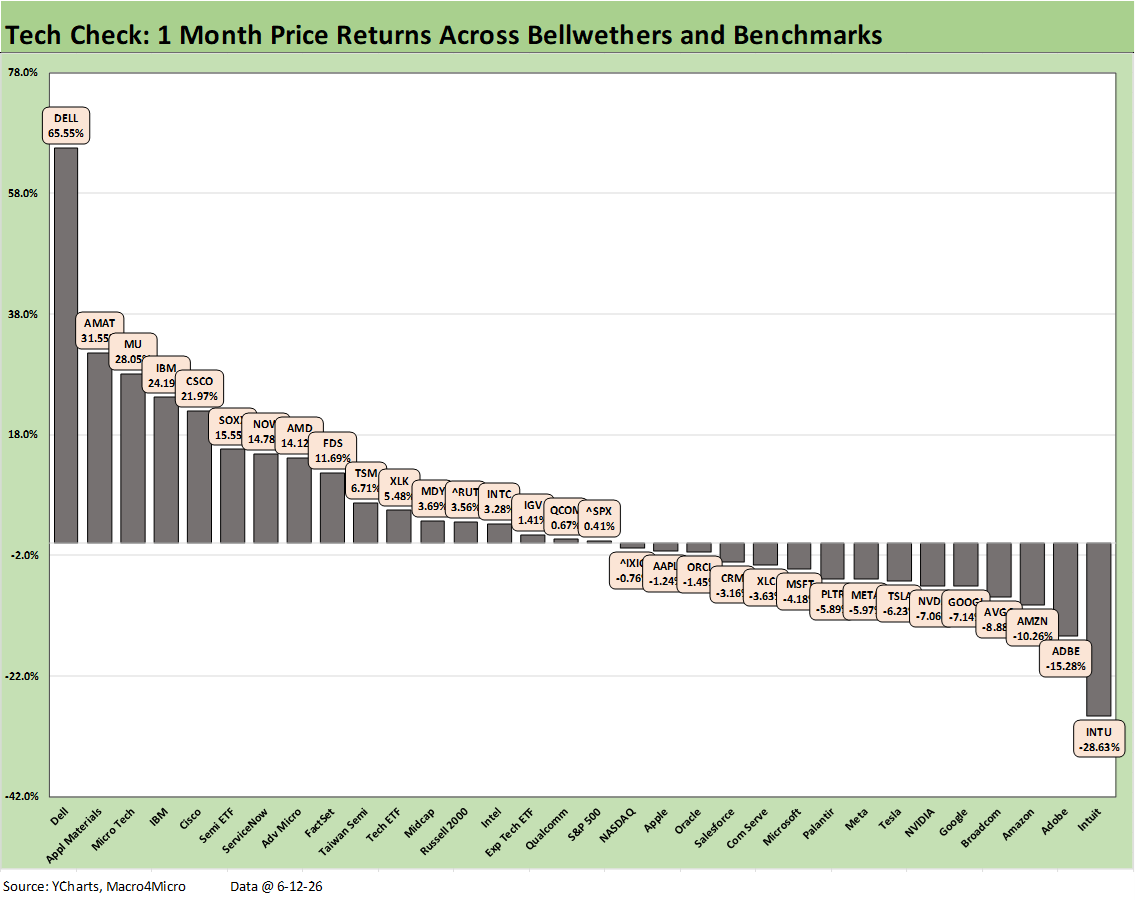
The 1-month Tech Check follows the pattern discussed earlier and across the recent weekly updates. The 17-15 score mirrors the trend of semiconductors performing impressively and the software and SaaS-based services companies taking a beating. The big difference has been a few more bouts of downside for semis and AI ecosystem names, but the running results are still stellar.
For the Mag 7, we see 5 of the 7 in the bottom quartile with only Microsoft (MSFT) and Apple (AAPL) making it into the 3rd quartile. All 7 were negative. That was notably the case even with NVDA. The Semiconductor ETF (SOXX) posted 15.5% in the top quartile. Dell was the outlier on its sudden and dramatic surge this past month as addressed in earlier commentaries.
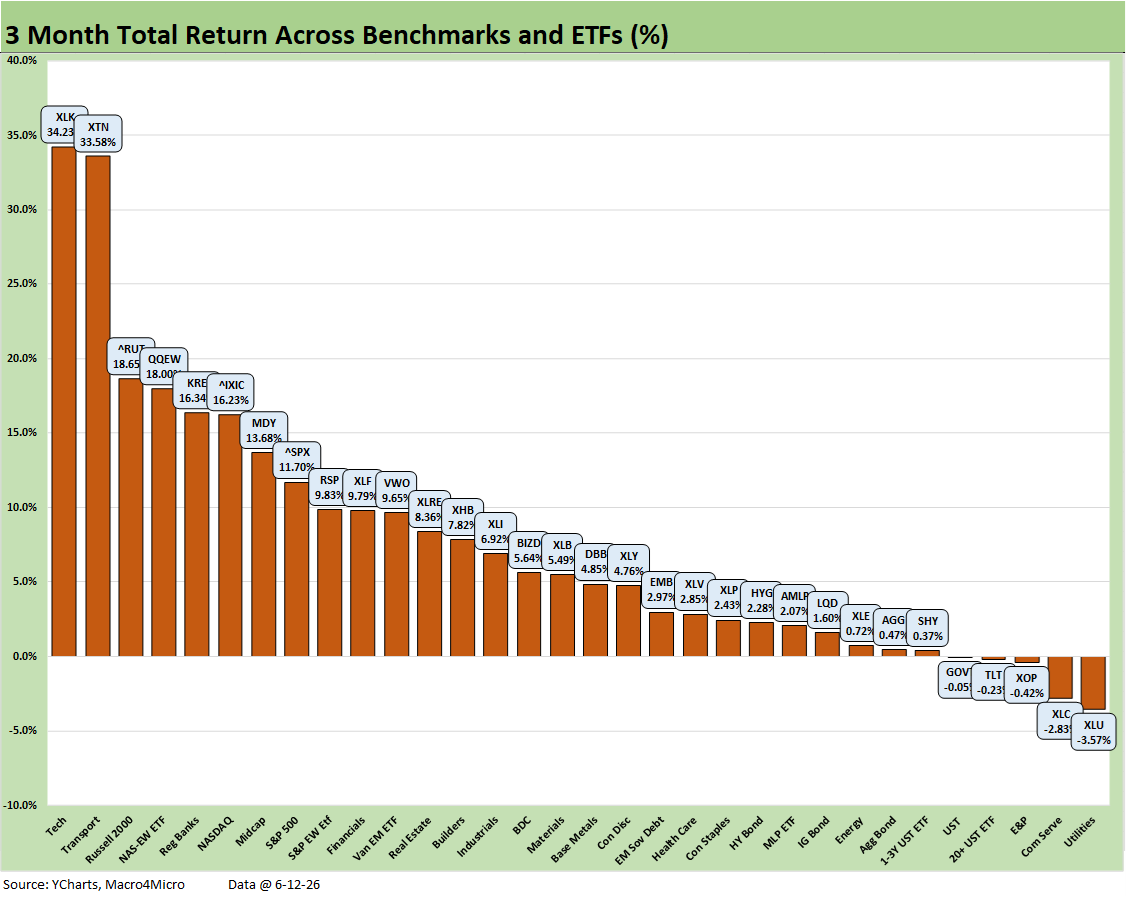
The 3-month return chart is entirely within the post-Iran period with all the big swings along the way. The score of 27-5 is a reminder that the bull market will not bend for now. The bond ETFs were not hit too hard with only 2 in the red with the long duration UST ETF (TLT) and UST ETF (GOVT).
The big winners show some cyclical diversity with Tech (XLK), Transports (XTN), Russell 2000, Equal Weight NASDAQ 100 (QQEW), and Regional Banks (KRE) comprising the top 5. The NASDAQ, Midcaps (MDY), and S&P 500 all made the top quartile with the Equal Weight S&P 500 ETF (RSP) just one notch below the top quartile.
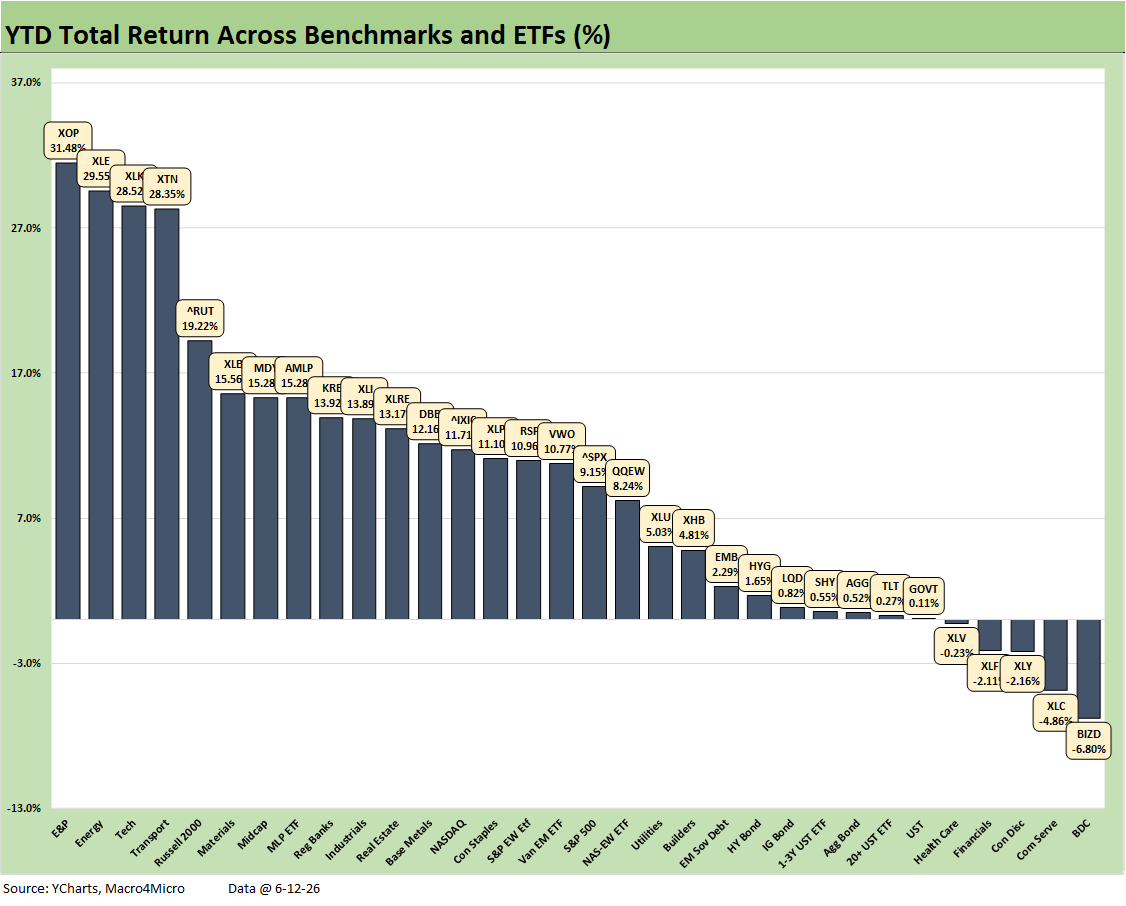
The YTD returns are impressive even with the warm inflation and supply shocks. We see a score of 27-5 with the 5 in the red zone putting up very small negative numbers. The BDCs (BIZD) sit on the bottom at only -6.8% with 8 asset lines in the top quartile posting double-digit positive returns.
It took 11.7% to make the top quartile over only around 5 ½ months. The median return was only slightly below 10% YTD. On a positive note, all the bond ETFs are positive even if only slightly so straddling the 3rd and 4th quartile.
The top quartile includes 3 energy ETFs (XOP, XLE, AMLP) with Tech (XLK), Transports (XTN) and the Russell 2000 in the top 5. Materials (XLB) and Midcaps (MDY) rounded out the top tier. NASDAQ was down in the 2nd quartile with the S&P 500 in the 3rd quartile.
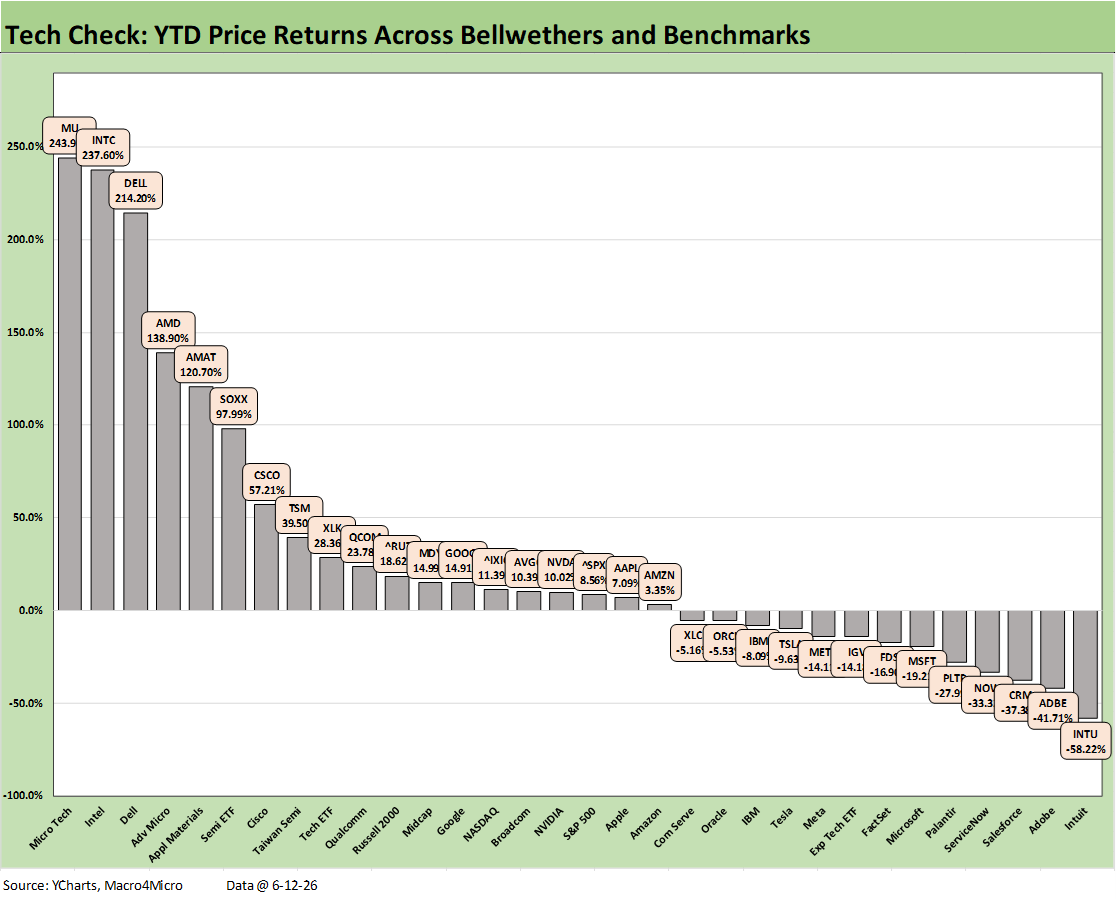
The YTD Tech Check mix continues the theme of a major split between the semiconductors and “data center contents” and AI ecosystem beneficiaries on one side. On the other side was negative returns for software and “AI displacement risks.” The SaaS-based service operators dominate the worst returns.
We see 9 asset lines with double digit negative returns, but the magnitude of the returns for the winners are in some cases off the charts (+243.9% Micron, +237.6% Intel, +214.2% Dell) with a 39.5% return required to make the top quartile.
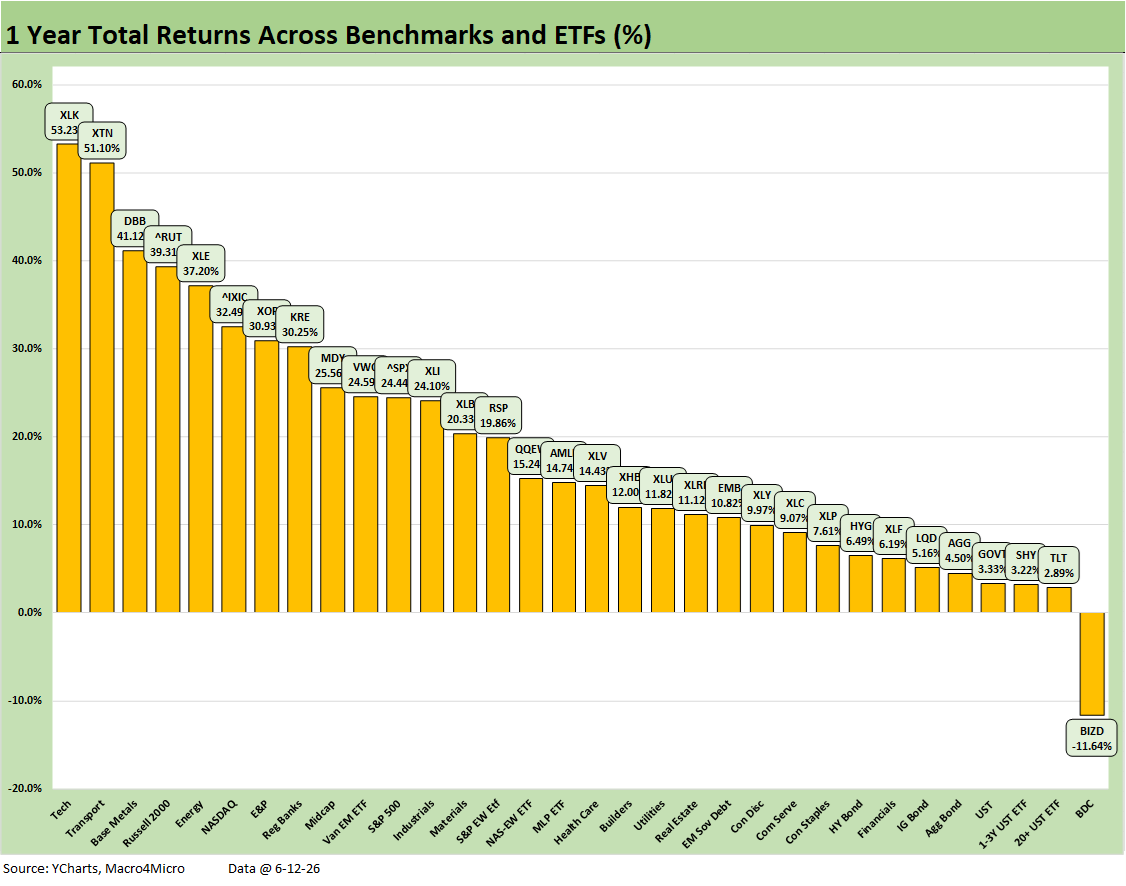
The 31-1 score for the trailing year has been steady with only BDCs (BIZD) sitting in last place at -11.6%. The median return in the mix of 32 asset lines is in the mid-14% range, which comfortably beats the historical long-term return on equities. We see 6 bond ETFs in the bottom quartile with only EM Sovereigns (EMB) in the third quartile.
See also:
Geopolitical risk: Trump’s Nuclear Saber Rattling? 6-14-26
Producer Price Index May 2026: Too Many “Since 2022” References 6-11-26
CPI May 2026: The 4% Rubicon 6-10-26
Market Commentary: Asset Returns 6-8-26
Remembering D-Day: June 6, 1944
Employment May 2026: Big Rebound, Low Multiplier Bias 6-5-26
The Fall of CBS 6-3-26
JOLTS April 2026: A Modestly Positive Turn 6-2-26
Retail Signal Read Part Deux 6-1-26
Market Commentary: Asset Returns 5-31-26
New Home Sales April 2026: Slow Start to Spring 5-28-26
PCE Inflation: Income and Outlays April 2026 5-28-26
GDP 1Q26 Second Estimate: Shrunk in the Dryer 5-28-26
Retail Equity Comps: Looking for Signals 5-26-26
Housing Starts April 2026: Soft Starts in Single Family 5-22-26
D.R. Horton: Financial Powerhouse Despite Cyclical Softening 5-20-26