
Existing Home Sales Feb 2024: Surrendering to Mortgage Market Reality
The +9.5% pop in existing home sales in Feb 2024 has a long way to go to get back to mid-2022 levels, but it is a favorable signal.


A strong sequential rebound for existing home sales is one more signal that the consumer is slowly embracing the reality of the current mortgage market although the individual circumstance of the buyer and seller can run the gamut.
With the UST curve resilient and higher in 2024 ahead of peak home sales season, the Feb recovery in existing home sales volumes may signal pockets of capitulation on mortgage rates for those planning a move and may prefer a targeted existing home on their radar screen vs. a newly built home.
We see increases in the 3 largest regions (South, West, Midwest) but even the decline (NSA) in the smallest market (Northeast) came with the highest increase in price among the regions at +11.5%.
Median prices increased in all 4 regions by a combined total of +5.7% to $384.5K for 8 straight months of price increases.
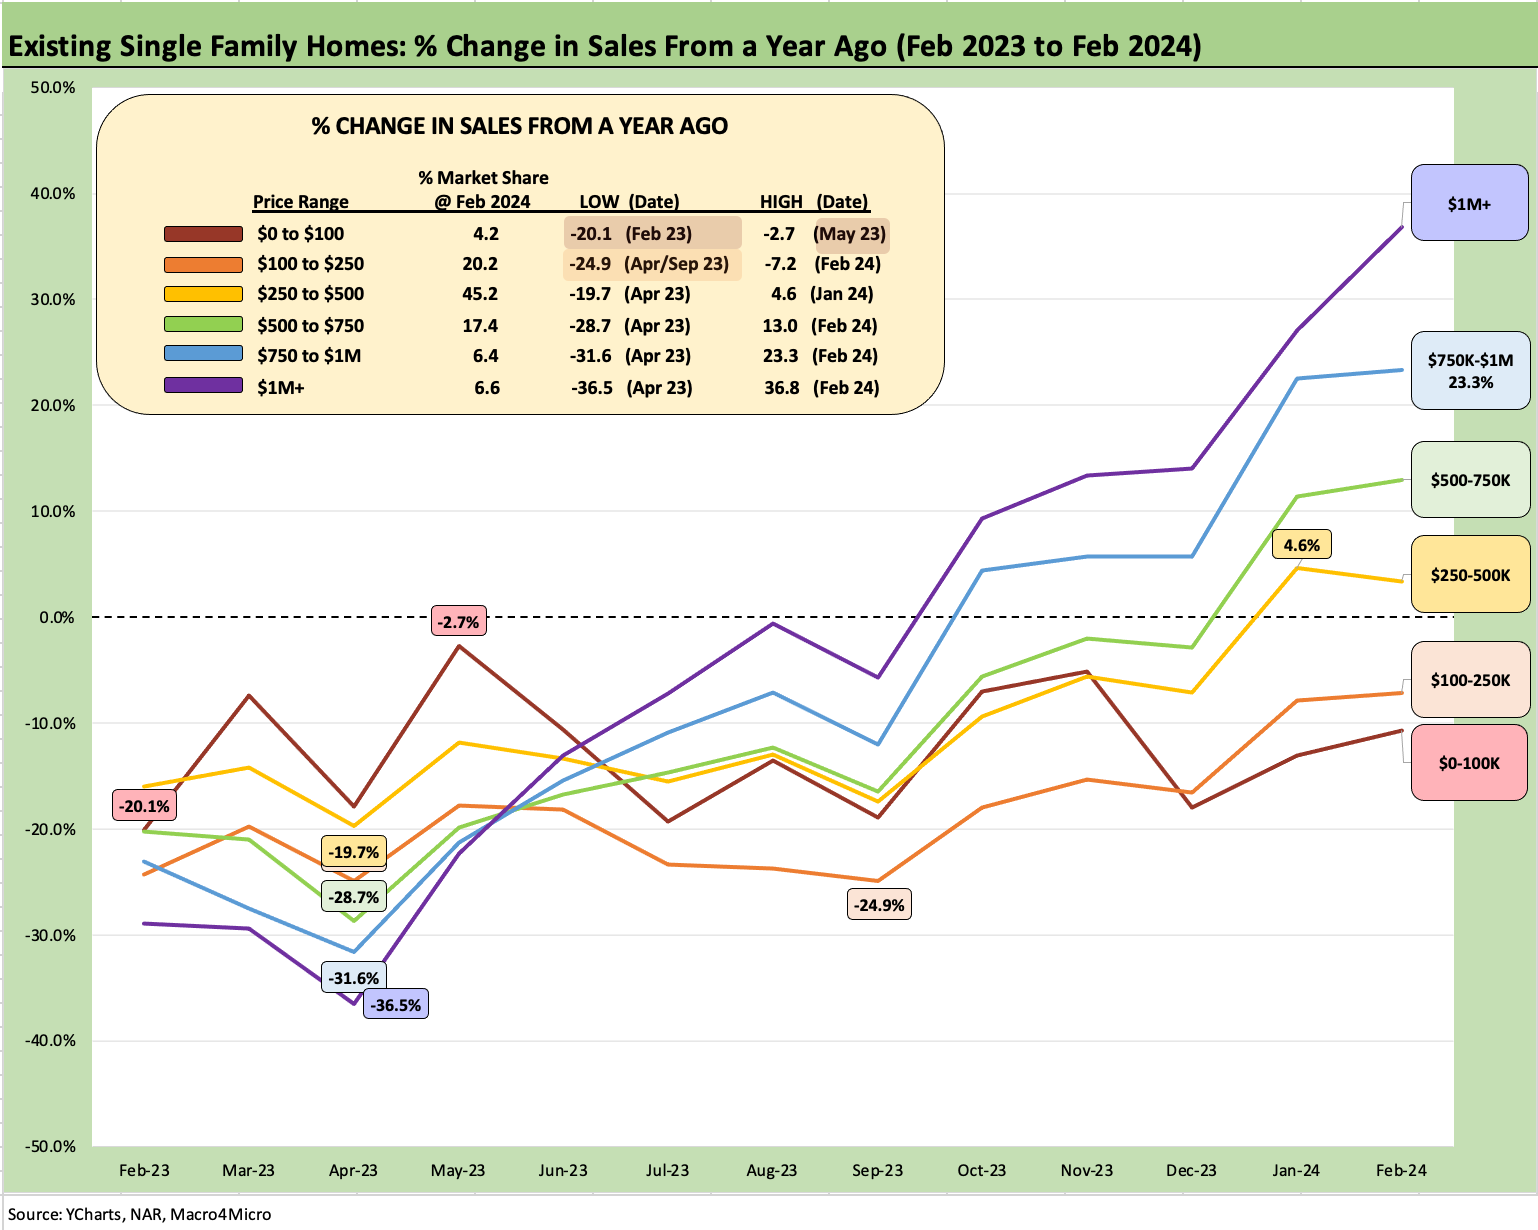
The above chart updates the running LTM timeline for the existing homes sales variances YoY. It is a busy chart, but it just shows the shifting YoY changes as the tightening cycle did its max damage in 2023 at a lag and are now turning positive for 4 of the 6 price tiers tracked. We also detail the price tiers in the final chart in this commentary.
It is not a surprise that the worst damage has been done to the lowest price tiers since that is where the mortgage rate affordability strain would be most keenly felt. The ability to service the new mortgage rates and higher prices than 2021 is a problem for the buyer. Mortgage repricing is also a potential problem for the seller of a low price home since that seller is potentially married to 3% or 4% handle mortgage rates.
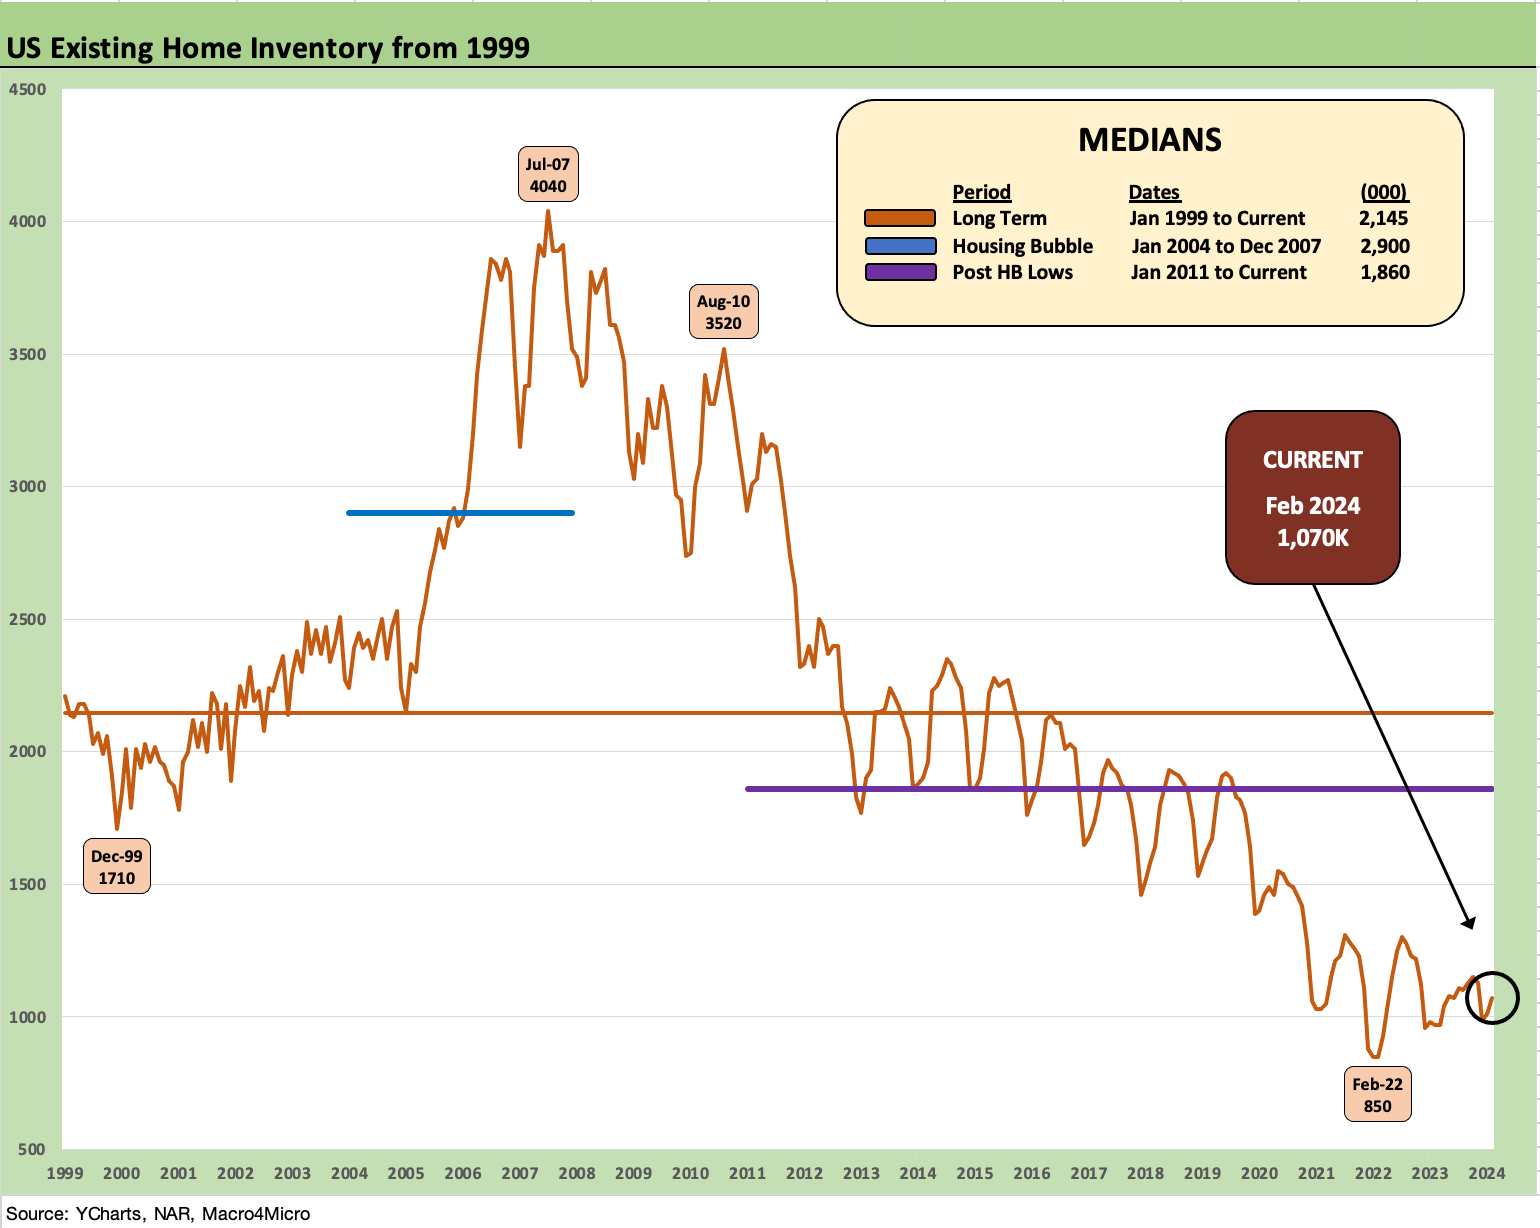
The above chart updates the ongoing struggle of the existing home sales inventory even if the 1.07 million level is well off the time series low of 850K back in Feb 2022 when a frenzy of post-COVID buying cleared out inventory and mortgage refinancing peaked over that period as well. The long-term inventory median is north of 2.1 million. That is a dramatic differential in this market with demand high and demographics unlikely to change that dynamic. Employment trends are also on the side of demand.
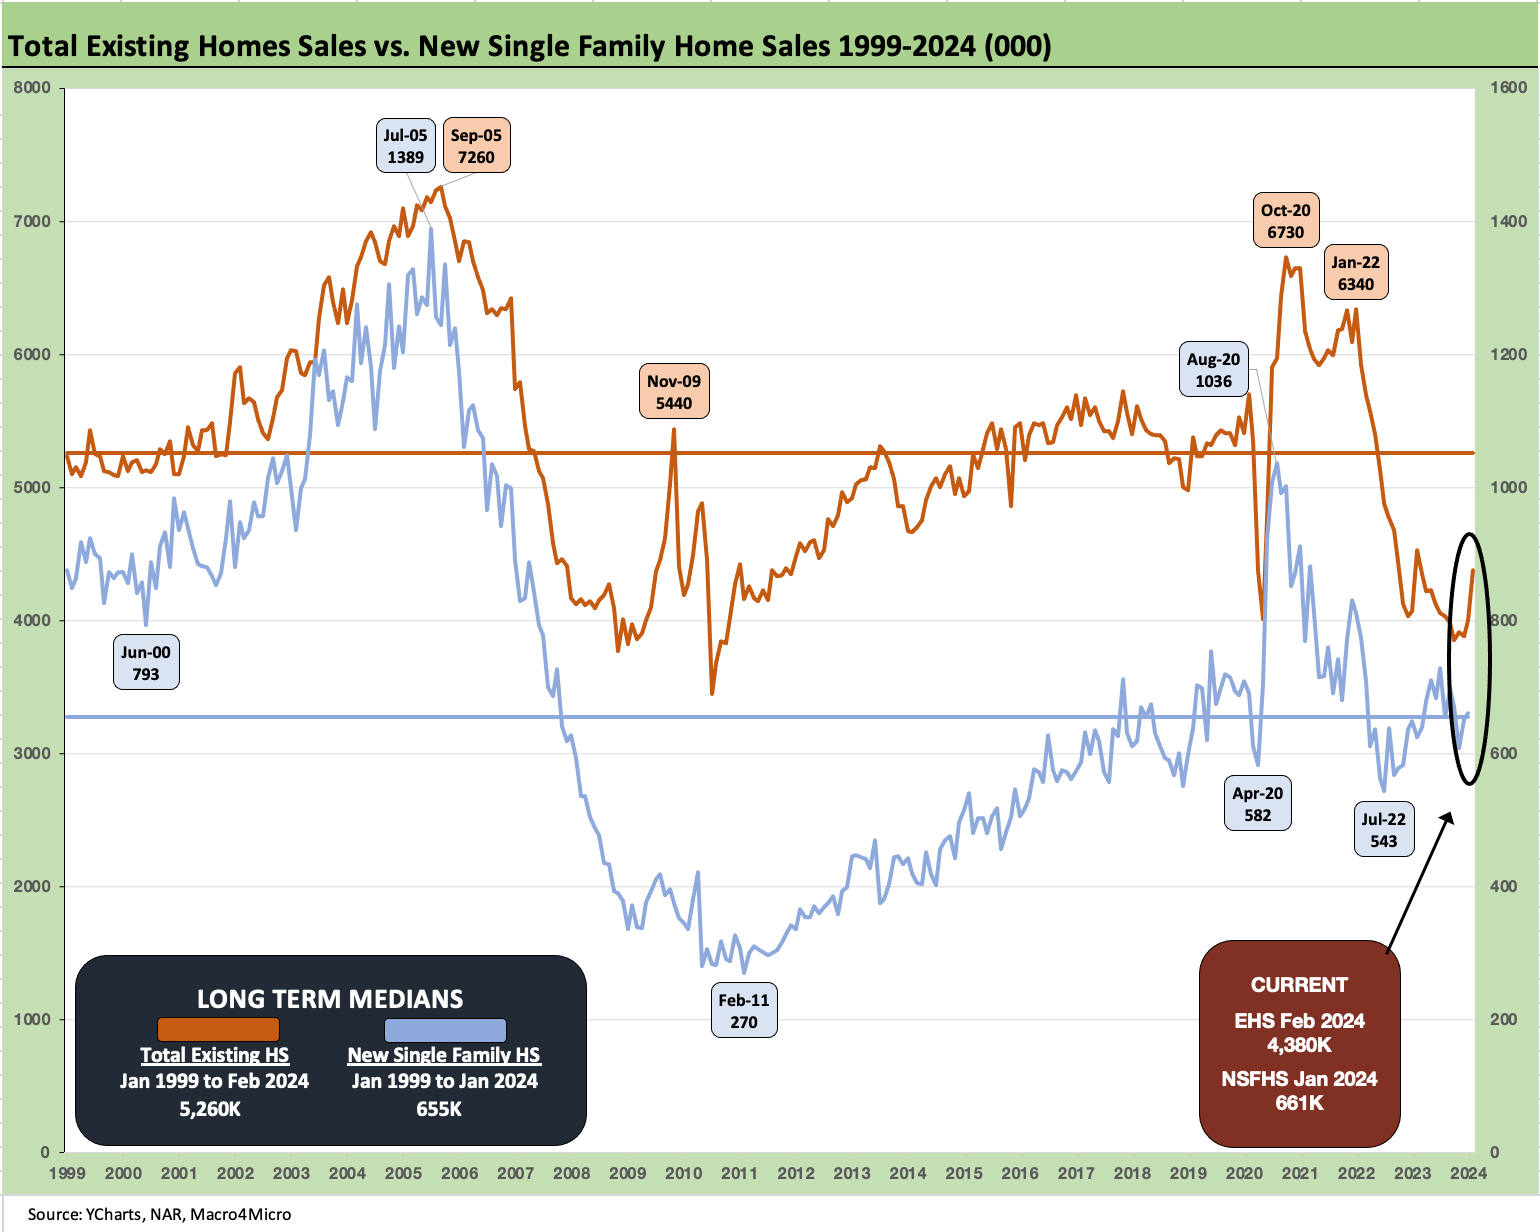
The above two-sided chart plots the existing home sales against new home sales volumes and frames them against long term medians. The homebuilders have been picking up share in this tightening cycle as we have covered routinely in our housing research and single name work. We get the final new home sales stats next week (Monday 3/25).
We see existing home sales of 4.38 million well below the long-term median (from Jan 1999) of 5.26 million. The mortgage rate shock vs. mortgage holder contract rates bring obstacles in terms of weaker affordability, but the new home sales level is still above the median despite the mortgage shock. The mortgage and fee incentives the builders can deploy as well as their ability to build their own inventory has been a blessing for the builders and their market performance.
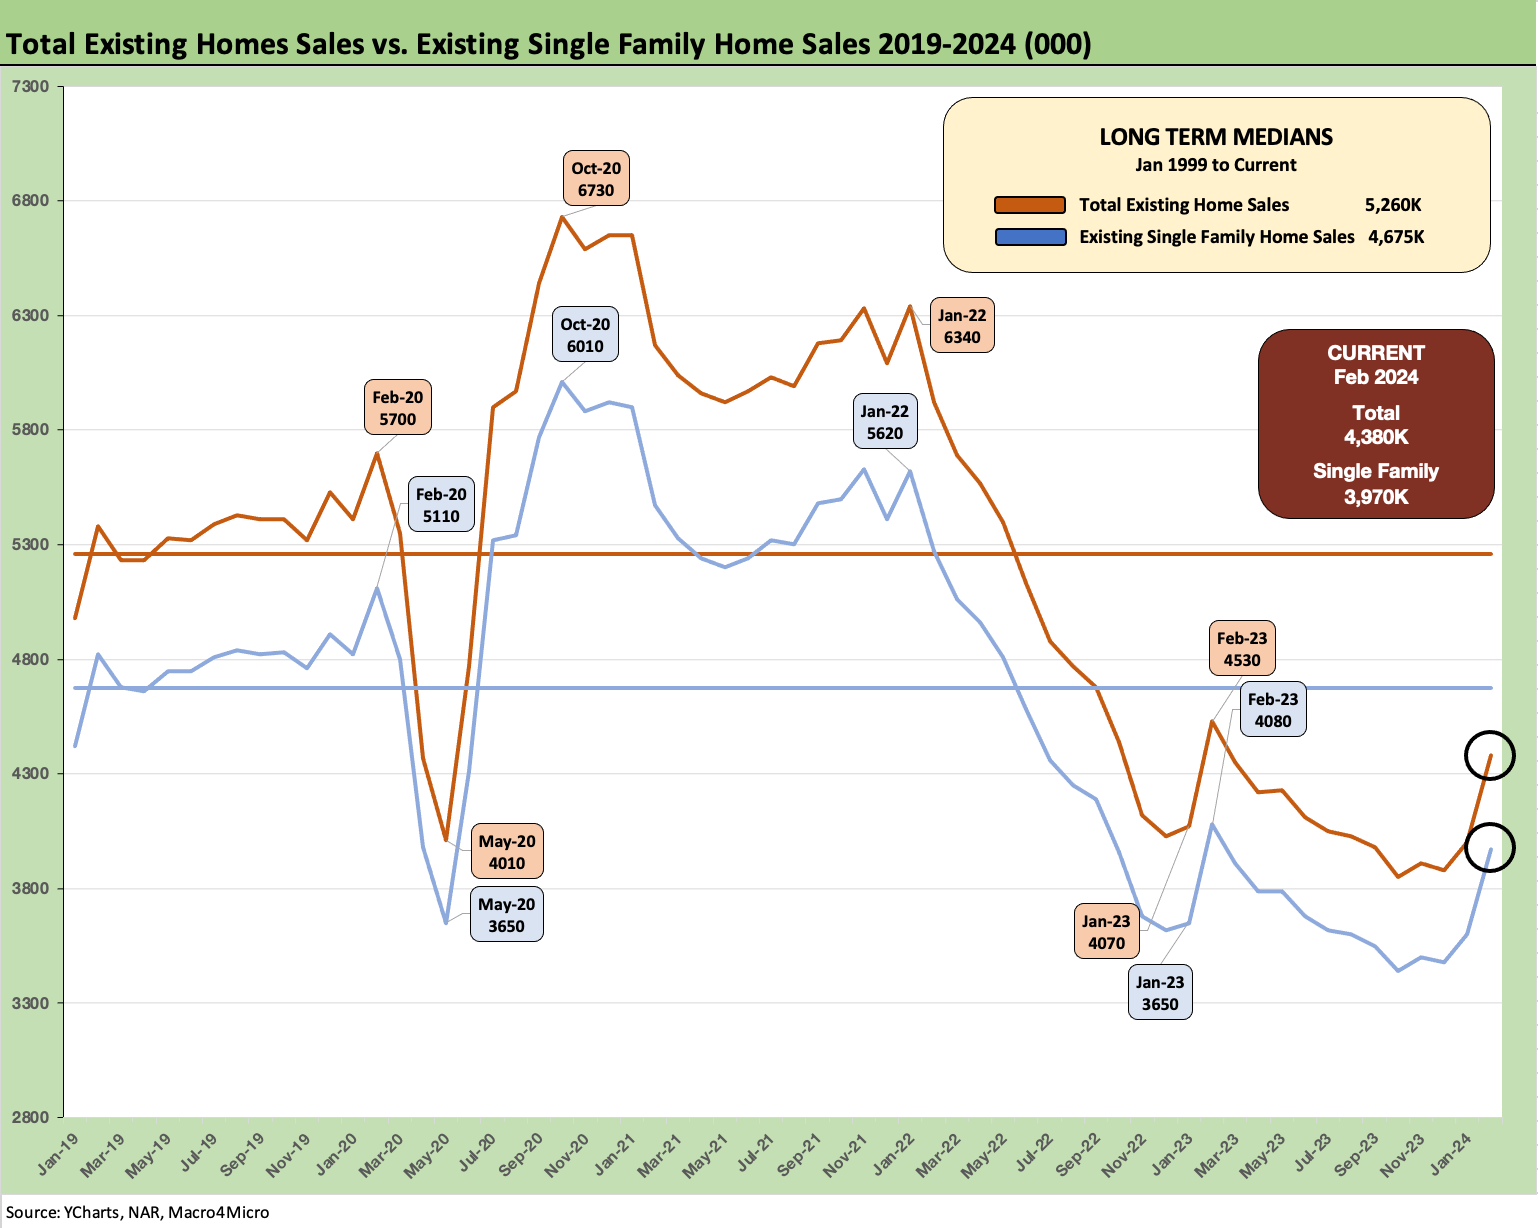
The above chart breaks out the timeline for single family alone vs. total existing. The lower line is ex-condo and co-ops. Total single family ex-condos/co-ops rose to 3.97 million sequentially from 3.6 million. We saw 410K in condos and co-ops, up from 400K in Jan 2024. The single family supply is running at 2.8 months and condo/co-ops at 3.9 months.
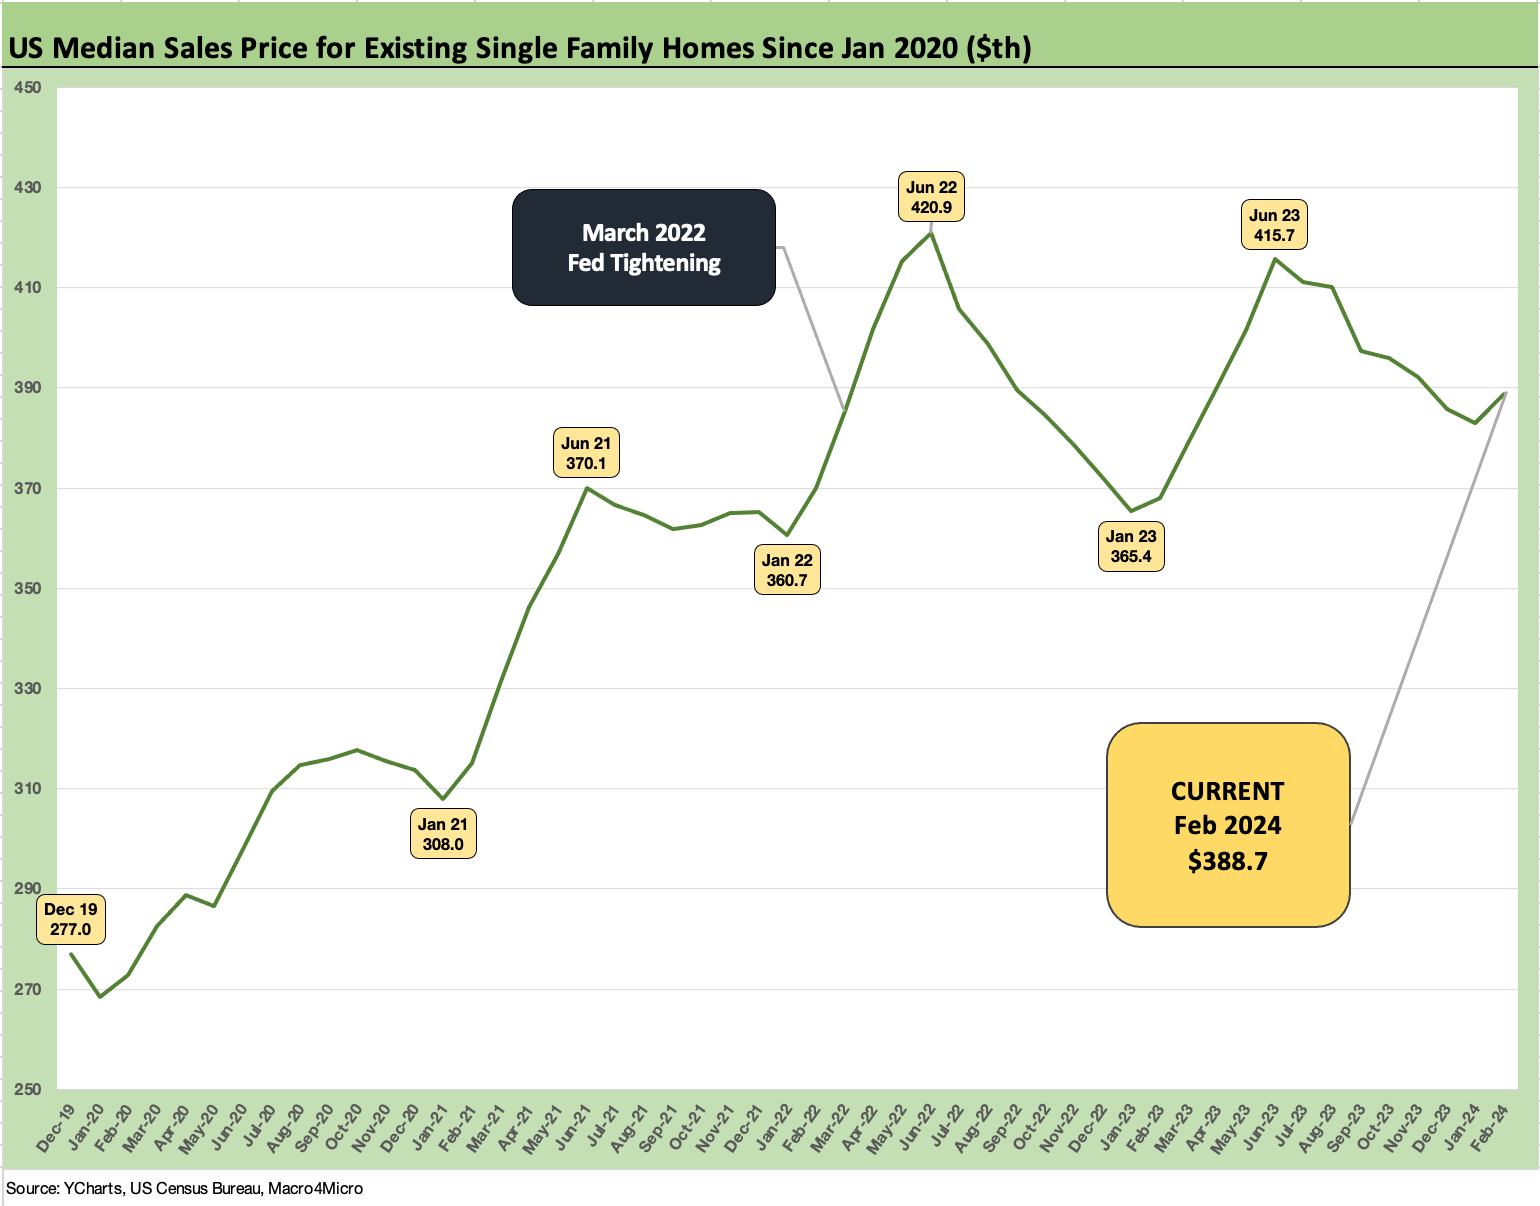
The above chart updates the single family median price trends, and that price tier remains well above early 2021 even if well down from the June 2022 peak and the lower peak seen in June 2023. These numbers always come with the asterisk of mix shifts by region (especially the high-cost West) and price tiers.
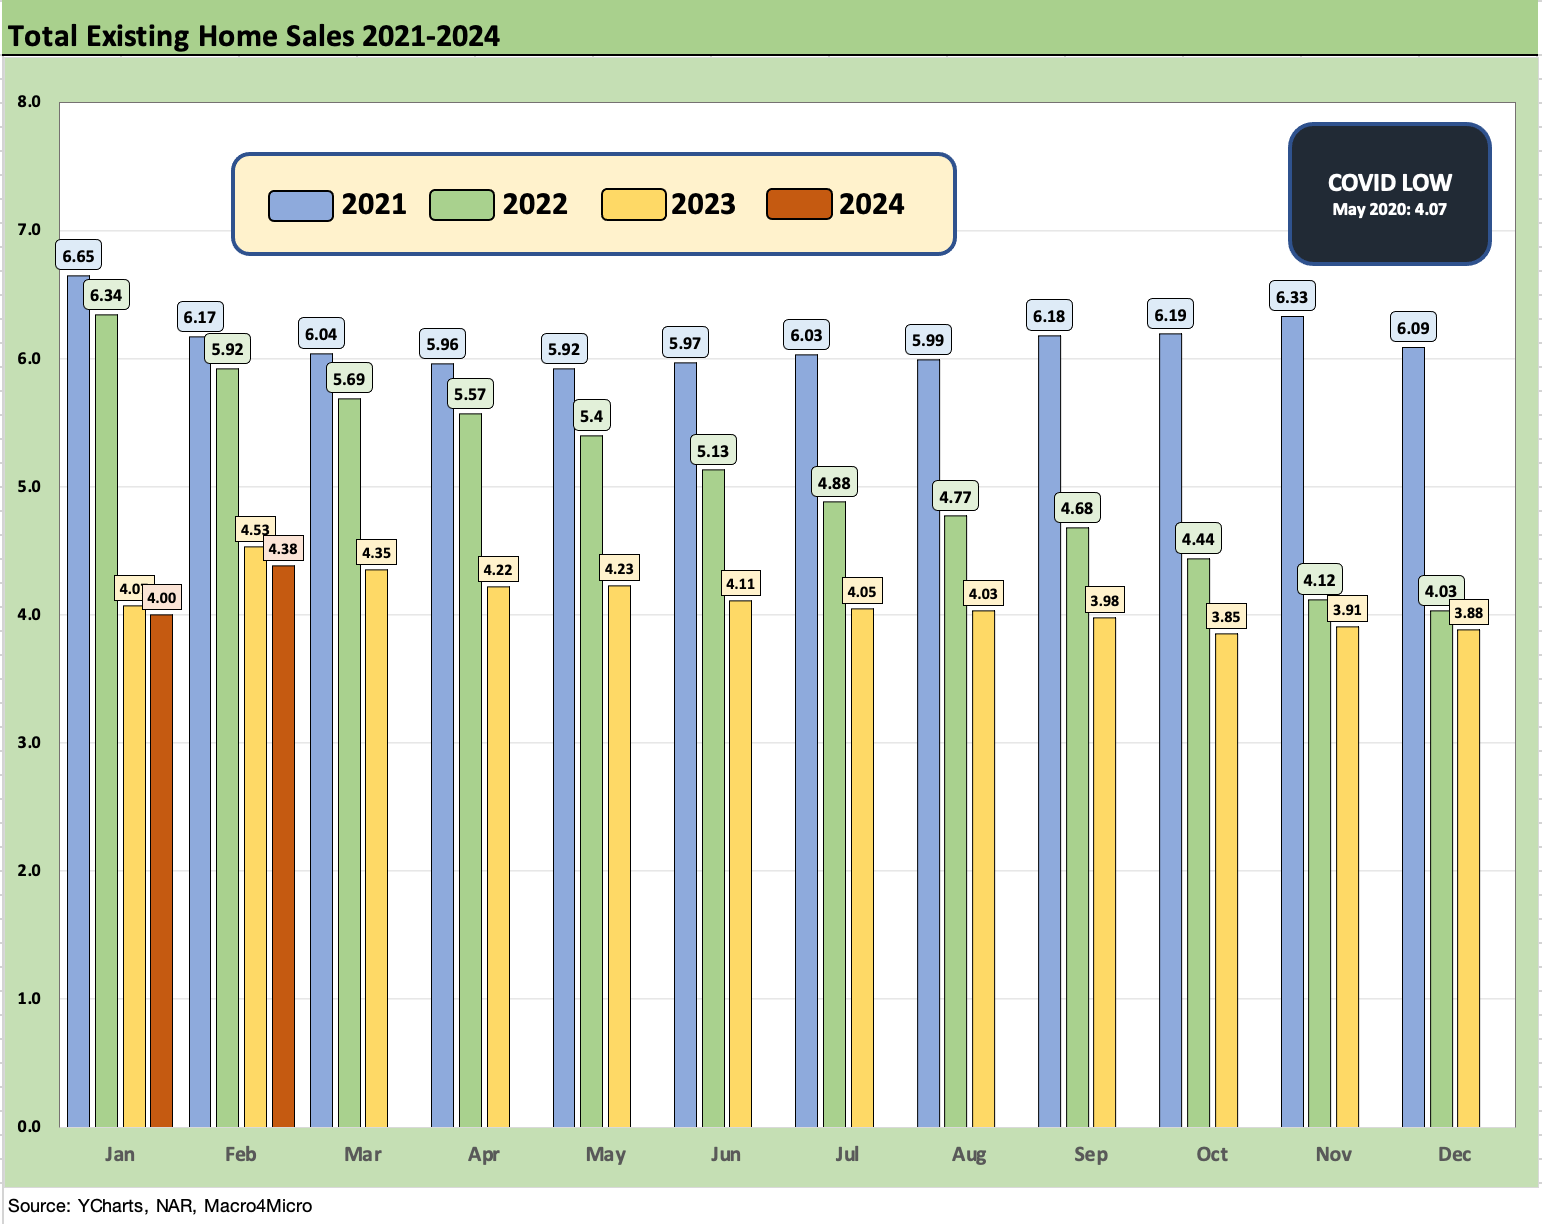
The above chart updates the total existing home sales counts since the start of Jan 2021, and it is clear the existing home sales market has a long way to go even if the Feb volumes are closing the gap with early 2023 volumes. The market is still well below the 5 and 6 handles of 2021-2022. The tightening cycle sent volumes below the 5 million mark by mid-2022.
The volumes of existing home sales are important economic indicators since there are a lot of economic multiplier effects that come with the sale, the move, the mortgage, etc. Existing homes sales deliver a lot less in economic multiplier effects than in new home construction, but it matters. It also offers a household vote on how the buyer sees the economy and their own personal situation.
There is no easy way to simplify since the transaction can be influenced by many different personal circumstances and a range of plans on what the seller might do on the other side (new home, rent, downsize, etc.). There are also the usual array of events that dictate volumes (death, divorce, relocation, job loss, winning lottery, etc.).
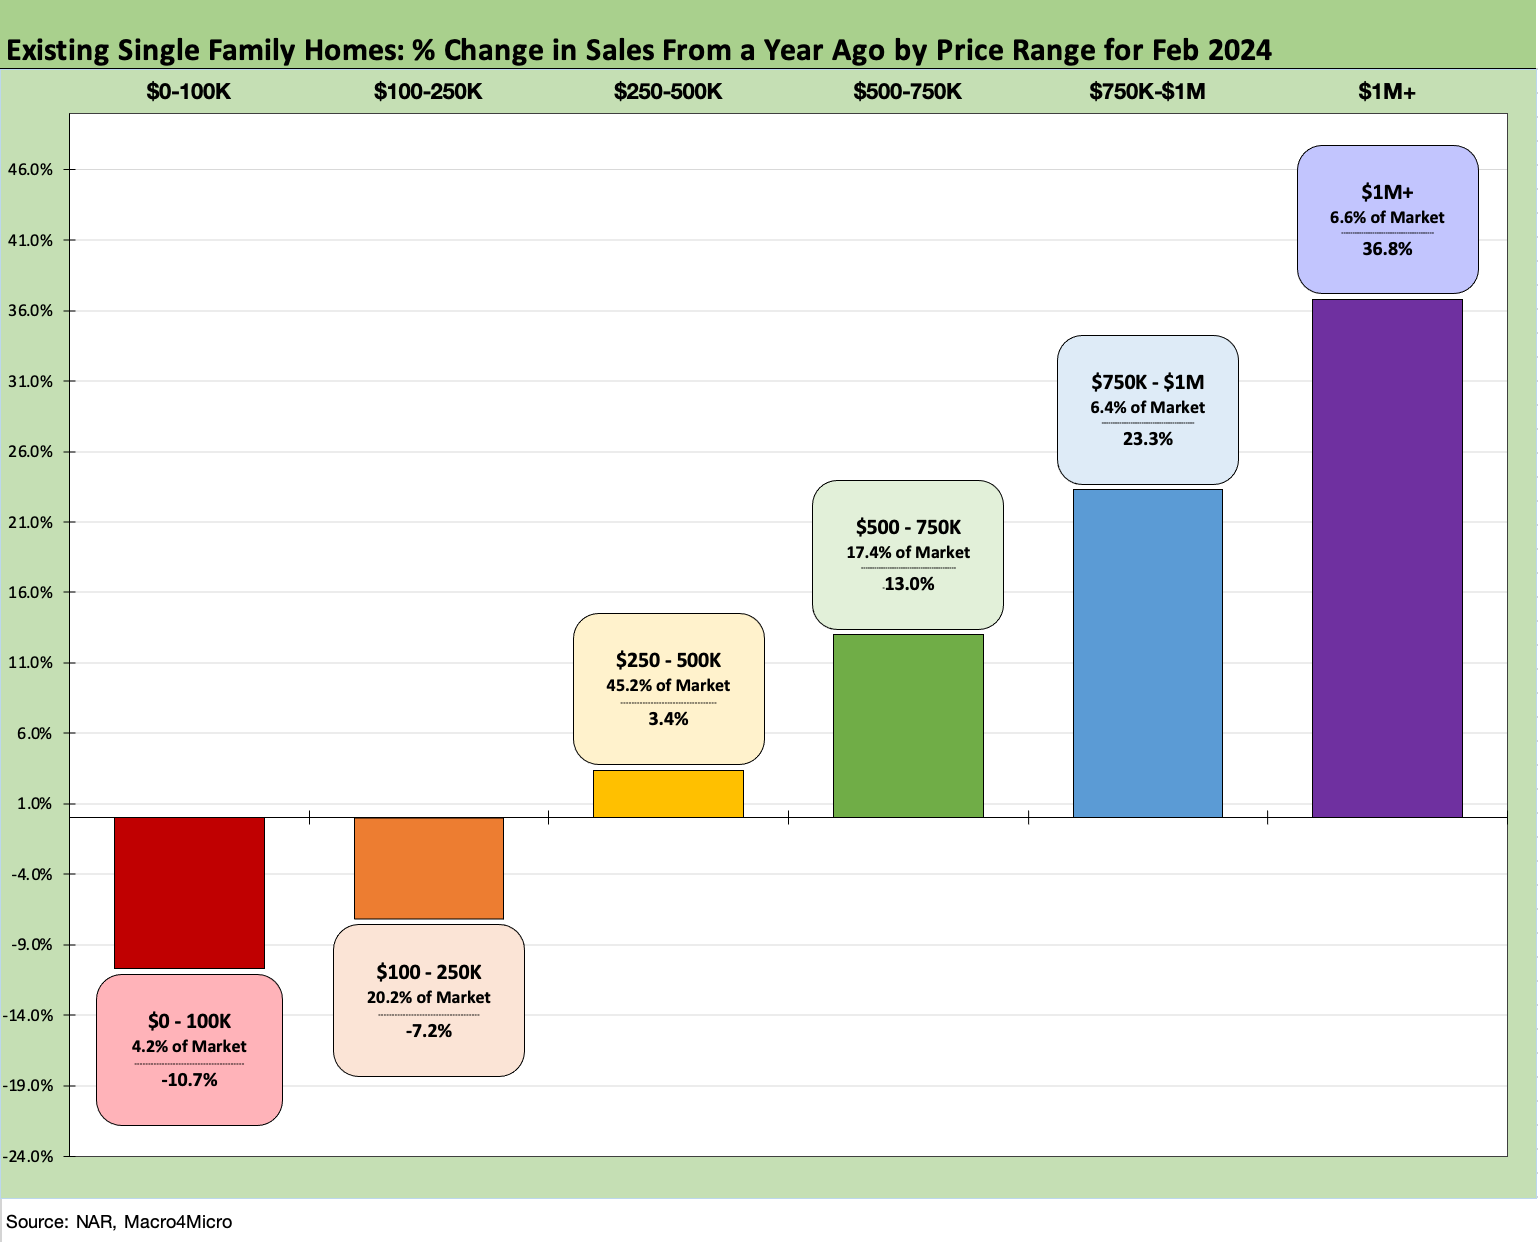
The above chart shows the trend line in sales increases for each price bucket. We post the market share held by each price tier in the chart. After a rough patch in sales declines in 2023, the comps get easier. We see a second straight month where the top 4 price tiers all rose with the bottom 2 tiers declining. We saw only the top 2 tiers rise in Dec and Nov 2023 after seeing all 6 tiers in negative range at the start of the fall season in Sept 2023.
Higher mortgage rates and impaired affordability naturally falls harder on the low-end price tiers with sellers facing a tighter set of golden handcuffs on the other side of the sale and the likelihood of fewer mortgage-eligible potential buyers. At some point, we could see more sellers on the low end moving to rent to take advantage of strong home equity. The “sell and rent” crowd is one of numerous subsets that are tailored to the individual level (retirement, empty nester, etc.)
The higher price crowd is well set in the chart above. The recent court decision and NAR settlement on commissions will improve the economics of the existing home sales market. That is not much of a question but that is a matter of low single digit % vs. price and does not move the needle that much. Every little bit helps the buyer and seller, but in the case of commissions hurts the broker.
See also:
Housing Starts Feb 2024: Rites of Spring on the Doorstep 3-19-24
Footnotes & Flashbacks: State of Yields 3-16-24
Employment: Real Numbers vs. Fictitious Dystopian Hellscape 3-9-24
Payroll Feb 2024: Records, Revisions, Reality 3-8-24
New Home Sales Jan 2024: Sales Steady, Prices Resilient but Softening 2-26-24
Existing Home Sales Jan 2024: High End Climbing, Low End Stagnant 2-22-24