
Housing Starts Feb 2024: Rites of Spring on the Doorstep
We look at a rebound month in Feb with permits, starts, units under construction, and completed units signaling a steady path ahead.

We look at new residential construction numbers as housing starts rebound off a weak patch in January with a sequential double-digit increase in total starts and single family for the US and +35.2% YoY for Feb single family.
Sequential trends in permits were more restrained relative to comparable periods in total and for single family but with multifamily permits down hard (-32.8%) for Feb 2024 YoY.
The builders continue to be creative in winning a larger share of the total sales volume vs. the constrained supply of existing home inventory as the tactical use of incentives and tag-teaming with captive mortgage operations gives major builders the edge.
Mortgage rates remain a headwind for affordability and the decision around “How much house can I buy for my dollar?”.
Demand and demographics still favor the builders over existing inventory in competing for a smaller universe of mortgage qualified buyers.

The above chart updates the long-term time series for single home family starts, and we see the current SAAR numbers of 1.13 million running above the long-term median and above the other time horizon medians highlighted in the chart. The one exception is the Jan 2000 to Dec 2008 period of the housing boom, bubble, and implosion. That period ahead of the credit crisis saw median single family starts reach a level above 1.3 million. The period of most rapid growth in volumes kicked into gear with 1.0% Fed funds to start 2004 across the peak homebuilding year of 2005 and the RMBS insanity of 2005-2006.
While affordability is impaired with monthly payments materially higher on an apples-to-apples basis on rates and high home prices, the demand side of the equation relative to availability has left builders in a good place (see links at the bottom) to capture share.
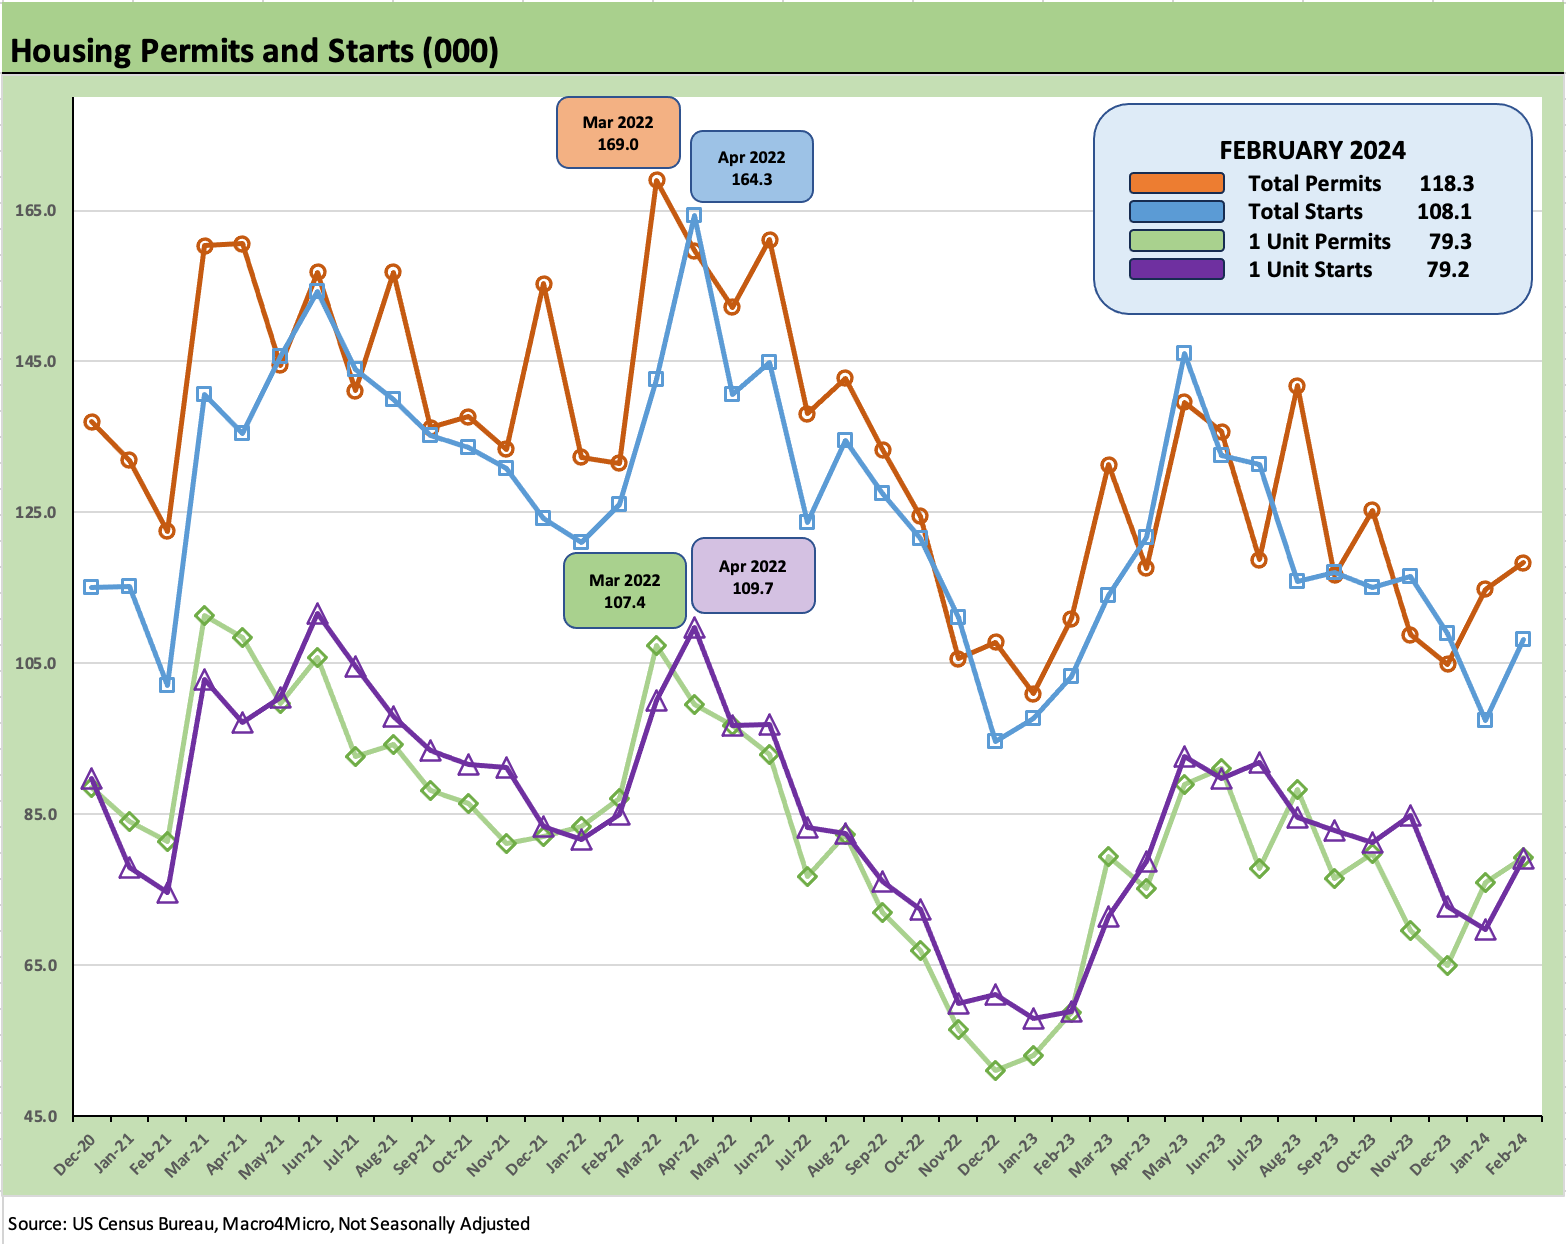
The above chart plots the “not seasonally adjusted” (“NSA”) levels for permits and starts to get closer to what the builders are seeing on the ground. Everything is aiming upward this month for total starts and permits, so the trend is easy enough to identify. We look at multifamily permits and starts alone further below in this commentary, but the totals above are dominated by the single family count. Sequential counts for total US and single family both moved higher on the month.
On a SAAR basis for permits, total permits were +1.9% higher sequentially and +2.4% YoY. For single family SAAR permits, we see +1.0% on a SAAR basis from Jan to Feb 2024 and +29.5% for permits YoY. That shows more optimism from the builders on what they will be doing this coming peak season with their spec builds and the mix of houses under construction whether specs or under contract.
Completed total housing units stood at +19.7% sequentially from Jan 2024 to Feb 2024 with single family completed at +20.2%. On a YoY basis, total completed was +9.6% and completed single family was +4.2%. For YoY completed, 3 of 4 regions were higher with only the West slightly lower. Taken in tandem with starts and permits, this signals optimism in our view.
The “houses under construction” total was off slightly sequentially from Jan to Feb at -0.5% while single family units under construction stood at +0.3%. For YoY, total under construction is -1.2% and single family -6.1%. Single family under construction YoY saw the South, the largest region by far, down -8.8% YoY for single family under construction at year end. The West region (#2 in size) single family under construction was -1.7% YoY, Midwest -6.2%, and the Northeast (smallest region) at -1.5%.

The above chart shows the single family starts by region on an NSA basis. The only region to tick down slightly for single family was the West on an NSA basis.

The last two charts focus on multifamily as starts jumped sequentially by +8.6% from Jan 2024 but is down sharply YoY by -35.9%. Multifamily starts on an NSA basis are up very slightly coming out of Jan 2024 to Feb 2024 but are well below the fall and summer. NSA multifamily starts YTD are down -34.0%.

The above chart plots the permits history on the path to the most recent 429K for Feb 2024, which was up sequentially by +2.4% but down by -32.8% YoY.
If we look at multifamily units under construction, those remain high at +2.4% YoY and -1.0% sequentially. The multifamily supply is still rolling in with units completed at +20.8% sequentially and +18.8% YoY. Dialing back YoY starts and permits in multifamily is consistent with all the recent trends.
See also:
Footnotes & Flashbacks: State of Yields 3-16-24
Employment: Real Numbers vs. Fictitious Dystopian Hellscape 3-9-24
Payroll Feb 2024: Records, Revisions, Reality 3-8-24
New Home Sales Jan 2024: Sales Steady, Prices Resilient but Softening 2-26-24
Existing Home Sales Jan 2024: High End Climbing, Low End Stagnant 2-22-24