
Dec 2023 Jobs: Not Feeling the Early Ease
We look in detail at the monthly payroll trends and across the occupational line items as Fed easing timelines get debated.


Jobs came in solid to wrap Dec and was nowhere near the lows of the year, but the payroll numbers did see material downward revisions for Oct and Nov.
The market saw 4% handle wage growth on a day when unfriendly Euro inflation news was being absorbed and factory goods data were solid in context.
For those with UST anxiety, ISM numbers were decidedly mixed vs. consensus but still just over the expansion line for Services, which for its part dominates the payroll mix as we look ahead trying to gauge where payroll declines could come from.
We detail the employment headcount deltas across the various occupation line items as Services and State/Local Government lead the pack with limited pockets of strength in Goods-producing sectors once again led by Construction with a heavy nonresidential flavor.
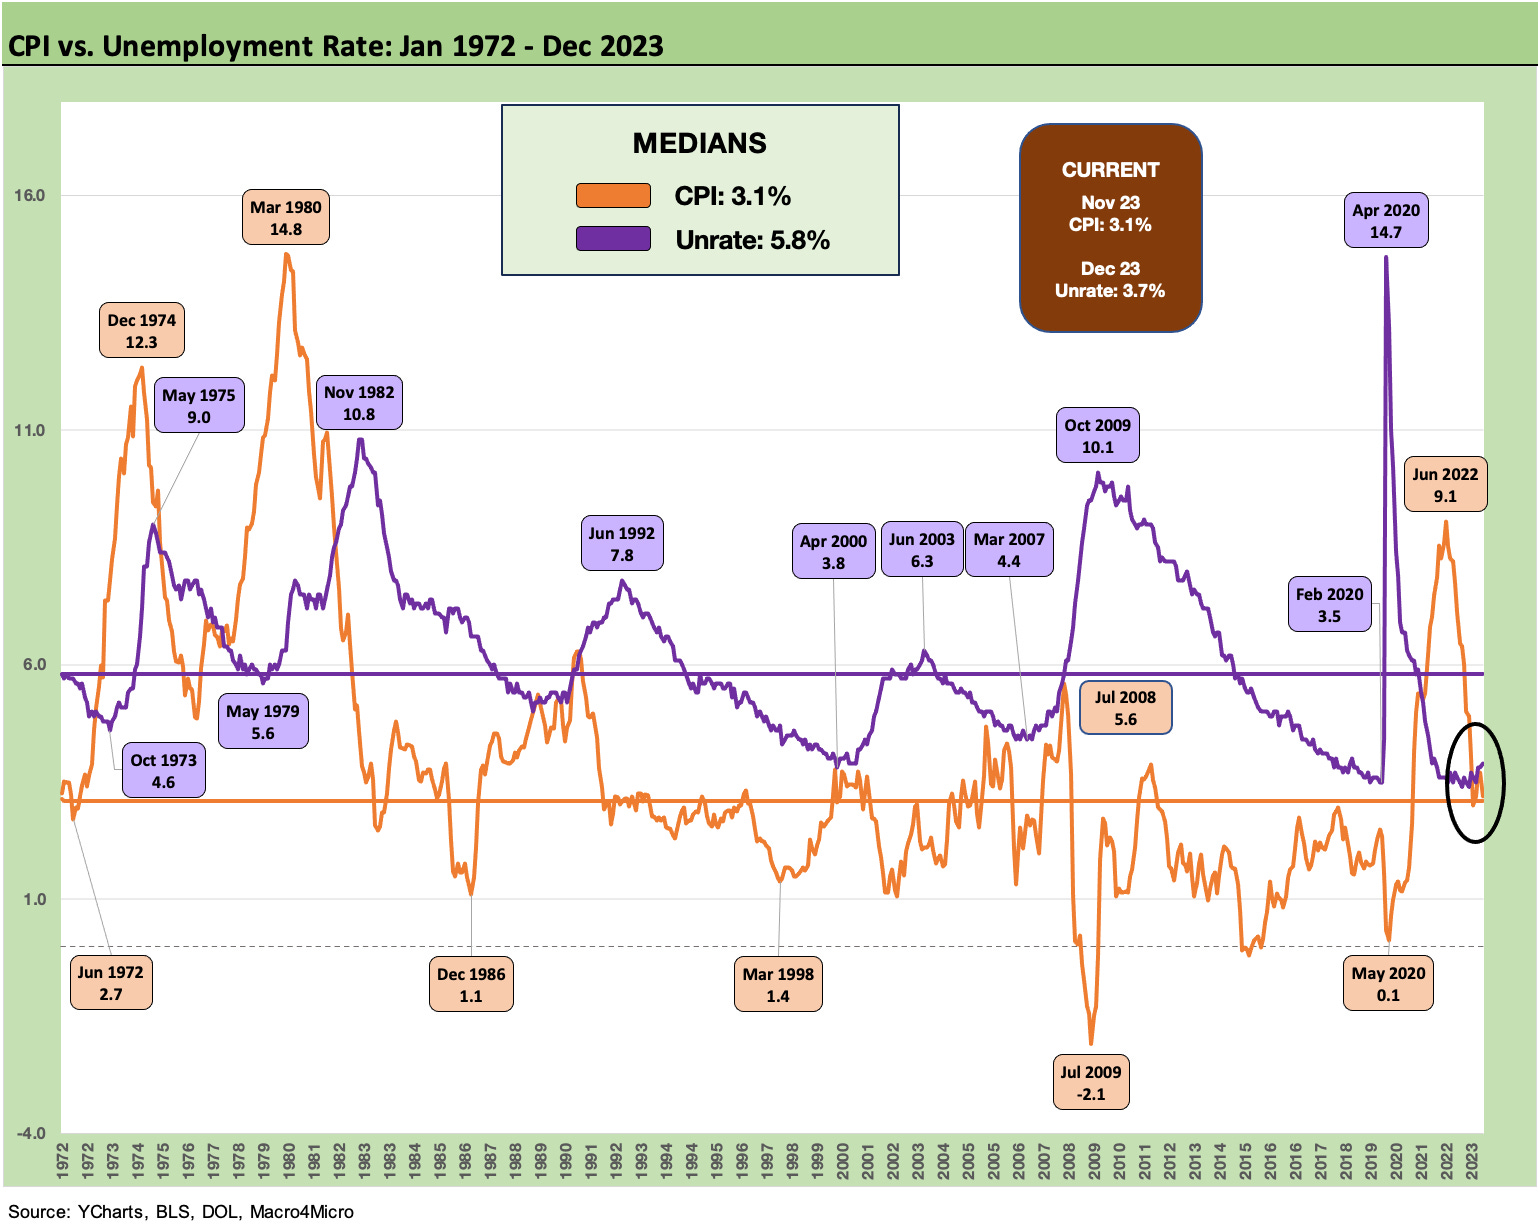
The linkage of jobs and inflation is Econ 101 even if the academic crowd and policy wonks keep changing their minds on the nature of the relationship and scrapping rules of thumb over the decades. We update the CPI vs. Unemployment rate above with the unemployment rate unchanged for the month at 3.7% and the next CPI set for release next week.
As noted in the chart, the median unemployment rate over the decades since early in the stagflation-heavy 1973 to 1982 period was 5.8% while the CPI median was 3.1%. The headline CPI for Nov 2023 was 3.1% with Core CPI at 4.0% (see November CPI: The Big 5 Buckets and Add-Ons 12-12-23), so the upcoming round of numbers will be a swing factor around those median levels. Then we sit tight and wait for PCE at month end.
Nonfarm payroll had a lot of company today in economic releases…
Earlier this week, we had Goldilocks kicking back at the spa working two cucumber slices on her eyes along with a facial mask (see JOLTS Nov 2023: Let the Games Begin 1-3-24). The jobs data is not going to get much of a rise out of Goldi given the mix of the other releases. Most notably, the ISM Services decline was down over 2 points sequentially to 50.6. In addition, the downward revision of Oct 2023 payroll released today presented a material adjustment back to near calendar year lows. That helps ease some of the “too hot” fears.
The payroll numbers in Dec were stronger than Nov and Oct (see Nov 2023 Jobs: A Sad Story of More People Working 12-8-23) with Oct revised all the way down to the June 2023 lows of around 105K. The Employment index in the ISM Services release was all the way down to 43.3, which is in contraction range. The same is true for a sub-50 metric in new orders for Services at 49.4 (ticked up sequentially). With Services being such a dominant factor in the payroll mix, that gives the UST bulls something to latch onto even if they were looking for weak payroll numbers in Dec.
On the other hand of the economist octopus (“on the other hand” N+1), we saw positive new factory orders of +2.6% in November after -3.4% (revised) in Oct. Durables Goods was not too shabby at +5.4% on a SAAR basis with Transportation driving the bus (or more specifically the nondefense aircraft and parts). The manufacturing sector remains under a cloud with such a steady streak of weak ISM Manufacturing numbers and mixed Industrial Production numbers. The softer side of manufacturing has been a mainstay in the Goldilocks call for “balance” since it is not rallying but also not falling out of bed.
We have a natural bias toward jobs in our views on economic growth given how the consumer flows into the GDP lines (typically ~68% or so of GDP) and given its influence on consumer spending habits (and paying bills on time for consumer credit quality). We interpret the Friday release series today from jobs to ISM to factory goods as overall a pushback on the super UST bulls for March easing. As usual, the next stop is CPI and PPI next week.
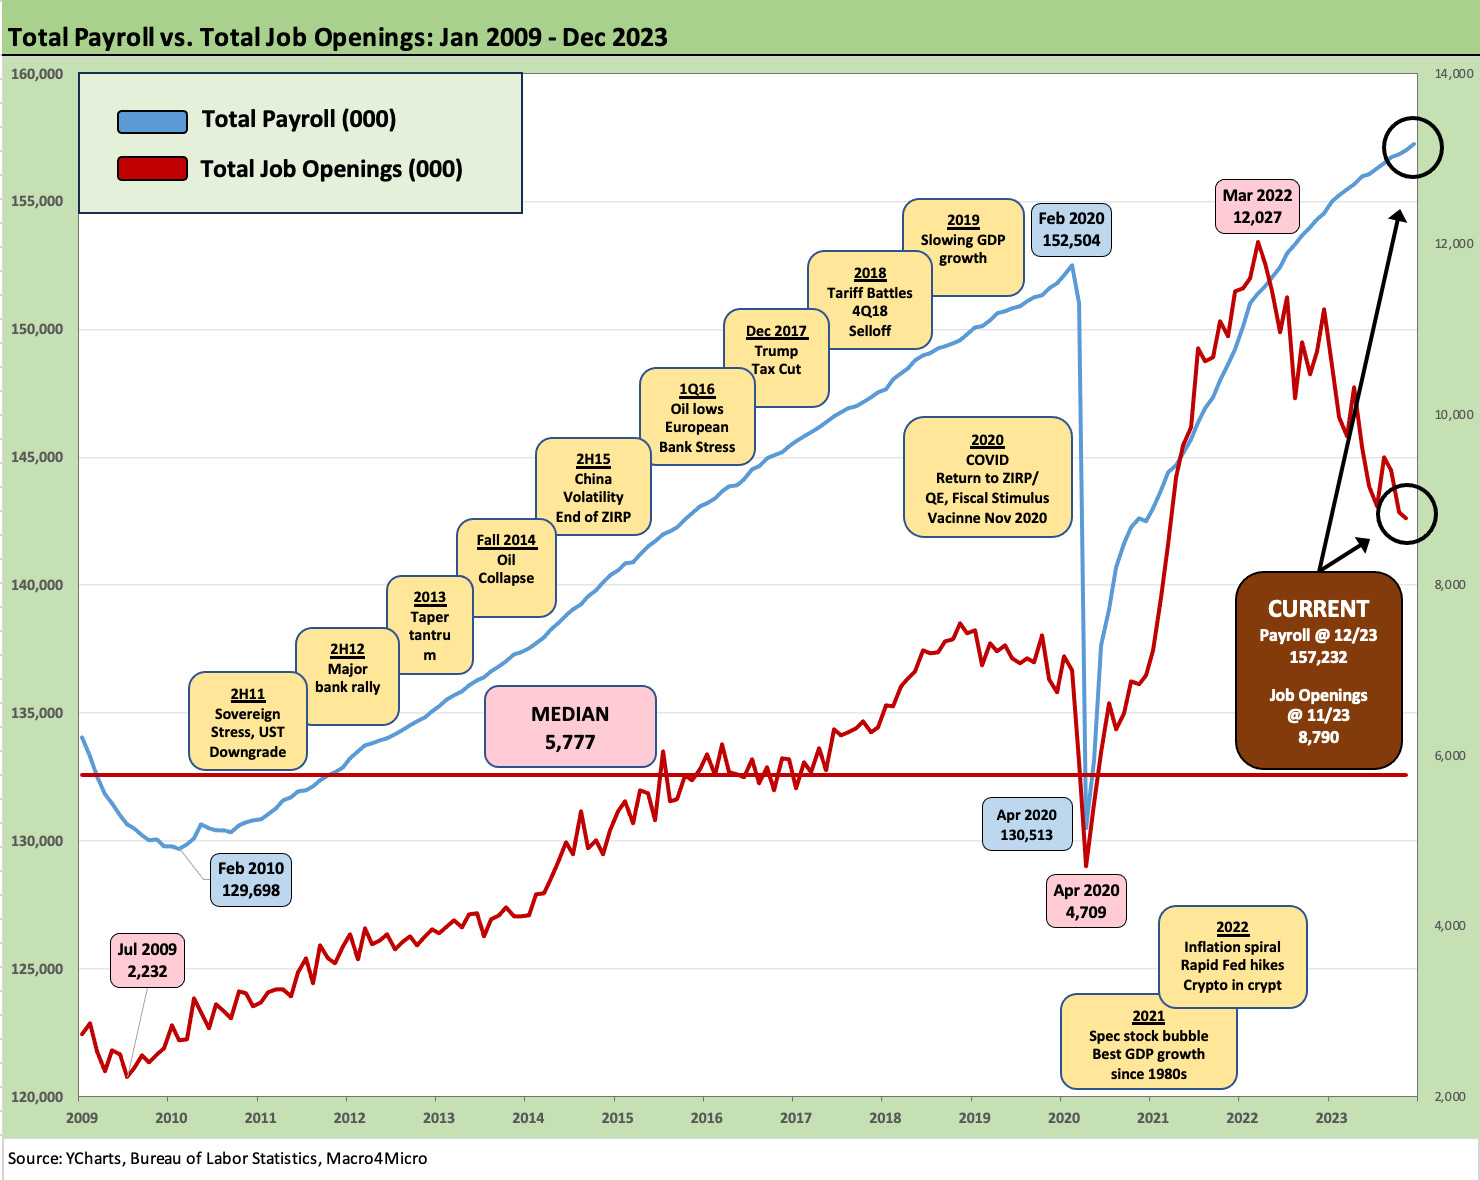
The above chart updates total payroll vs. job opening trends since Jan 2009 during the crisis. A record high payroll count is a fact even if what direction it will head is a forecast. As we covered in our JOLTS piece this week, job openings are sliding along with hiring and layoffs and quits, so there is a lot of room left to debate the cyclical peak.
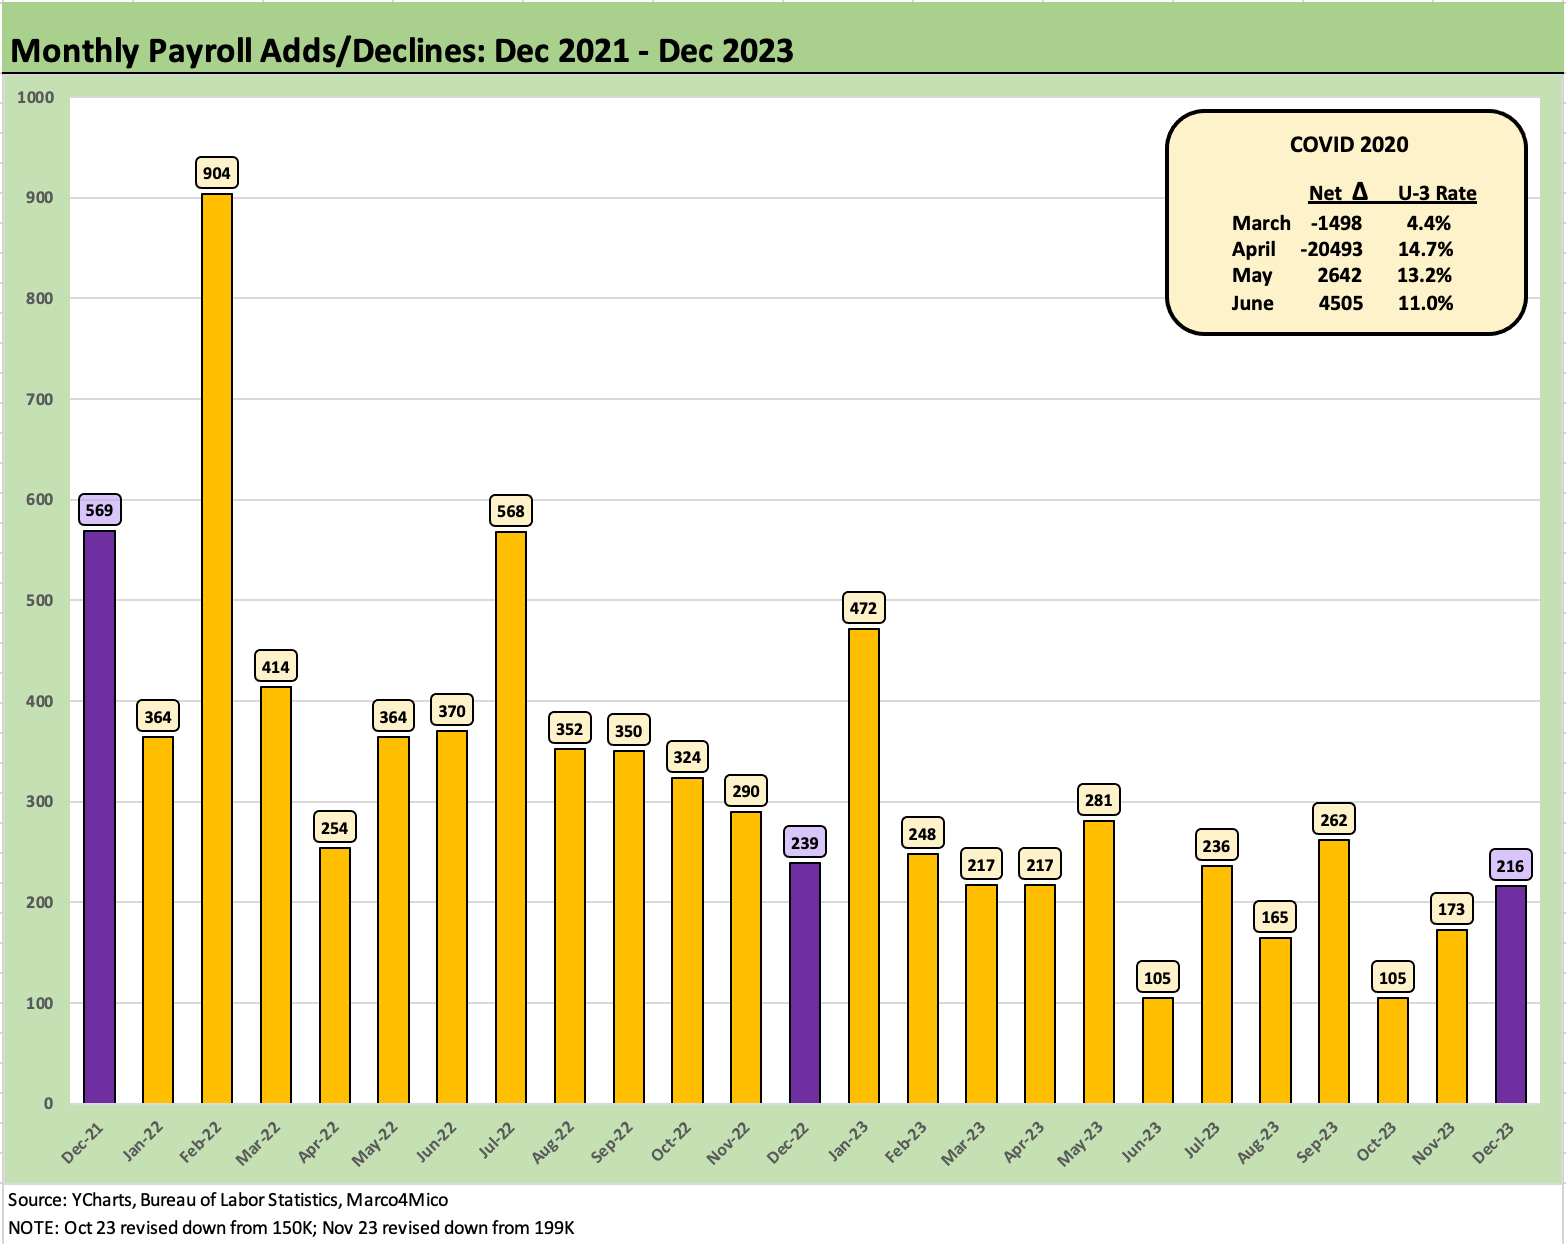
The above chart updates the monthly payroll adds over the past two years. We see 4 months lower this year and two months (Jan-Feb) right on top of Dec 2023 payroll adds. The market is running lower in 2023 but still ahead of demographic minimum needs.

The above chart updates the MoM growth trend that shows a steady streak of positive job adds. That will get swept up in politics this year as one side seeks to turn the above smile upside down and detail their own version of a case study in job destruction. Facts matter. For some.

The above chart plots the unemployment rate from the credit crisis to current times for the unemployment rate vs. net changes in job adds. We remove the COVID distortion to avoid impairing the visual and include those wilder months in the box in the chart. The median monthly job adds from Jan 2009 was +213K, so Dec 2023 was slightly above median.
The median unemployment rate during this time horizon was +5.4%, and we remain well below that level. There was a time not too long ago (1990s) when a 5% area rate was considered full employment and 4% a certainty of inflation. As we have covered in past pieces, those FOMC member models did not do so well in years such as the late 1990s.
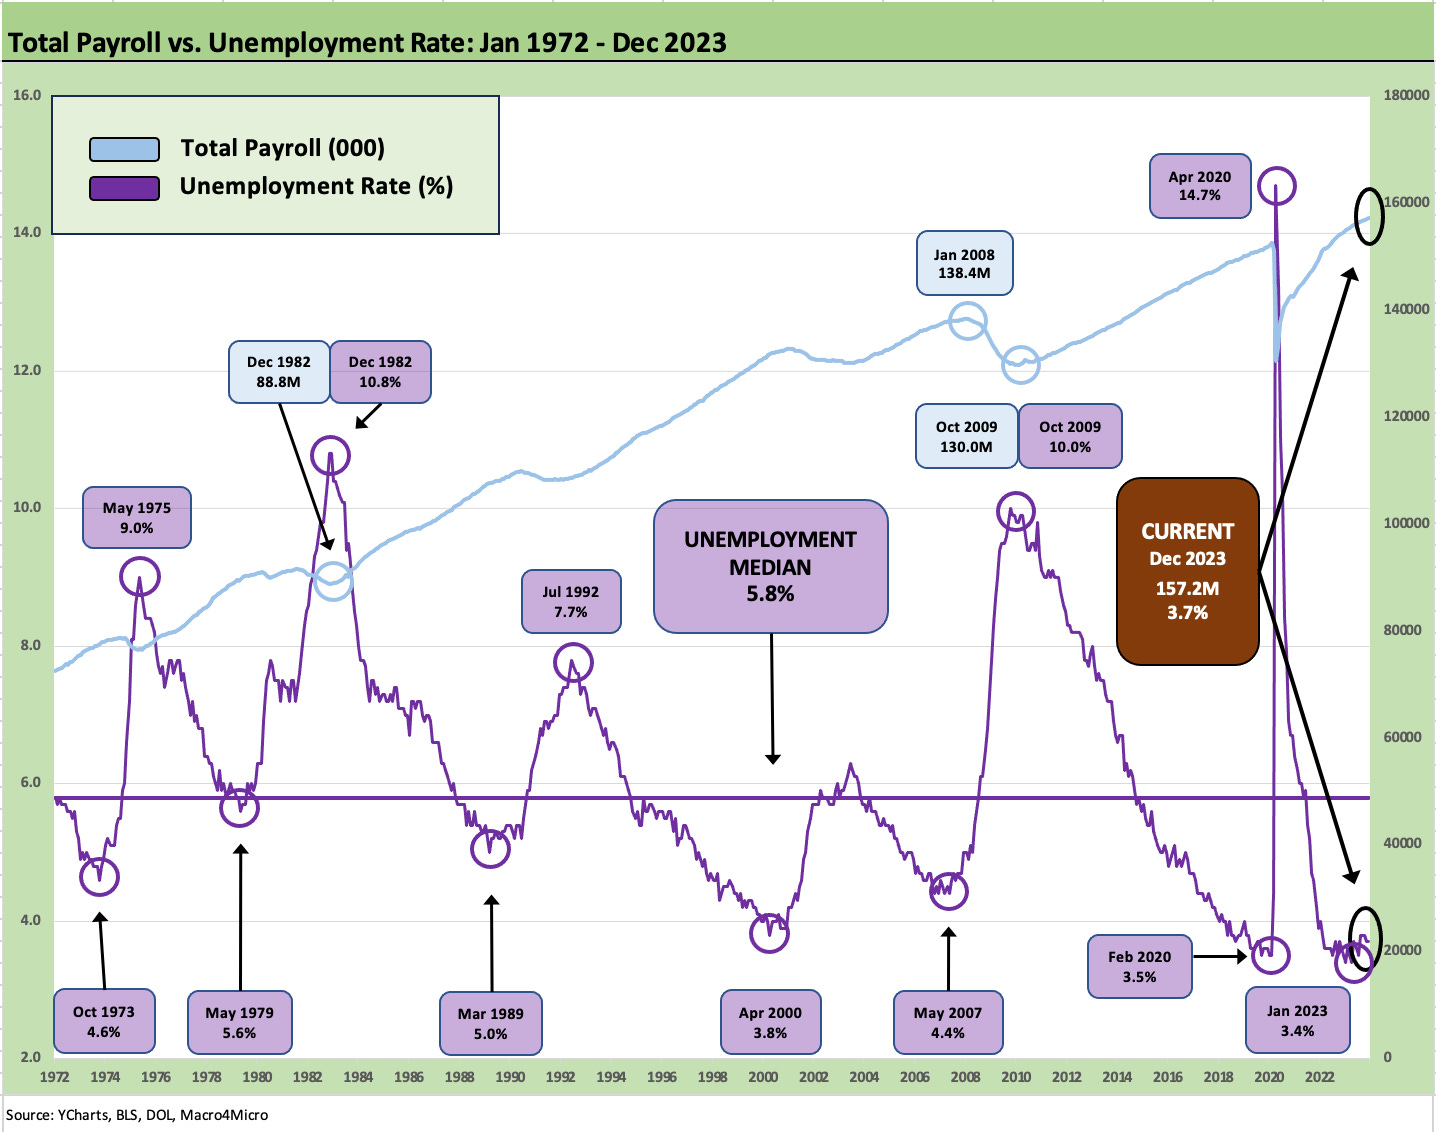
The above chart updates the payroll headcount vs. unemployment rate from another angle. The unemployment rate can move around with the labor force denominator, but counting heads still indicates the market is at a record and above those periods where we saw record lows on the unemployment rates.
Drilling into the Occupations
In the next series of charts, we detail the occupational trends in payroll mix. We run through the payroll deltas over various time horizons. Forgive us for including in some charts both the YTD and LTM columns (they are the same) since it made life and wrapping this piece to post on a timely basis much easier!

The above chart updates the running occupational payroll deltas since just before COVID vs. today. Over 5 million jobs have been added on a net basis and the chart shows the breakdowns. The chart shows which occupations forged ahead and which are struggling to get back to the start of 2020. In some cases, the underlying drivers are cyclical and some secular.
After a few years of intensive hiring broadly, the low numbers in manufacturing raise some questions around when exactly that “manufacturing renaissance” is supposed to begin. Every President since 2000 has highlighted it, so it is not a partisan issue. It is a bipartisan failure tied to many years of secular trends (automation and global supply chains), cyclical downsizing, and demographics and skill issues.
We would highlight Construction as well as Transportation and Warehousing as success stories in expansion and investment. The former reflects a favorable policy outcome of recent years (see Construction Spending: Timing is Everything 12-1-23 ). Transportation and Warehousing get into the question of supplier chain and efficiency but also where those goods originated on the way to their destination (China? Mexico?), etc.
One of the most painful experiences of 2024 might be watching a debate between Biden and Trump on the topic of trade policy. Trump might still be saying he collected billions from China (maybe he collected a lot at his hotels, but not in tariffs since the buyer pays). Meanwhile, I have no idea what Biden thinks of tariff economics. He just knows he wants union jobs and seldom speaks on the topic as he kept the Trump tariffs rolling. Union jobs are around 6% of private sector payrolls, so he has a long way to go.

The above chart breaks out the additions to payroll by occupation in the Dec 2023 job increases totaling 216K. As always, services dominate. A recent anomaly has been the high rate of adds in government payroll on the back of state and local. The remainder of the top 5 are the usual suspects. Construction remains a standout in 2023.
Payroll mix: into the weeds
The following charts get more granular in the delta details with the LTM and post-Jan 2020 numbers being the most interesting part of the charts to us.
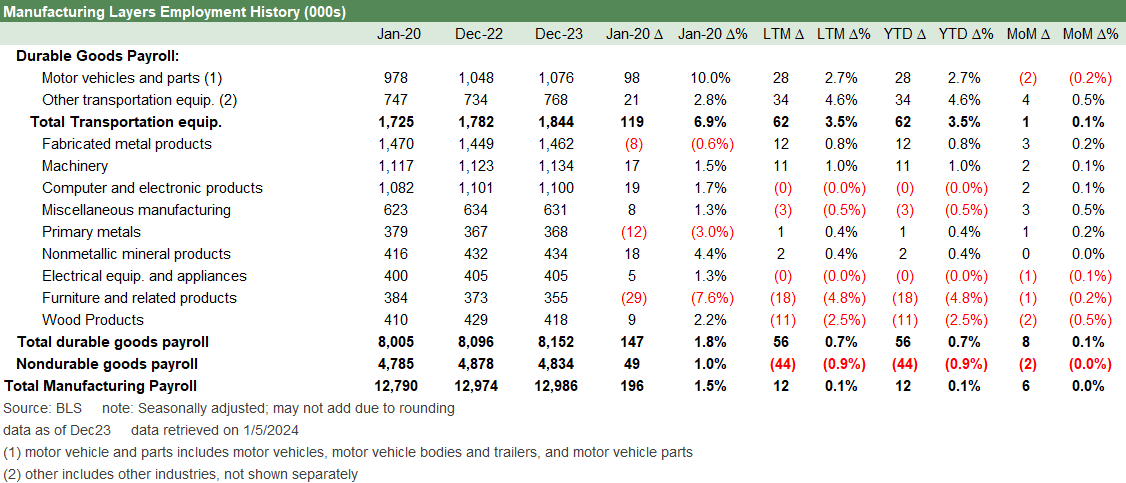
The manufacturing jobs detailed above show the line items for durables, as well as the totals for nondurables and total manufacturing. We see total manufacturing at only +12K LTM on the back of durables growth of +56K offset by -44K in nondurables. The durables are dominated by transportation LTM at +62K.

The above chart covers Construction as part of the Goods-producing section of the monthly payrolls from outside the manufacturing bucket. This has been a major part of the recovery story as we covered in other research (see Construction: Project Economics Drive Nonresidential 10-2-23). We see 197K jobs added in 2023 and 476K since the start of 2020. The line has benefited from policy initiatives that tag team private and public sector investment.

The above chart frames the always pressured nondurable payroll lines with only 49K jobs added since Jan 2020 and down by -44K for the LTM period. The secular headwinds for these line items have been covered in the past and almost explain themselves (printing, paper, and support activities in the internet age, textile and apparel with low cost country/labor outsourcing). For its part, chemicals as a subsector plays to the US advantage of low cost natural gas feedstocks and inherent infrastructure advantages.

In a services economy, this list drives the employment trends. We see 1.8 million jobs added during 2023 and 4.3 million since Jan 2020. Some growth lines are driven by consumer habits (Leisure and Hospitality), some by demographics (Health Care and Social Assistance), and some by economic needs across a wide range of core businesses (Professional and Technical, Admin. Waste etc.). Transport and Warehousing combine all of those factors and reflect global trade patterns as well. Amazon would be the poster child for that sector’s growth given how ecommerce has evolved and the related freight and logistics needs.

Last but not least, we see the trend line in government payrolls with +672K added LTM and +220K since Jan 2020. We should highlight that over 86% of the payroll adds LTM are state and local as many replenished their ranks after the COVID damage.
Looking back from Jan 2020, we see +109K at the Federal level or less than 0.5% of the government payroll adds. So, when we hear about government purges of the Federal civil service, that is more about irrational bloodlust and fake tough talk than it is about economics. It is the 6th grade bully looking for second graders to knock down. It fits the profile of some attendees wandering around the idiot convention in Washington.
Glenn Reynolds, CFA glenn@macro4micro.com
Kevin Chun, CFA kevin@macro4micro.com