
Footnotes & Flashbacks: Asset Returns 3-24-24
The week was almost a shutout win for our peer group of 31 ETFs/benchmarks at 29-2 on the back of a Fed “serenity now” moment.


A broad rally came with a good tone set by the FOMC dot plot and some constructive indicators as the market gears up this week for another PCE inflation report and its look into consumer sector income and outlays.
A UST rally offered some relief to bonds while HY cruised back through the early Oct 2018 cyclical spread lows as the market awaits more refinancing and current coupon bonds to bolster income flows.
The housing sector continued to hang in well at the macro and micro level this past week with the spring selling season ready to set the tone for more than a few consumer subsectors (homebuilding, autos, travel bookings) that will tell a story ahead of the next round of “speechifying” by “Fed-heads” on how they see the “3 vs. 2 cuts” issue working out.

The above chart updates the main debt and equity benchmarks we track for a high angle view on bonds vs. stocks. It is not news that equities have been running well after the 2022 tightening cycle and inflation smackdown on risk, and equity returns look especially strong over the trailing 3 months, 6 months and 1 year.
The running 1-month time horizon was also solid for equities, and the broader mix of stocks have been showing better breadth to wrap 2023 and into the YTD period as covered below in our usual review of 31 ETFs and benchmarks.
Fixed income has struggled in 2024, however, on the adverse UST shift after a very strong finish to 2023 following the peak rates of later October. We review the yield and UST trends in our separate “Footnotes” publication on the State of Yields.
Credit risk and shorter duration have been the winner with muted returns in 2024. The past month at least pulled UST returns into the black after the rolling 1-month return was negative in last week’s edition. The UST index return remains negative for 3 months.

The above chart updates our 1500 and 3000 series, and the sequential moves for the trailing 1-month were all favorable even if Real Estate continues to struggle badly. We see Growth, Financials, and Industrials all in double digits for 3 months with a cluster in the 10% and 11% handle return range and Energy just below the 10% line. Value is posting up good 3-month and 6-month numbers while Real Estate keeps on struggling in 2024 after a very strong rally to end 2023 (see Footnotes & Flashbacks: Asset Returns 1-1-24 ).
The rolling return visual
In the next section we get into the details of the 31 ETFs and benchmarks for trailing periods. The collection of four time horizon charts below had broken with recent Footnotes publications with the negative return side of the scoresheet exceeding the positive side for the prior week. This week we see a big rebound off the FOMC quarterly dot plot and Powell’s semi-pep talk.
As more weeks tick off in 2024, we see more of the bull run to end 2023 start to give way to more measurement periods that include adverse UST moves hurting duration. We also see some limited but important negative news flow in such major areas as trade conflict potential, EV setbacks, regional bank anxiety, and the N+1 headline news flow on asset quality weakness in commercial real estate.

The above chart shows a sharp shift in mix for the past 1-week period in the shape of the positive vs. negative. For the 1-week period, we see the past week post up 29 positive and 2 negative in the mix. That comes after the prior week slipped for a rare setback of late with 9 positive and 22 negative in total returns for the worst week since the start of January (the mix was 6-25 in week #1 of 2024).
The market has been on a solid streak in much of Feb and early March. For those keeping score at home, the 7 weeks before these past two weeks rang up a winning streak of 25-6, 23-8, 29-2, 16-15, 18-13, 21-10 and 26-5. Equities carried the ball on the sheer numbers of equity ETFs in the mix in a bull market.
The bond side of the ledger has been weak on the UST curve shift during 2024 with 4 of the 6 bond ETFs we track in the red for the trailing 3 months and only HY Bond ETF (HYG) and Emerging Market Bond ETF (EMB) modestly positive.
The Magnificent 7 heavy ETFs…
Some of the benchmarks and industry ETFs we include evidence issuer concentration elements that leave them wagged by a few names. When looking across some of the bellwether industry/subsector ETFs in the rankings, it is good to keep in mind which narrow ETFs (vs. broad market benchmarks) get wagged more by the “Magnificent 7” including Consumer Discretionary (XLY) with Amazon and Tesla, Tech (XLK) with Microsoft, Apple, and NVIDIA, and Communications Services (XLC) with Alphabet and Meta.

The above chart frames the 1-week returns in our universe of 31 ETFs and benchmarks. As cited earlier in the piece, the week was a major rebound off a rare poor performance for the trading week ending 3-15-24. The FOMC dot plot and Chair Powell’s tone drove some tailwinds on the week (see links at bottom).
We also saw some reassuring indicators along the way with housing starts and existing home sales. The recent trends from the major builders have been showing firming of both new and existing homebuyer appetites at 6% handle mortgage levels. Some bellwether builders (KBH, LEN) weighed in the past two weeks with optimism to be found in their solid performance reports.
The two negative ETF returns on the week included Real Estate (XLRE) and Base Metals (DBB) with the former still catching headline heat on asset quality and Base Metals more dictated by China and global macro trends. With the UST curve shift, all the bond ETFs managed to stay out of the red zone.
Beyond the clear victory of Builders (XHB) on the week, we still see tech-heavy and Mag 7 flavor in the top quartile across Communication Services (XLC), NASDAQ (IXIC), Consumer Discretionary (XLY), the S&P 500 (SPX), and the Tech ETF (XLK), and just below that group the Equal Weighted NASDAQ 100 (QQEW). The mix of other sectors in the top quartile included Transports (XTN) and Industrials (XLI), so the leaderboard was not dominated by Tech.

The 1-month returns got a lift from a good week and was back to 29-2 (vs. 22-9 last week) with only two ETFs posting slight negatives in the form of Transports (XTN) and Health Care (XLV). Energy was quieter this past week but has generated a solid month on oil prices crossing into the $80 handle range.
The top 5 reflect notable and reassuring breadth with Builders (XHB) at #1, E&P (XOP) at #2, Energy (XLE) at #3, Materials (XLB) at #4, and Industrials at #5 followed by Mid Caps (MDY), Utilities (XLU), and Financials (XLF) rounding out the top quartile. We see Small Caps (RUT) and the equal weighted S&P 500 (RSP) at the upper end of the 2nd quartile.

The 3-month horizon is showing more balance as the bull market stretch of Nov-Dec 2023 drop out of the measurement period but are still showing solid 3-month run rates with 6 line items in double digit return range and 11 of the lines at 8% or higher.
As noted earlier, the Bond ETFs have struggled during 2024 so far on the adverse UST shift with 4 of 6 negative in the rolling 3-month horizon. The two positive carry higher credit risk in HY (HYG) and Emerging Market Bonds (EMB) but only generated 1% handle returns.
We see Regional Banks (KRE) back on the bottom YTD on the NYCB noise and more attention on the next real estate shoes to drop. Real Estate ETF (XLRE) is very diverse in its profile and many subsector asset classes in the REIT family. That does not change the reality of the interest rate sensitivity of the asset mix and the “income stock” equities in the ETF mix.
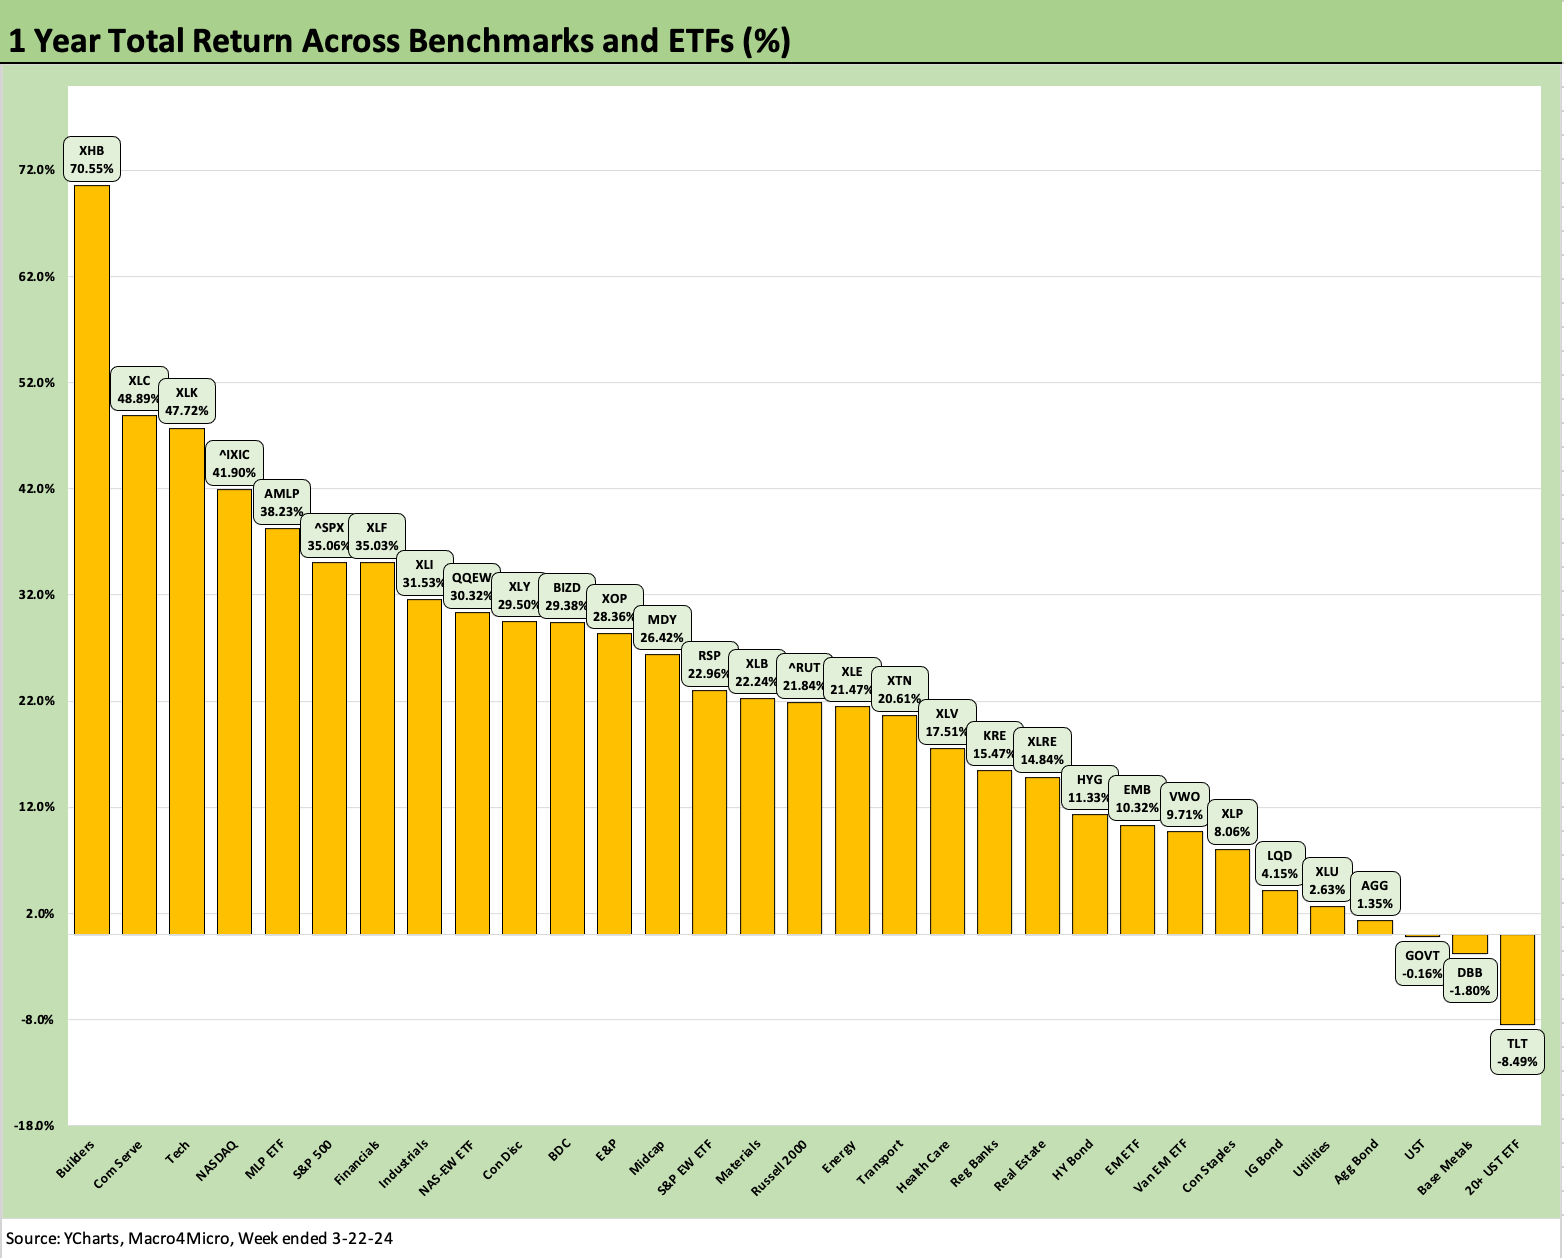
The trailing 1-year is still framing up well at 28-3 positive with two bond ETFs in the red and Base Metals (DBB) at negative total returns. The worst performer by far for this 1-year measurement period was the long duration UST 20+ Year Bond ETF (TLT) at -8.5%. TLT was beaten up in the later summer and fall vs. bond alternatives.
The top quartile has a heavy tech and Mag 7 flavor with 4 of the 7 (XLC, XLK, NASDAQ, S&P 500), but Builders (XHB), Midstream Energy (AMLP), Financials (XLF), and Industrial (XLI) made the cut also with XHB at #1 ahead of XLC, XLK and NASDAQ.
What’s next?
On a positive note, forward looking valuations do not (yet) factor in the political noise. Washington is as dysfunctional as ever, that deep thinker Marjorie Taylor Greene just threatened to torch the GOP leadership again, Trump faces asset seizures as we go to print, tariff threats abound, Israel is under siege from some of the Progressives (likely including some who stayed home in 2016 in a snit), and the fate of Ukraine hangs in the balance. ISIS terrorists have put up their hand as the ones who killed scores at a Russian concert and Putin blames Ukraine.
The world never fails to come up with new material as Trump threatens 100% tariffs on cars made in Mexico by the Chinese, and he is still calling for 10% universal tariffs that will trigger retaliation on a grand scale (notably against the farm belt). The farm sector bailout to repair the retaliatory effects will inevitably require Federal funds like last time (watch the Freedom Caucus rediscover their budgetary largesse on that one!). Trump wants to cancel the Affordable Care Act and decimate household discretionary cash flow. He has a plan, right? 7 years in the making? That is important for the PCE line to say the least.
This is the part where we pipe in the background music “It’s a Wonderful World.” Or was that Eve of Destruction?
See also:
Pension Profiles: Benefit Drain Rates and Returns 3-22-24
Existing Home Sales Feb 2024: Surrendering to Mortgage Market Reality 3-21-24
FOMC: Hail Powell the Consistent 3-20-24
Housing Starts Feb 2024: Rites of Spring on the Doorstep 3-19-24
Industrial Production: Capacity Utilization Shows Manufacturing Edging Higher 3-15-24
Retail Sales: Consumers Will Stop Shopping…Someday 3-14-24
CPI Feb 2024: Extra Innings 3-12-24
Employment: Real Numbers vs. Fictitious Dystopian Hellscapes 3-9-24
Payroll Feb 2024: Record, Revisions, Reality 3-8-24
JOLTS Jan 2024: Holding at “High” Even if Well Down from the Peak 3-6-34
Inflation Gut Check Jan 2024: PCE Prices, Income, and Outlays Help the Story 2-29-24