
Market Commentary: BBB vs. BB Quality Spreads Revisited
We revisit trends along the speculative grade divide as measured by BBB vs. BB OAS differentials.


The compressed spread story line in IG and HY extends to the additional spread offered for stepping down from BBB into the BB speculative grade basket.
The market has seen past periods that were much more compressed in terms of BBB vs. BB OAS differentials such as the credit market peaks of Oct 1997, June 2007, and Dec 2019, and as we know those did not end well for HY OAS in the aftermath.
Some of the past peak spread waves that unfolded after credit pricing tops came on fast but also included some false credit cycle panics (in varying degrees, 3Q98, 3Q11, 1Q16, 4Q18) that were well before the credit cycle ended.
The belief that the credit markets will lead the cyclical downturn (as opposed to equity market dips and corrections) remains in place for many major institutional investors.

The above chart runs across the cycles from 1997 (when daily OAS became “a thing”) through the current market. A lot has happened across the highs and lows of those periods of swinging differentials. We revisit the individual BBB and BB OAS Hi-Lo moves for each of those credit tiers in the charts below, but the above chart underscores the material moves in relative risk pricing. The current differential (BB OAS minus BBB OAS) is down around 109 bps vs. the long-term median of +138 bps. That qualifies as compressed even if well above the pockets of extreme tightening.
The spread differential highs and lows plotted above reflect the quality spread compression and widening across the economic expansion/contraction histories. More importantly, we see the patterns of pricing across the “credit cycles” wrapped around the notorious periods of excess on the way into the lagging default cycles (see UST Curve History: Credit Cycle Peaks 10-12-22). We label them in the box inside the chart, but the TMT boom/bust of the late 1990s and the Housing/Structured Credit bubble of 2005-2007 need little introduction.
The move between a high BB composite rating and a low BBB composite involves small incremental moves in rating agency decision-making. The treatment of that move in the market and by rating agency labels (instant transformation from “investment grade” to “speculative”) led to more than a little pricing distortion over the decades.
The real action and opportunities come when spreads get dislocated and long duration, covenant-anorexic BBB bonds lack a natural buyer base in the HY markets. That often means a stiff penalty for long-dated paper and the spread effect reverberates back along the spread curve for that issuer. That often creates buying opportunities, but that also usually means it makes sense for sellers to “sit out” such periods until the secondary liquidity penalty eases. The effects have moderated over the years in credit, but the label spills into the equity markets at times (the infamous “downgraded to junk” headline).
Ratings criteria lookback…
Through credit market history, the gap between investment grade and speculative grade was often overhyped when the dividing line is in fact just part of a risk-reward continuum. The focus was good for rating agency market power (no doubt there), and the alphanumeric scale eventually was woven into portfolio parameters, fund requirements, loan pricing documentation, etc. The Feds even embraced it and then spent years trying to change it after all the fun and games of Enron and WorldCom, etc.
The whole topic of regulatory arbitrage and price distortions tied to ratings is a can of worms covered ad nauseum during the ratings reform years with Congress and SEC in the decade after Enron, WorldCom, etc. The battles to get legislation done took years after Sarbanes Oxley (2002) required a review. Small actions were taken, but the structured credit AAA-AA-palooza changed the rules again.
In this note, we are looking at the lower stakes nuance of the BBB vs. BB corporates. Those are mild compared to what unfolded with the evaporating BBB tier of structured credit. The idea in structured credit and RMBS was that the BBB layer should not translate into zero recovery value if the structured vehicle blows up. The outcomes in BBB to BB corporates was much more muted and generally less of a major ratings system flaw. It was more about a few bad calls and poor due diligence and transparency.
The market inefficiencies and “regulatory arbitrage” issues have been tamped down as more investors changed ratings criteria to improve their ability to navigate and exploit price changes in such markets.
The “HY Lite” strategy picked up during the ZIRP years for traditional BBB buyers looking for remotely respectable cash income. Pension funds of all types looked at the risk-reward trade-offs in more detail and did their due diligence. I had more than a few conversations on the topic with some asset managers on such criteria review, and especially public sector defined benefit plan managers with high pension benefit payout rates. Simply put, they needed cash flow. The reach for yield needs has eased with 5% handle in short UST. The economic realities of ZIRP and a depressed UST curve sent many looking to tweak their asset allocation strategies, and now that pressure has eased.
Revisiting quality spreads and the credit tier midsection…
Reviewing the speculative grade divide for cyclical context is a routine exercise for those in the credit markets (see The Speculative Grade Divide: BBB vs. BB Differentials 11-22-22). The low BBB vs. high BB lines have been blurred for “IG vs. spec grade” holding across time. More investors leave themselves flexibility to hold on downgrades and even add. Many have moved the needle to include the BB tier in their parameters to search for better value in credit risk and even better structure.
There are risks beyond just credit risk in the mix including structural risks. The ultimate structural subordination risk in an LBO is a HoldCo IG bond without any subsidiary guarantee. For example, many BBB bonds do not offer subsidiary guarantees while most BB bonds do have that feature. That type of edge in structure may only offer limited protection given the rest of the risk checklist, but quirks like that can matter at times (as in just when you need it to mitigate downside).
Still too early for the BBB roller coaster…
Below we plot the BBB tier OAS timeline from 1997. The wild ride cuts across concentrated auto issuer spirals, energy sector meltdowns, and a systemic bank crisis with a lot of BBB tier bank and broker paper. The stories of the TMT years and the Enron period for power are the stuff of legend and “more than legend” if you owned them.

We have spent plenty of time mired in those credit cycles of bygone years detailed above and summarized some historical timeline in past commentaries (see links at bottom). The P&L pain that can be delivered to a secondary trading desk by a BBB long bond is considerable, and that in turn saw a tendency to generate the usual response of defensive (and evasive) price action for limited size. That ride has not started at this stage in August 2023 even if some single names can get tagged.
The BBB tier brings a new world in the current cycle in terms of sheer size at a time when fewer major players are making markets than seen in modern bond market history (that includes the Glass Steagall 1980s). More online alternatives are a mitigating factor in some cases. The next downturn will challenge a BBB sector that is larger than most major nation GDPs. The US BBB tier is framed at around $4 trillion in face value. That means the US BBB tier is bigger than France and the UK GDP and is closing in on Germany.
BBB peaks, valleys, and medians…
The above chart plots BBB tier OAS and various time horizon medians. We see lows in late summer 1997, early 2005, mid 2014, early 2018, and in parts of 2021 (June, Sept). The BBB OAS highs really stood out during the double dip default whipsaw of the 2000-2002 period and especially in late 2002. The default cycle in HY was already in gear in late 1999, the NASDAQ had peaked in early March 2000, and pockets of fundamental weakness were underway. The NBER dating of the economic cycle had set the peak in March 2001 (see Business Cycles: The Recession Dating Game 10-10-22). The economy slid into a downturn in 2001 as tech equities and TMT valuations in credit were getting hammered. Greenspan went into a frenzy of easing (see Greenspan’s Last Hurrah: His Wild Finish Before the Crisis 10-30-22).
Enron took the screens by storm in the fall of 2001 (Chapter 11 Dec 2001), and then the bottom fell out for shaky BBB tier names in the summer of 2002 with the WorldCom fraud. There was a lot more going on in the 2001-2002 timeline (asbestos shocks, some CP defaults, bank pressures, California utility stress such as PG&E bankruptcy, auto turmoil with Chrysler in the Daimler family tree, Washington investigations of banks/brokers, Sarbanes-Oxley passed, etc.) In other words, it takes a lot to drive those kind of dislocations.
We will skip the housing bubble and systemic credit crisis that unfolded into 2007 (see Wild Transition Year: The Chaos of 2007 11-1-22). The BBB spread waves across the post-crisis period (post-June 2009) and the longest expansion in history were set against the backdrop of the latest crisis tied to sovereign stress and Eurozone turmoil in 2010-2011 and the US sovereign downgrade in 2011.
The bounce off the systemic stress period saw monster rallies in the BBB tier and IG bank paper and the decade’s best year for equities in 2013 on the way to cyclical lows in HY spreads in June 2014. The HY rally added further support to BBB vs. BB compression.
Then the fun began in oil and gas after the shale boom brought dozens of new leveraged E&P issuers into the US HY market. This is relevant to the BBB vs. BB relationship since the quality spread widening more typically reverberates from the bottom up. The bank systemic crisis of 2008 drove the spread dislocation from the middle down. Oil and gas credit stress peaked in 4Q15 and 1Q16 and the BBB vs. BB relationship reverted to the old fashioned pattern of bottom-up quality spread widening.
The 2H14 to early 2016 spread turmoil and +306 bps peak in BBB OAS in Feb 2016 was linked to the energy sector swoon on the price war and commodity price collapse. A heavy mix of BBB energy names were hit from upstream to midstream to the integrated names. The early 2018 rally got a boost from tax cut optimism, cyclical bullishness, and rallies in oil prices (until a late 2018 setback). That brought a fresh cyclical low in HY spreads in fall 2018 before a HY swoon in 4Q18. The Fed easing on a slowing economy in 2019 propped up sentiment before the COVID pyrotechnics flared up on the way to the 2021 rally and recent rebound off the 2022 inflation spike and Fed tightening scare.
The BB tier and the reverberations from below…
Below we look at the BB tier OAS history. This tier saw a blurring of the credit categories as more BBB investors stepped down into the BB mix that shows many attributes of the BBB tier. The increase in long-term default rates in moving from the BB tier to the B tier in HY comes with an exponential increase in default rates. So, the BB tier is a mixed layer in its risk profile. That attracts a lot more traditional BBB tier demand. Just as the BBB is the largest tier in the IG corporate index, the BB tier is by far the largest in US HY. That makes the two combined a busy midsection of the credit tiers.

The above chart plots the highs, lows and median of the BB tier. The current market is well inside the long-term median and the various timeline medians that we break out in the box in the chart. The most recent BB tier spread lows during 2021 (+206) was competitive with prior post-crisis lows but still well above the housing bubble period lows (2005) and TMT period tights (1997).
The swings in BB OAS are driven by many of the same catalysts along the timeline of market events that drove the BBB tier, whether cyclical turns, systemic anxiety (notably sovereign and bank system worries in late 2008 and Oct 2011), bouts of broad risk repricing across risky asset markets (oil crisis and HY redemption panic of 4Q15/1Q16), or the credit cycle upheaval of 2001-2002 and late 2008/early 2009.
The energy turmoil of late 2014 through 1Q16 fell disproportionately harder on HY OAS quality spreads with the bottom effectively falling out of the HY market. That in turn reverberated up along the credit tiers as investors were unnerved by a spike in energy defaults and plunge in recovery values.
We do not need to revisit COVID, which saw the BB tier well inside 2008 on Fed support for the banks during the pandemic. Fiscal and Fed actions broadly had a playbook ready to go for COVID after the credit crisis experience.
The shorter timeline view…
The chart below zeros in more on the differential for BBB vs. BB starting in early 2021 after the vaccine was widely available and financial stimulus and relief was on fire (see Inflation Rorschach Test: Looking at Relief and Stimulus 2-7-23). The Fed continued to stay in ZIRP mode on the short end while the market was casting its vote on the long end during 2021. We look at those histories in our weekly Footnotes publication on the yield curve.
For credit spreads, the main news in 2021 was that the rally was on for BB and BBB as we detail in the final chart at the end of this piece. Fall 2021 was the bottom and then inflation was rolling into the picture ahead of new anxiety in 2022 as wars began, energy spiked, ZIRP ended, and the UST migration kicked into high gear.
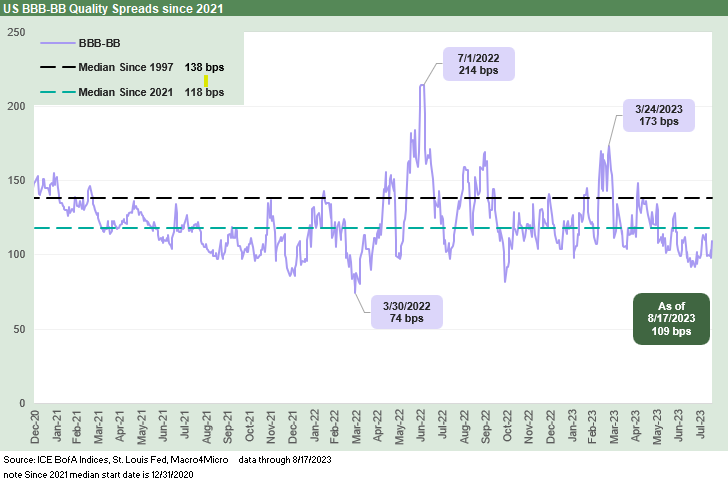
The above chart presents the quality spread swings for BBB vs. BB over the short time horizon from the start of 2021 through the end of last week. We see a March 2022 low of +74 bps framed against a July 2022 high of +214 bps. That Hi-Lo range offers a reminder of what can happen in a hurry even in an expansion where growth at the macro level and earnings at the micro level are respectable.
The timeline median differential of +118 bps since 2021 and most recent level of +109 bps are close, but over such a short time frame, the swings were material. The Hi-Lo range of +140 bps (+214 bps minus +74 bps) was almost double the low of +74 bps in a short timeline from 3-30-22 to 7-1-22, or just over 3 months.
The spread wave in the aftermath of the Silicon Valley Bank failure and mini-contagion saw the BBB vs. BB spread differential spike to +173 bps in March 2023. As tracked in the next chart, the March highs in BB tier OAS at +366 bps before a +102 bps contraction from the March peak through the latest print. The highs of June 2022 for the BB tier were a part of a spread gap that saw US HY OAS rise to levels just shy of +600 bps. Those swings offer a reminder of better opportunities that will be available down the line.
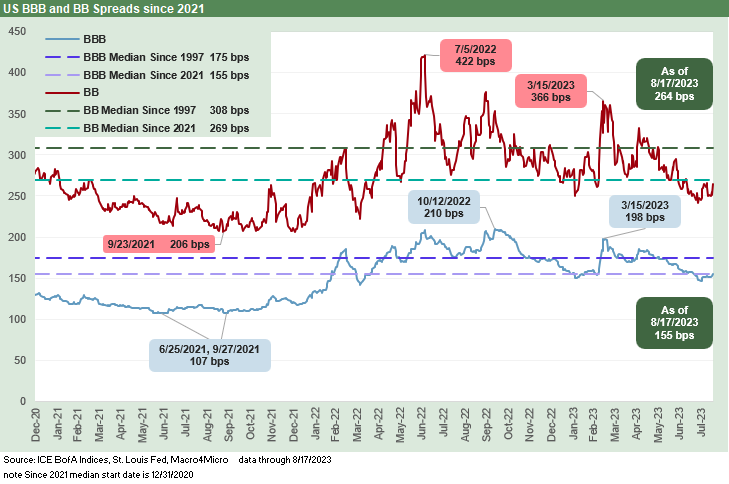
The above chart plots the shorter timeline moves in actual BBB and BB OAS. For BBB, we see 2021 lows in the summer and fall at +107 bps. Highs for BBB were posted in Oct 2022 at +210 as inflation had the world on edge along with so many rapid-fire hikes. We saw another wave after the regional bank scare unfolded with BBBs back up to just under 200 bps. The most recent quote noted in the chart of +155 bps thus leaves a fair amount of exposure as we head into the fall period and the usual late year defensiveness.
For BB, we see lows at +206 bps in Sept 2021 and higher during the summer 2022 HY spread pain. BBs hit +422 bps In July 2022 around the time the overall HY market just fell shy of +600 bps. The post-Silicon Valley Bank risk repricing saw +366 bps in mid-March ahead of the ensuing rally that saw BB tier OAS recently move into the 260+ bps handle area.
See also:
Fed Funds vs. Credit Spreads and Yields Across the Cycles 6-19-23
US HY Spread Histories: Weird Science, New Parts 3-19-23
IG Corporate Spreads: Tough Pathway, A Few Doors Ahead 3-19-23
Spreads Across Tiers: Decompression + Volatility 3-18-23
Wild Transition Year: The Chaos of 2007 11-1-22
Greenspan’s Last Hurrah: His Wild Finish Before the Crisis 10-30-22
Greenspan’s First Cyclical Ride: 1987-1992 10-24-22
Expansion Checklist: Recoveries Lined Up by Height 10-10-22
Business Cycles: The Recession Dating Game 10-10-22
Inflation: Events ‘R’ Us Timeline 10-6-22
Contributors
Glenn Reynolds, CFA (glenn@macro4micro.com)
Kevin Chun, CFA (kevin@macro4micro.com)