
Footnotes & Flashbacks: State of Yields 1-14-24
A strong rally in the short segment of the UST sets the tone for more UST shapeshifting debates.


We update a fresh round of moving parts along the UST curve and related shapeshifting for the past week as PPI trumps CPI and the 2Y to 30Y moves back to flat and slightly upward sloping while 2Y to 10Y stays slightly inverted.
The UST move bolstered fixed income and credit returns as duration was rewarded on HY and IG and tag teamed with some spread compression.
The potential for a mixed steepening trend (fed funds and short UST lower, longer UST uncertain) will remain a major source of debate with downward pressure on the front end from the FOMC clashing with the push-pull effects from supply out the curve while the interest expense bill soars.
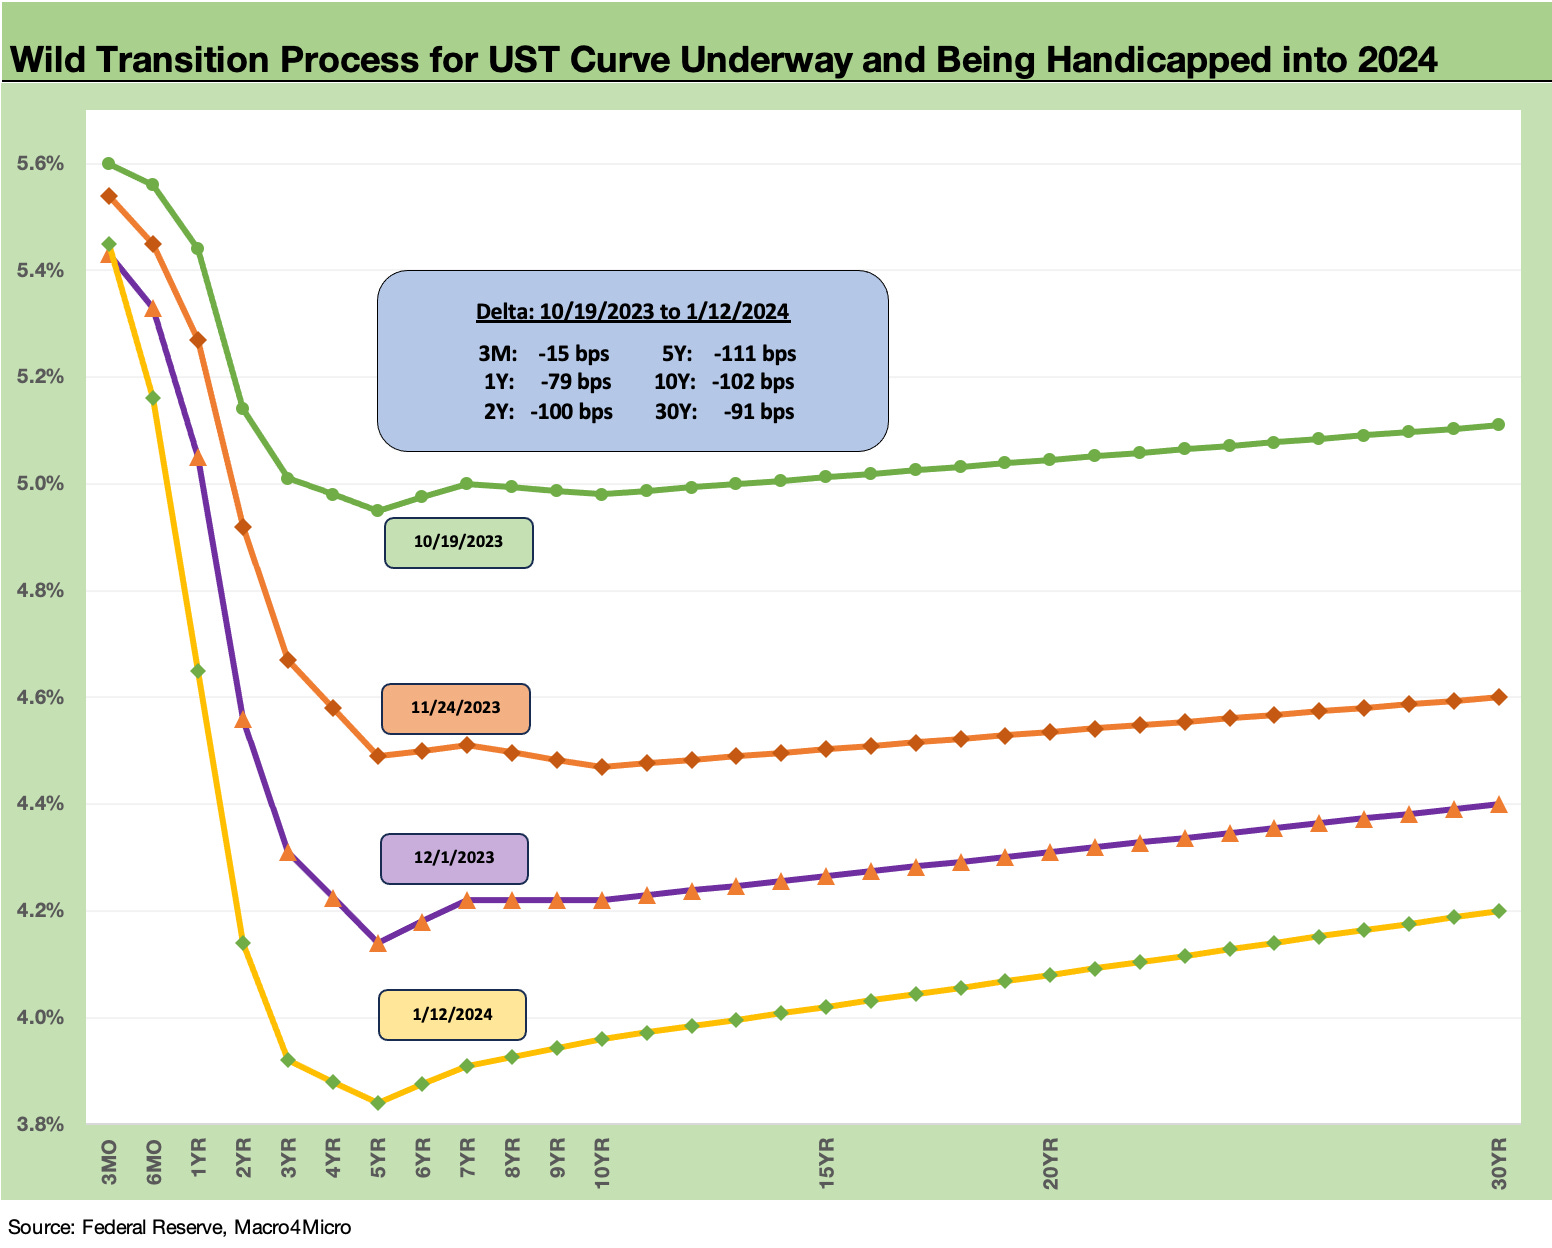
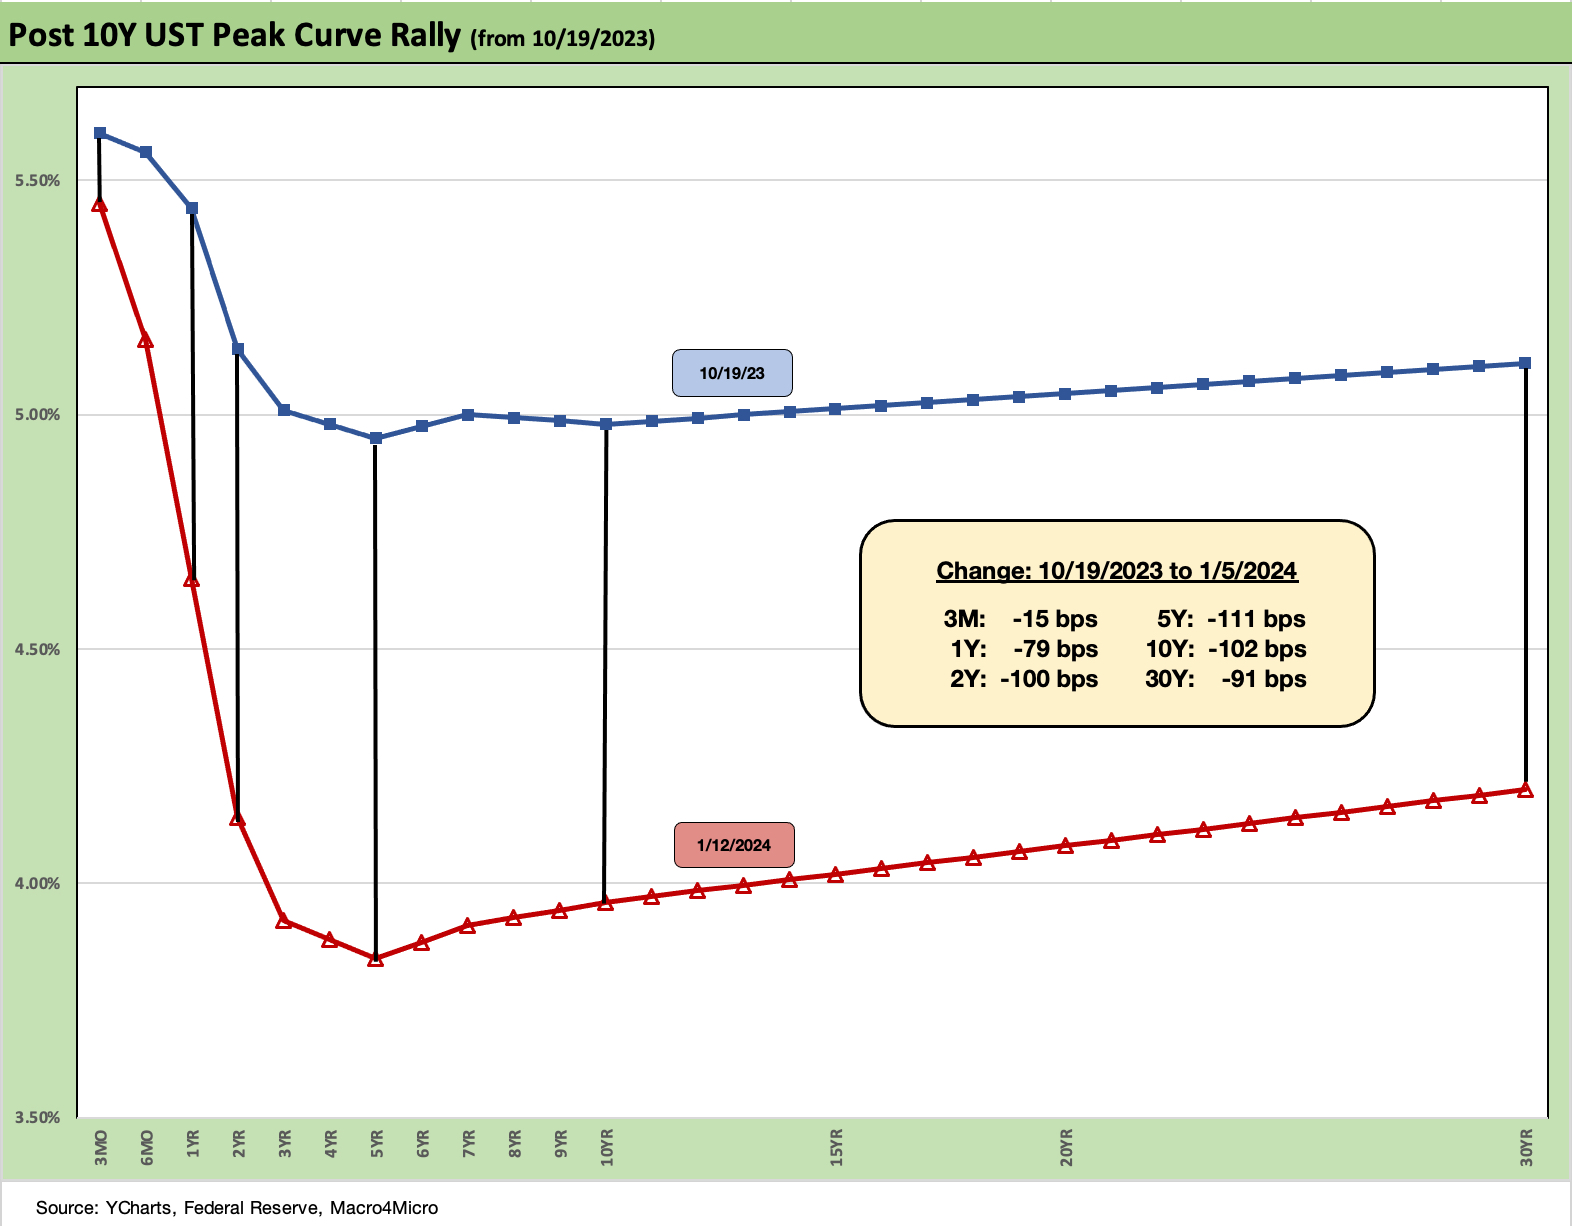
The above chart updates the UST shift since late Oct when a wide range of UST and equity asset classes posted negative running returns as the 10Y UST was flirting with the 5.0% line. We then plot the moves lower across late Nov into a material rally in Dec and early January in what is essentially a bull steepener pattern beyond 5Y UST.
In the box within the chart, we detail the running UST deltas from Oct 19 (our chosen day for peak trouble on the 10Y UST) with the 2Y to 10Y showing a triple digit move with the 30Y slightly lagging.
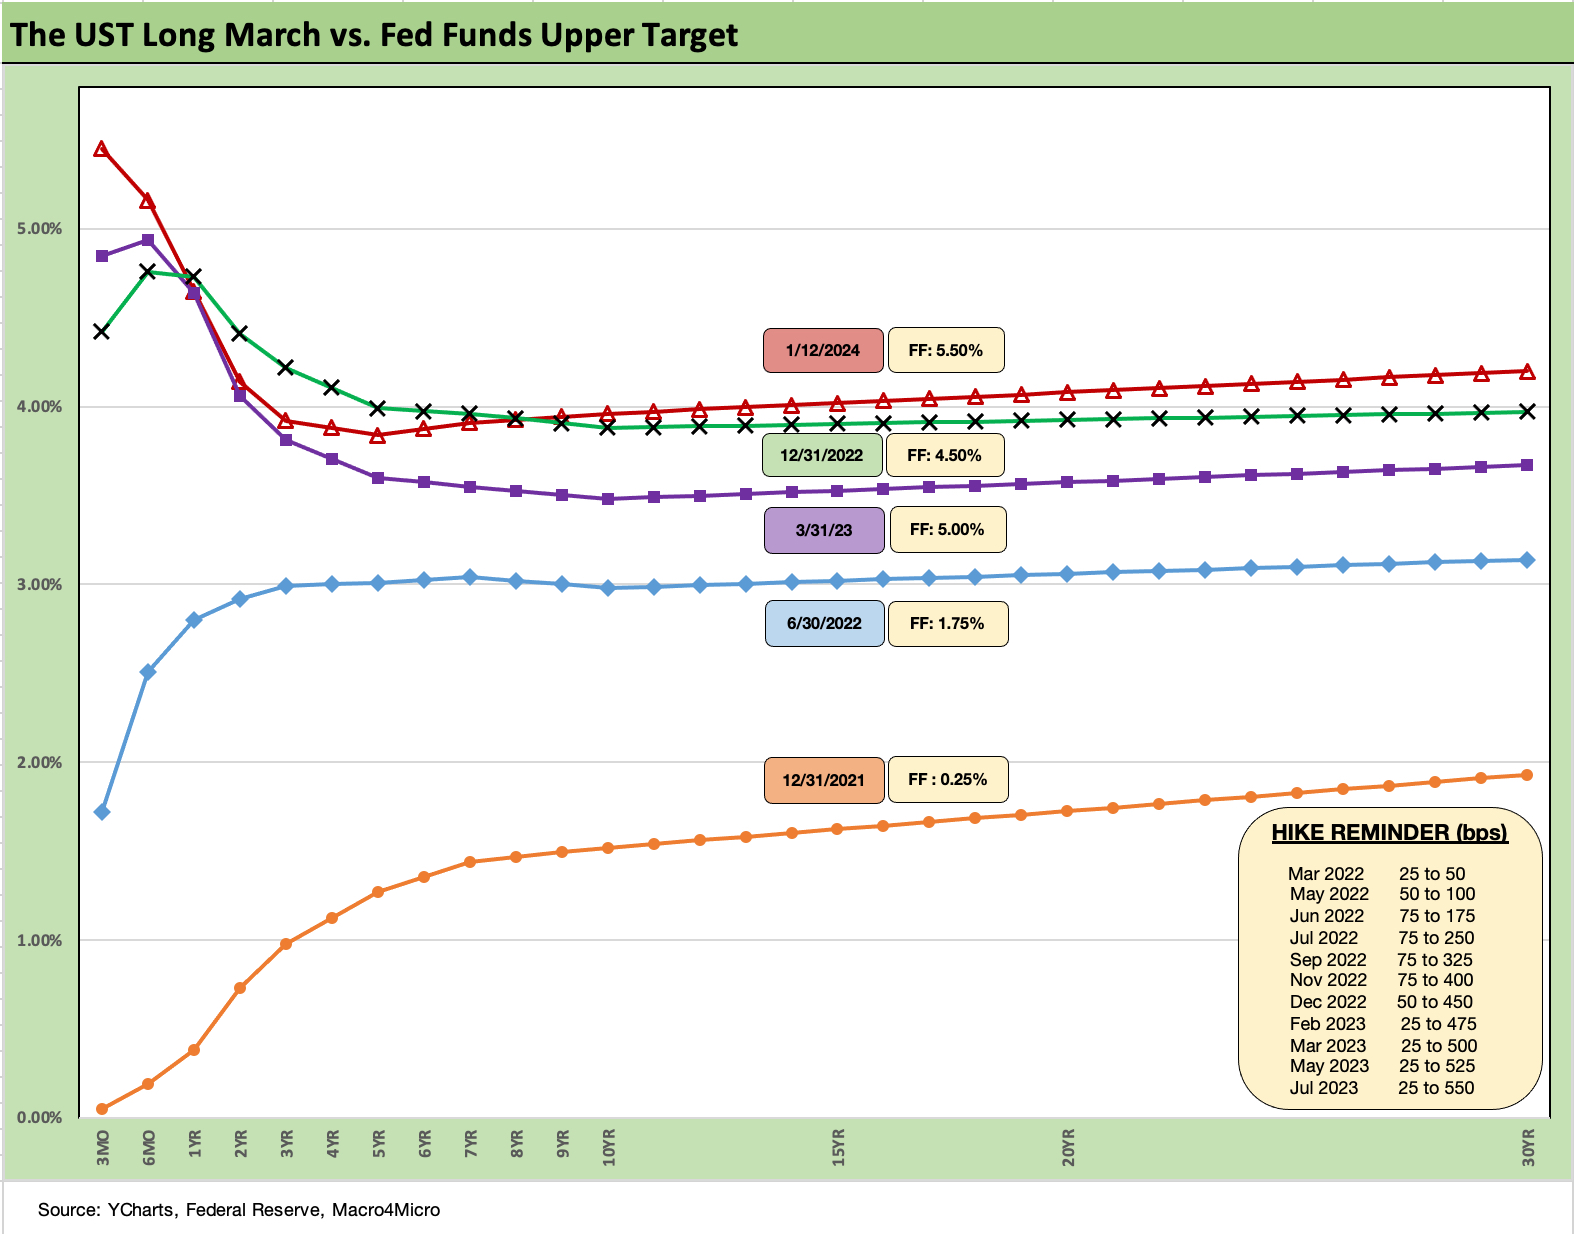
The above chart updates the running UST migration since the end of 2021 when tightening across 2022 gave way to a short-term rally after the March 2023 regional bank mini-crisis. We include a Fed hike memory jogger in the attached box.
The slight steepening pattern of late is consistent with the reality that the inversion is not sustainable with either the Fed easing or more duration trouble ahead if the UST migration moves back toward “normal” term premiums. Something has to give, but the market has not seen an inflation fighting battle for four decades. Zero similar events are not a big sampling over that timeline.
We have been of the school that a downward migration on the long end will be hard to sustain in a Goldilocks market and that the steepener will need to reflect market clearing levels out past 5 years to meet record funding demands.
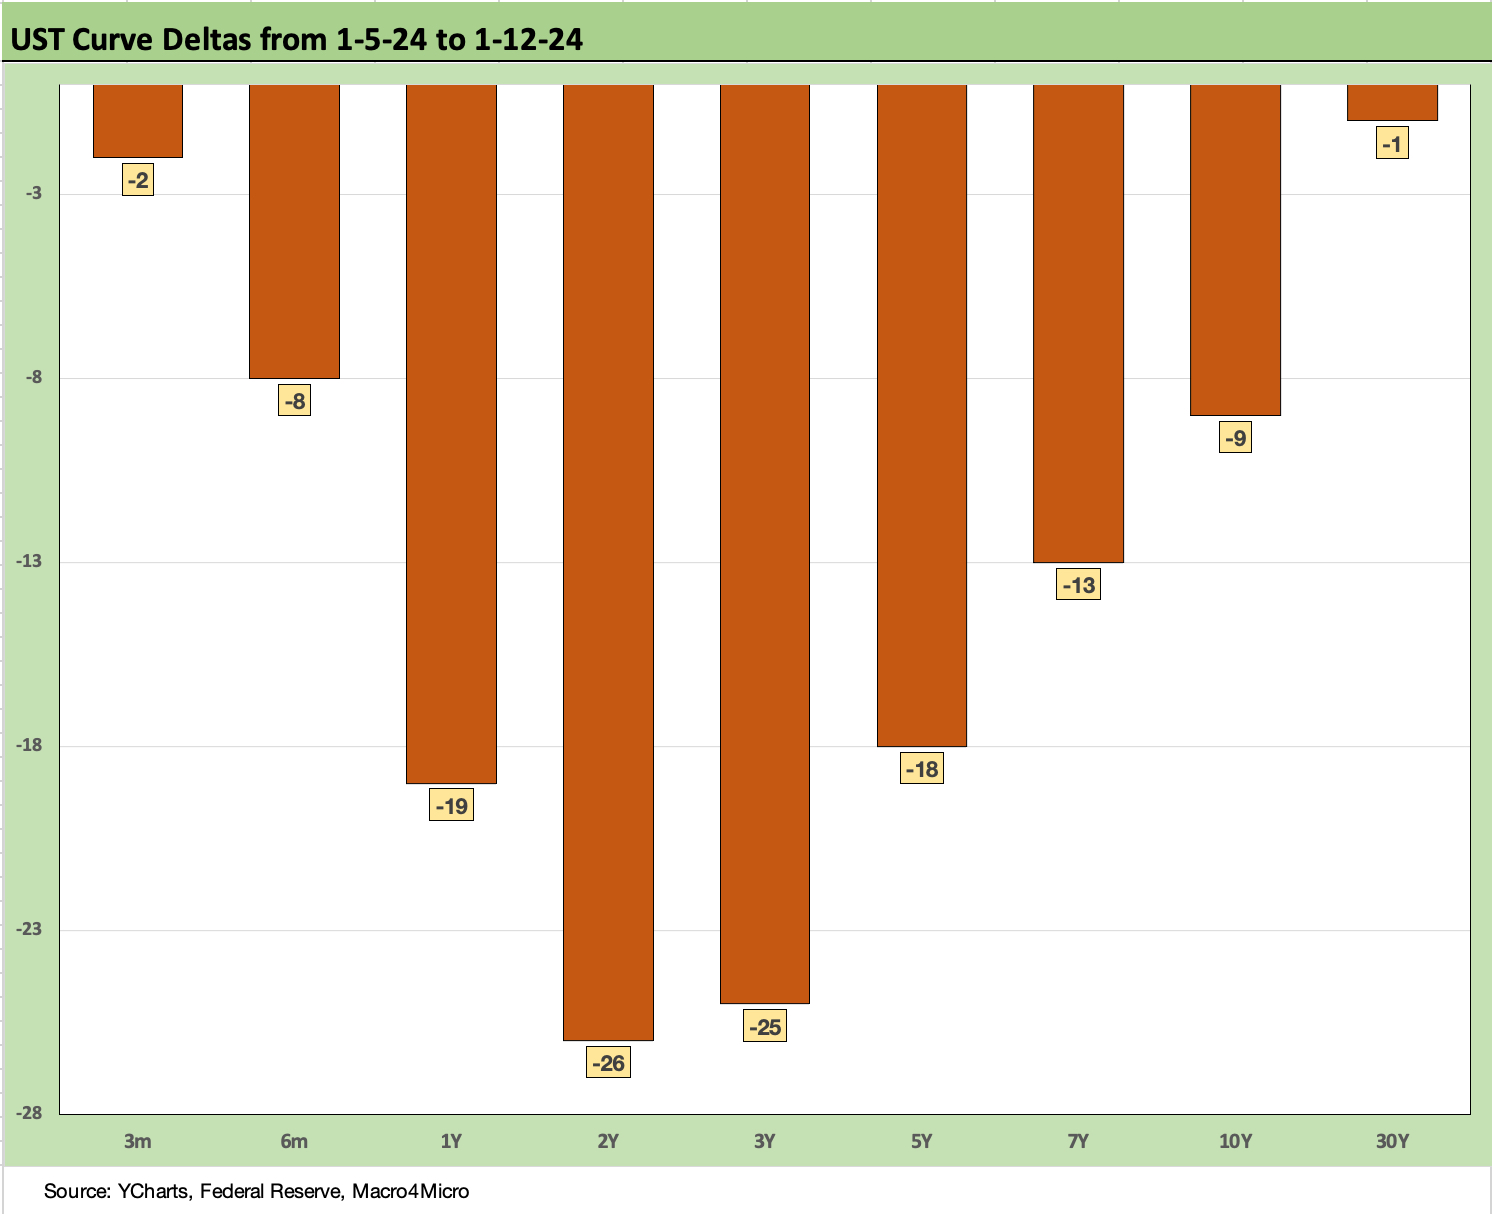
The above chart updates the UST deltas for the week with the 2Y and 3Y moving the most and back-ended on the week after PPI trumped the effects of a much less “UST bull friendly” CPI release (see Dec 2023 CPI: Big 5 and Add-Ons, the Red Zone Challenge 1-11-24). That CPI number came after a similarly less friendly jobs report the week before (see Dec 2023 Jobs: Not Feeling the Early Ease 1-5-24, Employment Part Deux: Unemployment Claims Update 1-6-24).
As UST rates come down more quickly in the 2Y to 7Y area in the face of tight credit spreads and healthy fundamentals, there should be ample room to get some refinancing and extension issuance in place on callable paper in HY (see HY Refi Risks: The Maturity Challenge 12-20-23).
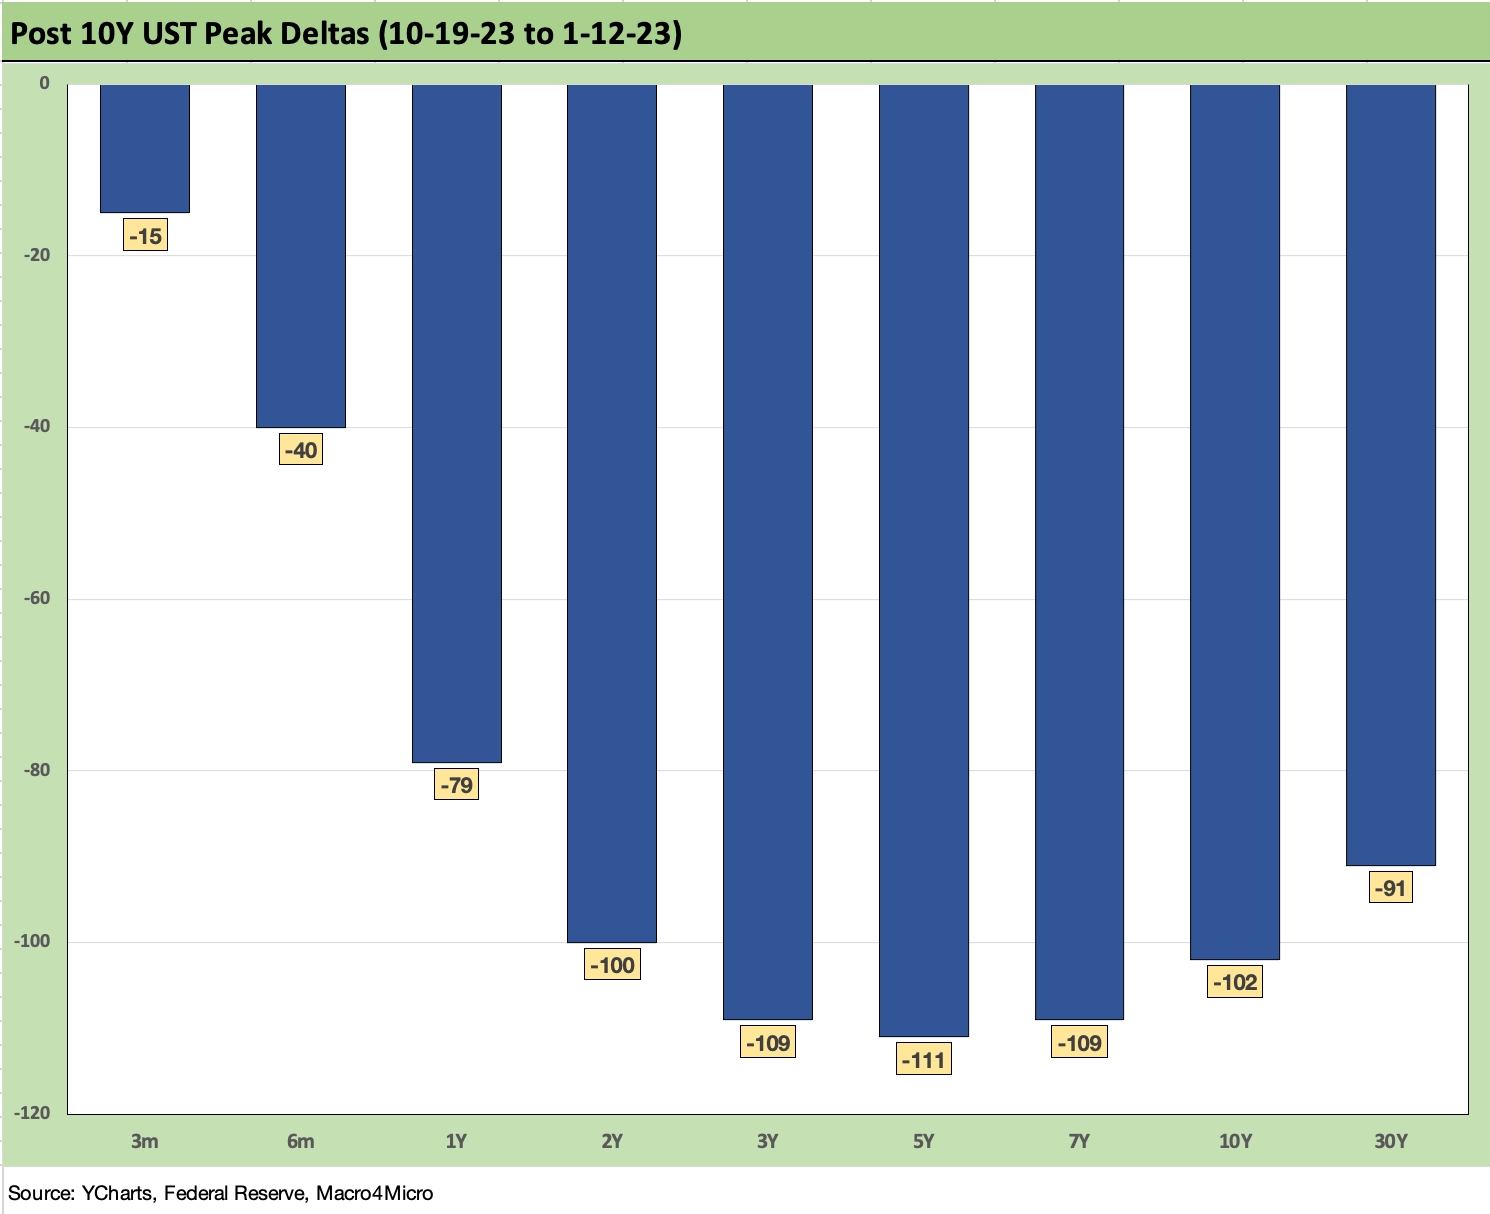
The above chart plots the UST deltas from the late Oct period of peak pressure on the 10Y UST near 5.0% ahead of the ensuing monster rally of the UST curve. The UST move combined an impressive downward shift from 2Y to 10Y with some more recent steepening from 2Y to 30Y.
For this coming week, the releases include Retail Sales and Industrial Production along with some more housing data (starts, existing home sales) that should give some more cyclical indications on both the consumer as well as the manufacturing sectors.
The consumer credit quality data will be streaming out of the bank and finance sector earnings reports. That will matter to those UST bulls who see credit quality and rising delinquencies as the path to a slowdown and Fed easing.
The above chart puts the prior chart’s UST deltas into a yield curve format that shows the scale of the UST rally. We detail the delta moves in the box and offers a visual on the steepening.
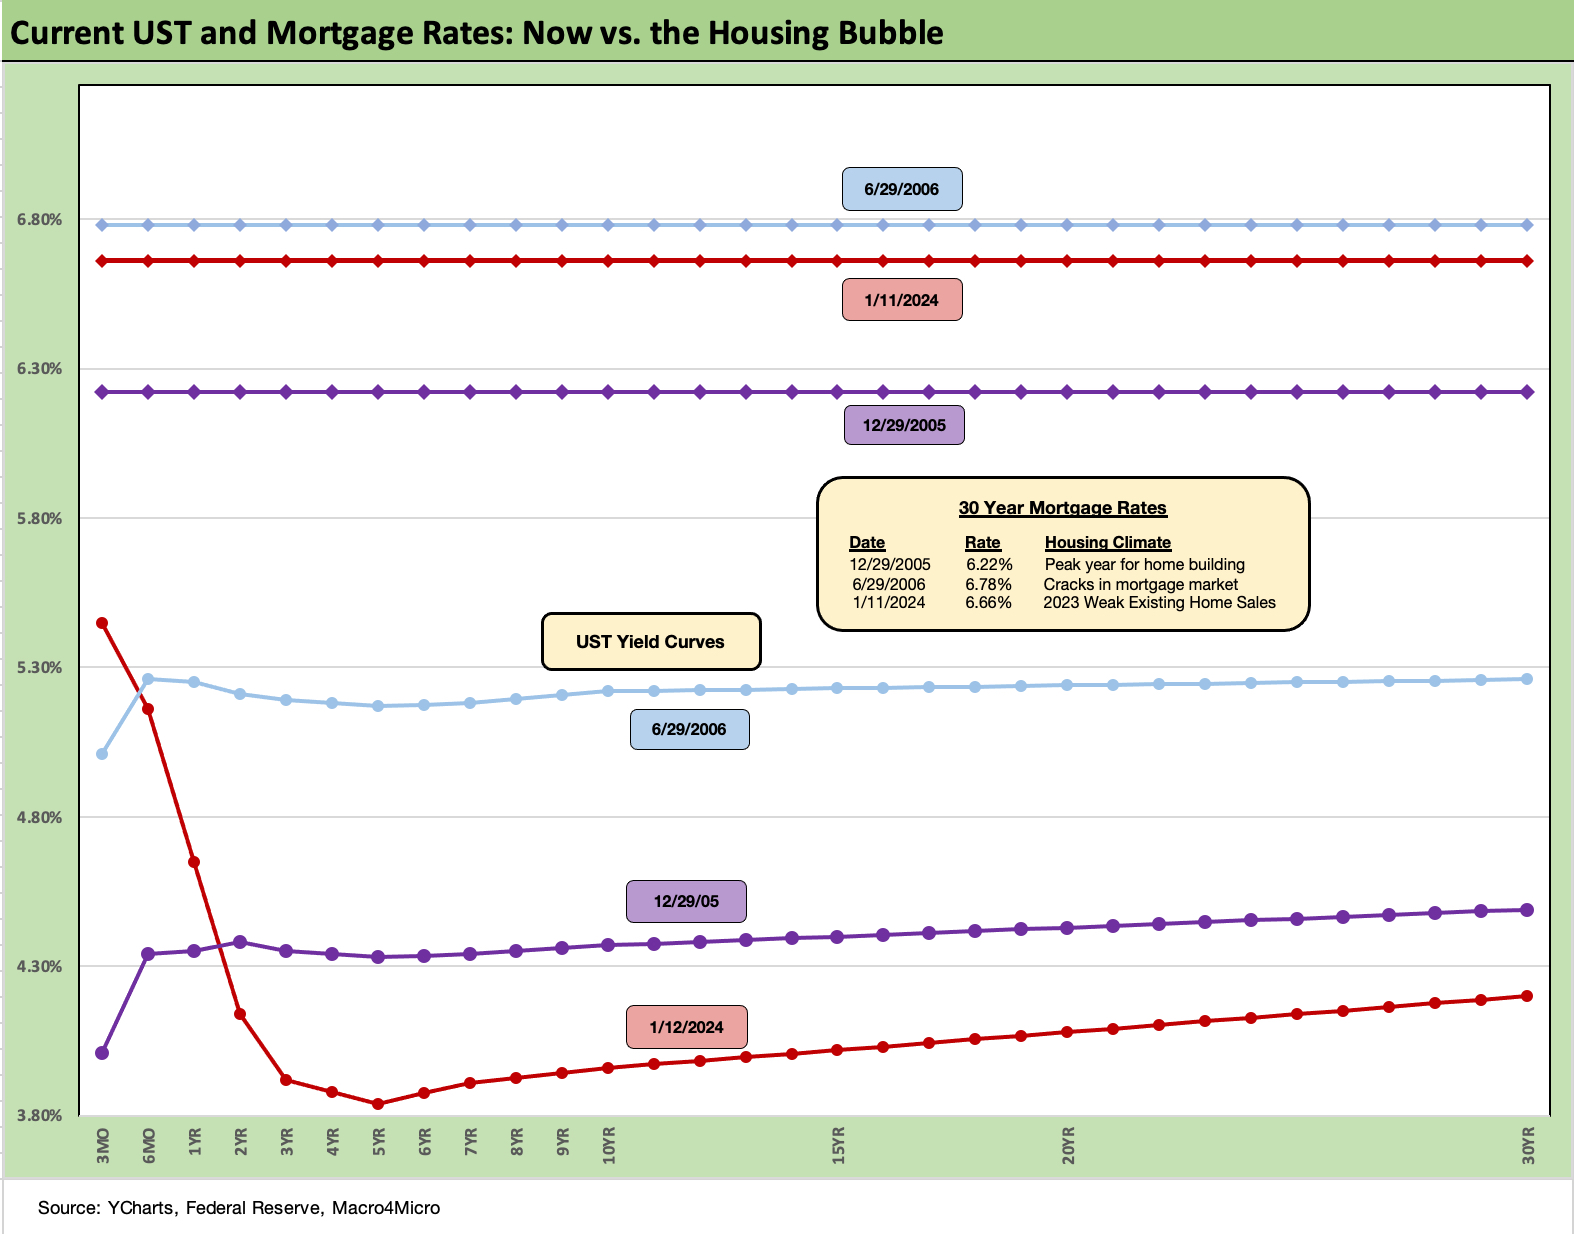
The above chart updates the comp charts of the Freddie Mac 30Y mortgage benchmark vs. the current UST curve. We provide comps from the peak homebuilding year of 2005 (using 12-31-2005) as well as a date (mid-2006) near the point where worries around subprime RMBS and mortgage derivatives excess were seeping into the system and being noticed but lending activity in mortgages, structured credit, and leveraged loans were still smoking hot and running amok.
The most recent mortgage rates are now below 2006 but above 2005, but the UST curve is well below both as noted. Home prices are materially higher now than in the earlier periods, so the affordability factor at current mortgage rates is still daunting for many and a barrier to selling for existing mortgage holders (“golden handcuffs”, etc.).
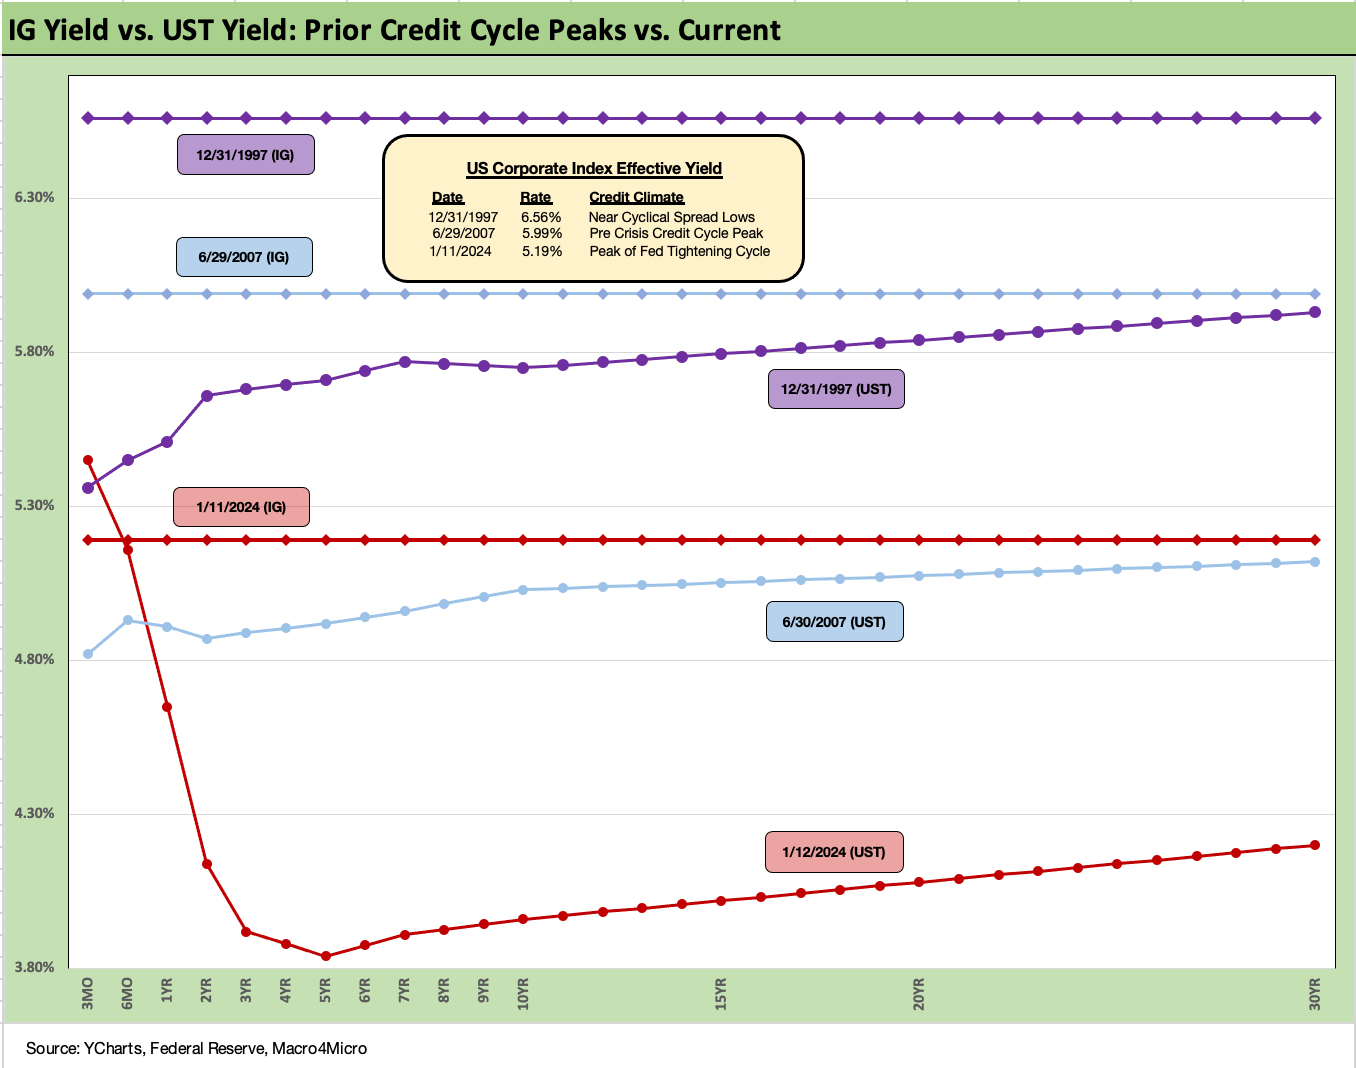
The above chart does a similar drill as mortgages with a lookback to prior credit cycle peaks. We frame the index yield and UST curves vs. dates from the lowest spread peak credit years of 2007 and 1997. We plot the IG index yield from those earlier periods as noted in the chart.
We covered the history of past IG credit spreads in our 2023 year-end review (see Footnotes & Flashbacks: State of Yields 1-1-24 1-1-24). Spreads this prior week moved tighter by -7 bps in IG to +102 bps, which is still above the +100 bps of June 30, 2007, above the 1H07 average IG index spread of +86 bps, and above the 1H04 to 1H07 average of +93 bps. The 1997-1998 average for IG was +96 bps and the all-time low since the end of 1996 was +53 bps in Oct 1997.
The takeaway in IG is that low spreads can remain resilient in a cyclical peak for a protracted period. The asset allocation shifts of the current period favor IG after a long stretch of yield starvation since late 2008. This could be a market where all-in yield beats fair risk premiums as a decision point and especially as more current coupon debt and higher current cash flow generation comes to market in 2024-2025.
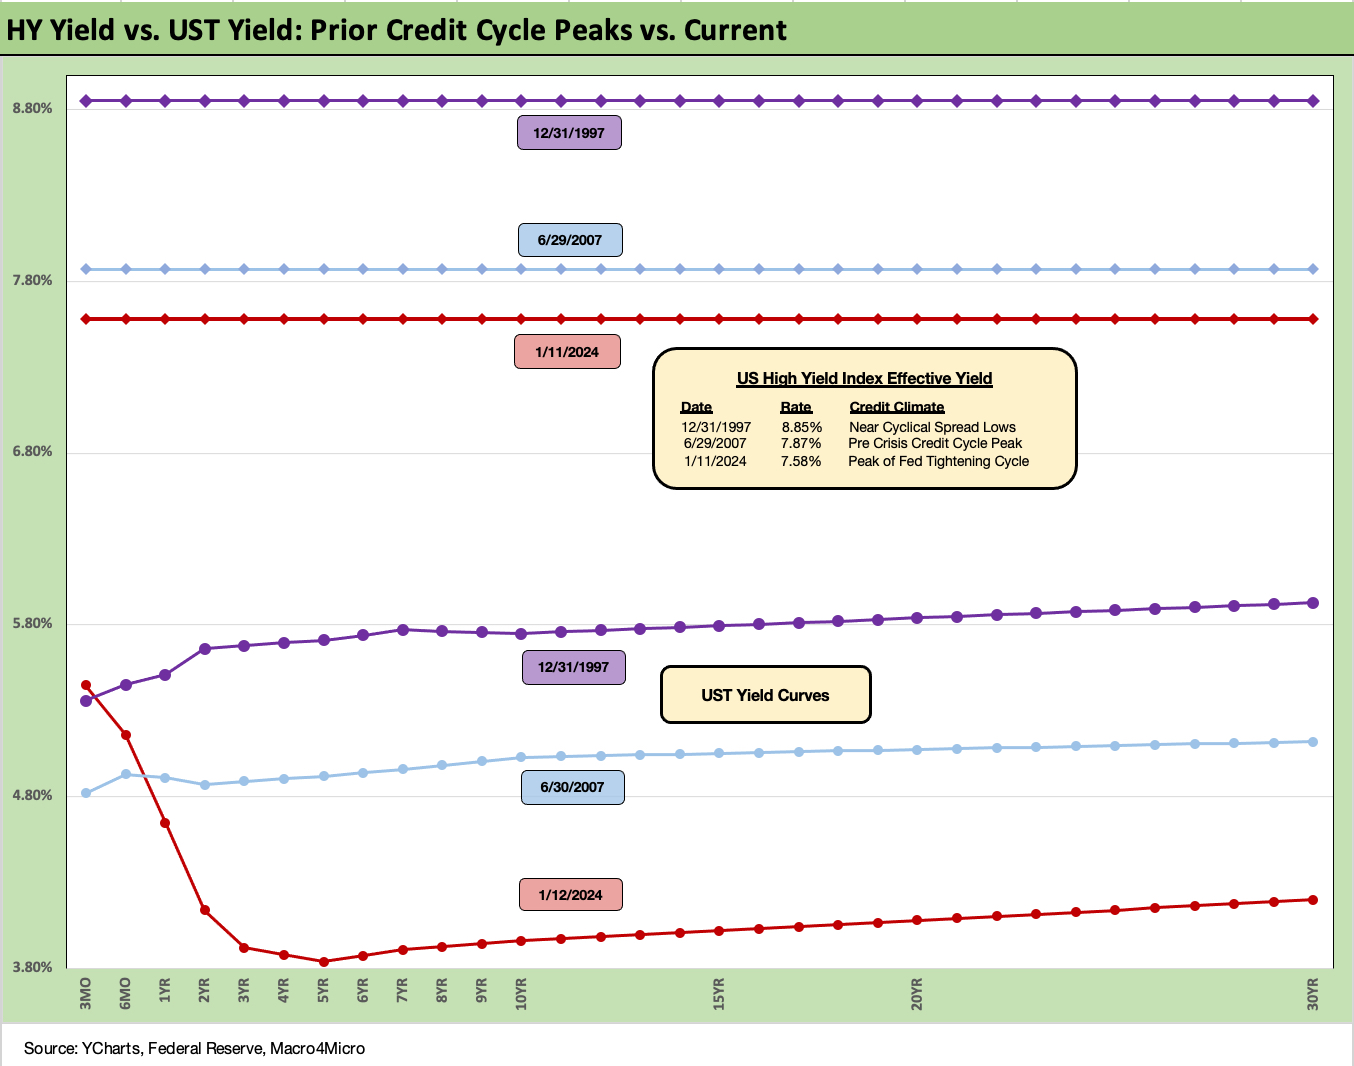
The above chart does the same drill for HY that we just did for IG. We use the 1997 and 2007 periods once again. The 1997 period saw lows of +244 bps in Oct 1997 with averages in 2H97 of +270 bps. The lows of 2007 were +244 bps in June 2007 with a +270 bps average for 1H07.
The past week ended with HY OAS at +356 bps after a -12 bps tightening after earlier widening on CCC tier balancing and spread widening to start the year as we covered last week. The HY markets briefly edged past June 2014 lows (+335 bps 6-23-14) to end the year. HY was threatening to take a run at the early 2018 lows (+316 bps on 10-3-18) but HY has backed off YTD.
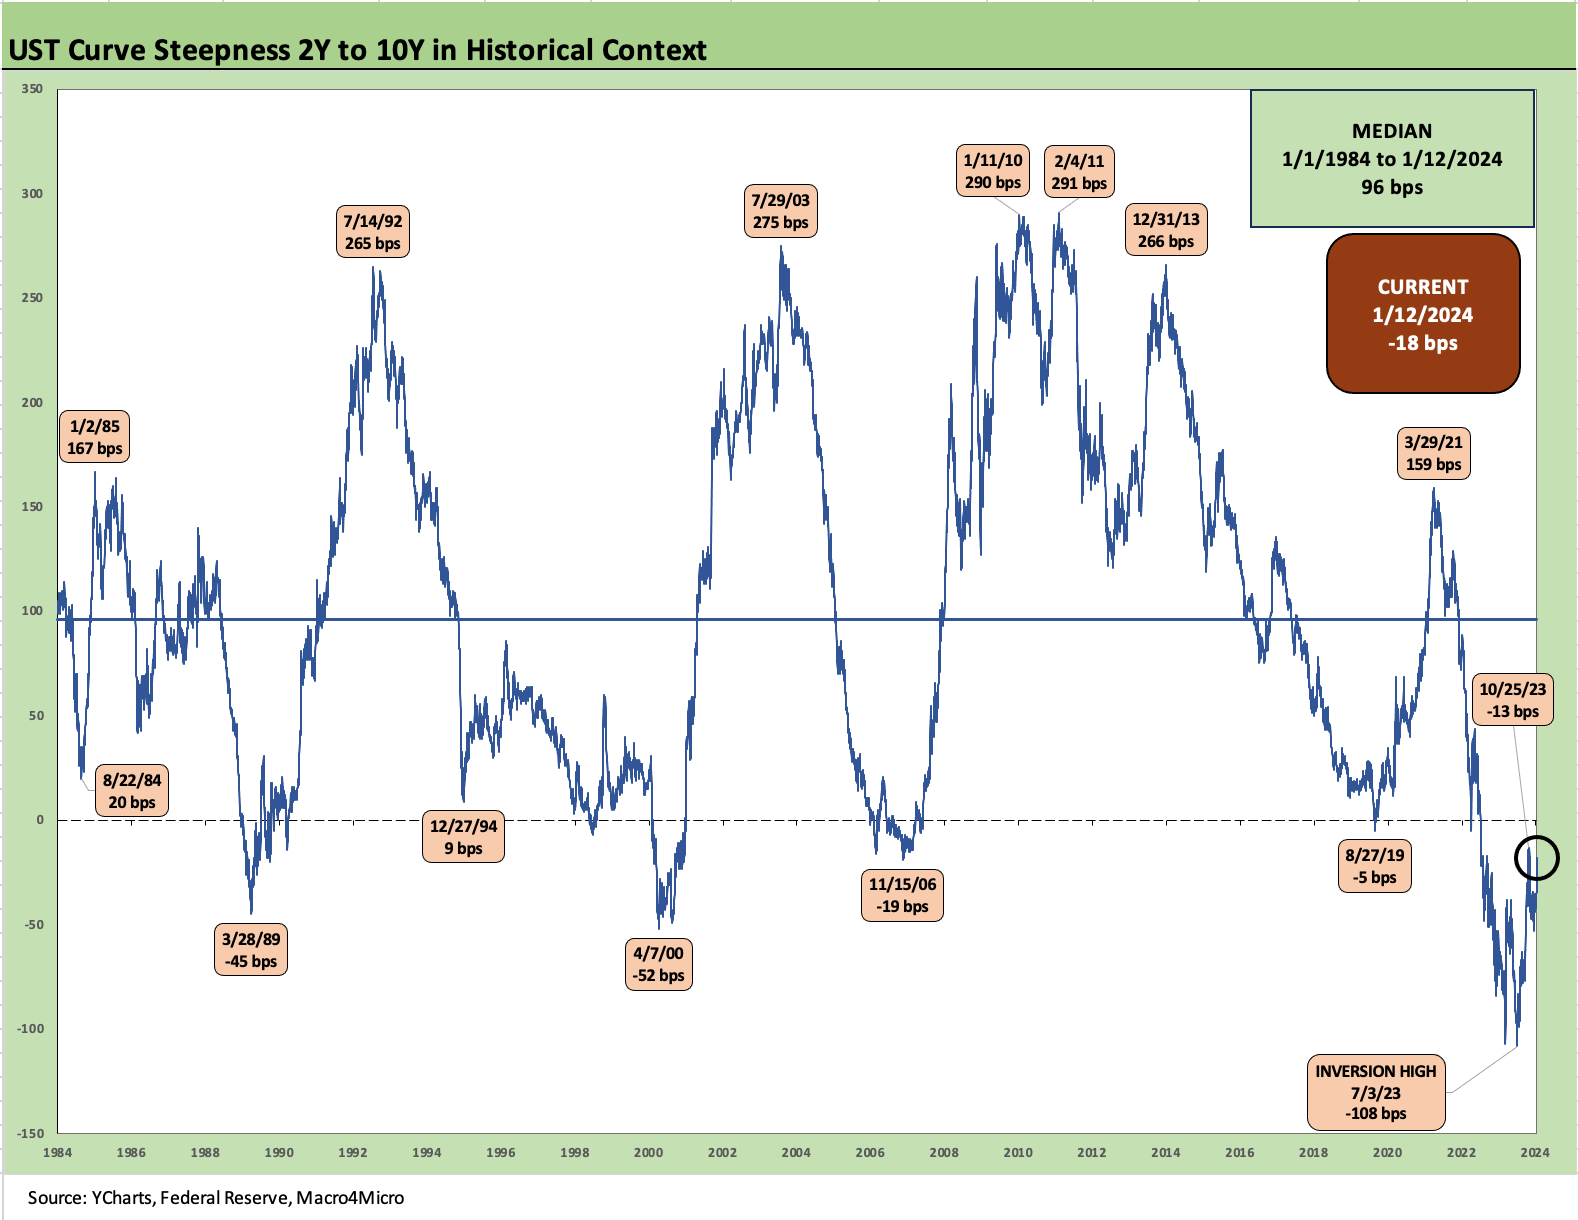
The above chart updates the long term 2Y to 10Y slope from 1984 to the current modest inversion of -18 bps, which is well inside the peak inversion of -108 bps in July 2023.
The long-term median is upward sloping at +96 bps, underscoring how strange the current configuration is and especially when coming off a period of record payroll counts and a 3Q23 GDP growth rate that just was under 5% (see 3Q23 GDP Final Cut: Swing and a Miss on 5%, Good Contact on PCE Prices 12-21-23).
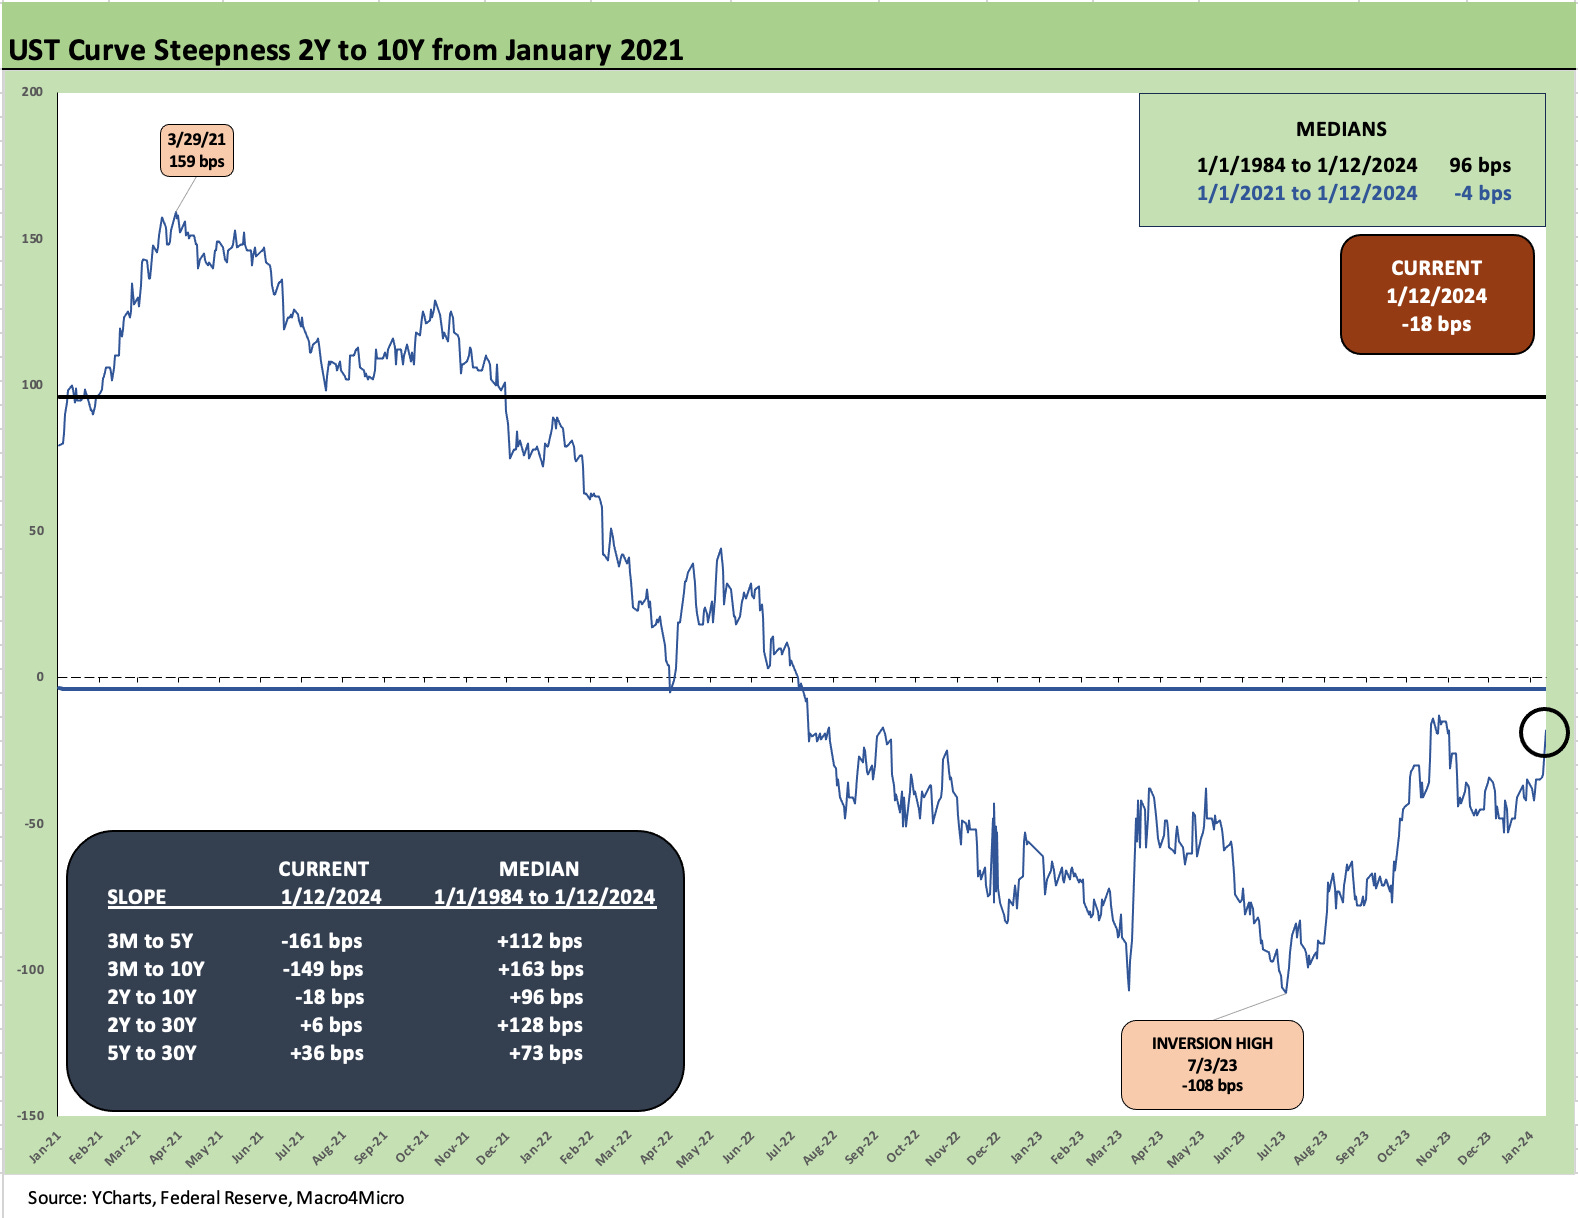
The above chart shows the 2Y to 10Y moves since Jan 2021 with that shorter timeline median posting a slight inversion of -4 bps vs. the long term of +96 bps. We see the move to a bear flattener and then an inversion during the tightening cycle.
We include the main UST segments and related slopes and long-term medians in the box in the chart. There is a long way to go to get back into an upward sloping world.
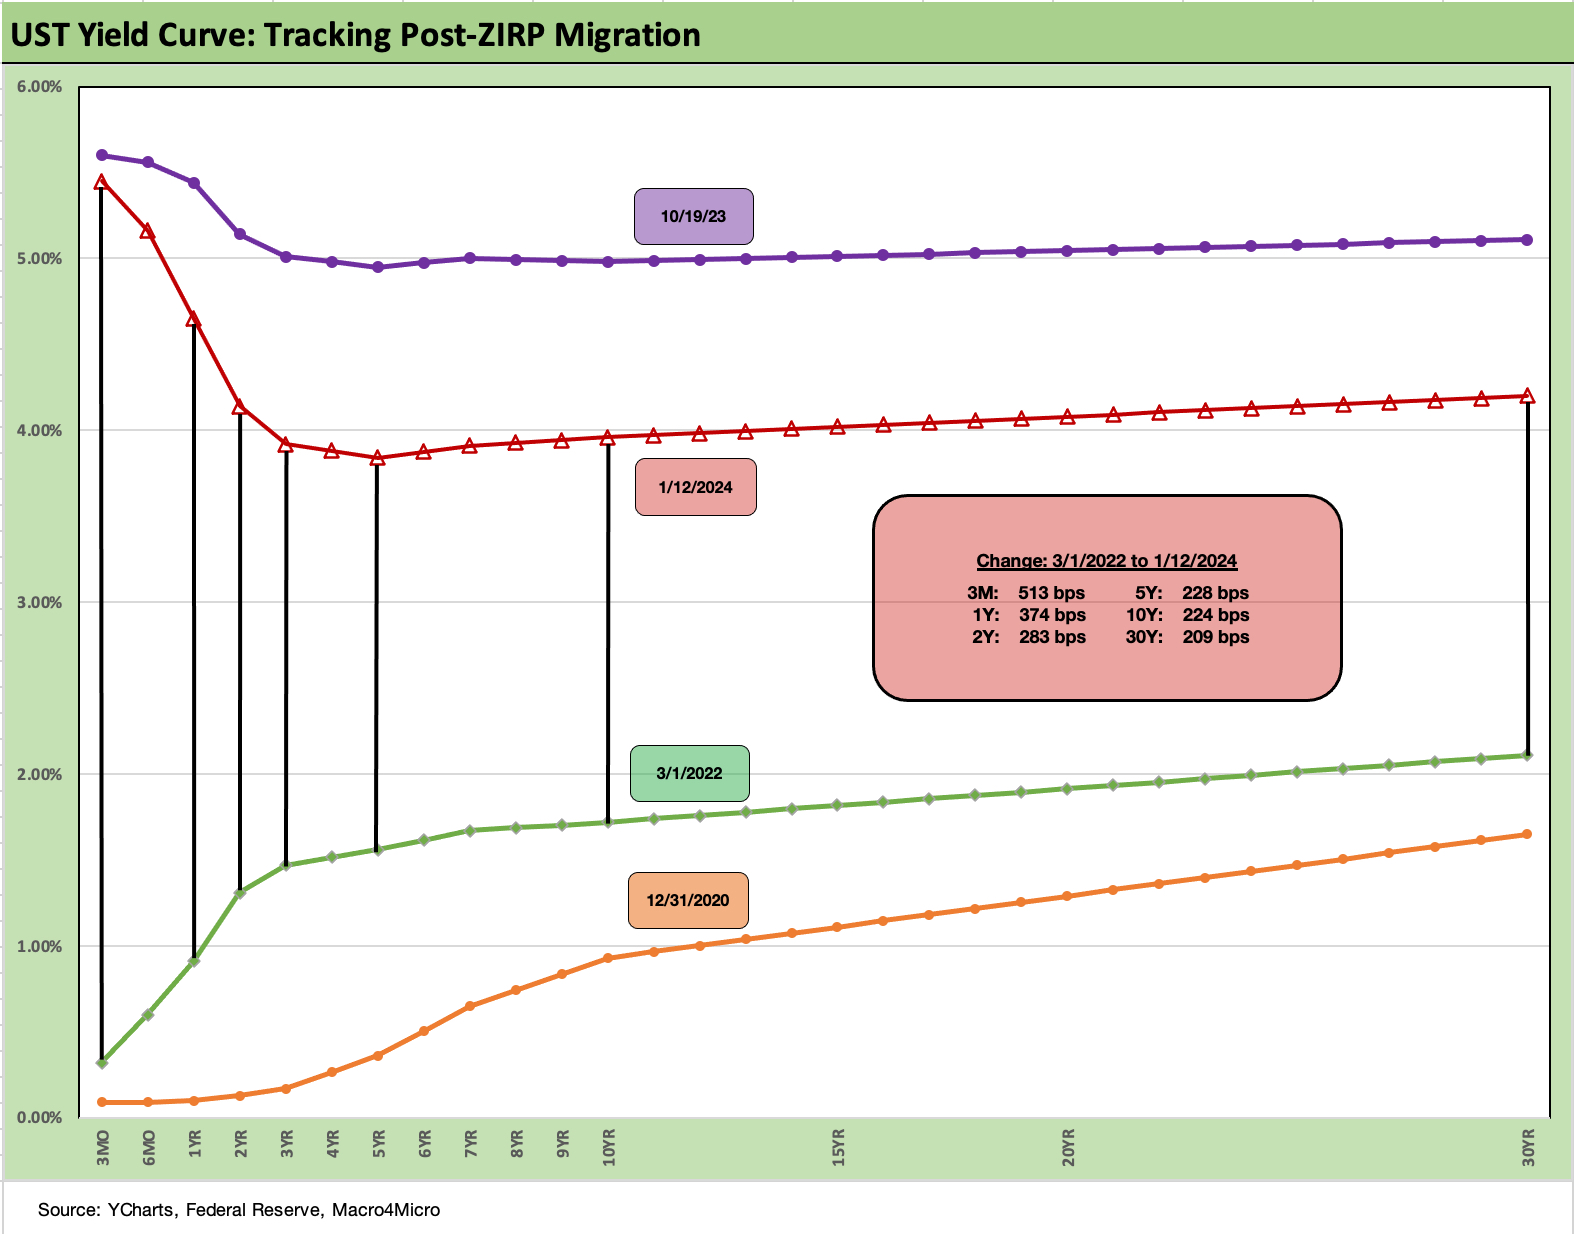
We wrap the piece with our usual UST migration chart from the start of the tightening cycle in March 2022. We start the clock on March 1, but ZIRP ended mid-month. We also break out the deltas in the chart from March 1 after a period that saw a bear flattener roll into a bear inversion to the late Oct 2023 peak ahead of the current UST downshift.
The market awaits more data and more Fed color, but so far the balance of data is not giving more support or clarity to the March FOMC cut the markets expects and is howling for. Of the collection of data releases due this week, we think Retail sales will get outsized attention, but the Industrial Production stats will be useful to see with the ISM in a constant state of contraction indicators. PCE inflation is at the end of the month with Income and Outlays.
See also:
Credit Performance: Excess Return Differentials in 2023 1-1-24
Return Quilts: Resilience from the Bottom Up 12-30-23
HY Refi Risks: The Maturity Challenge 12-20-23
Coupon Climb: Phasing into Reality 12-12-23
HY vs. IG Excess and Total Returns Across Cycles: The UST Kicker 12-11-23
HY Multicycle Spreads, Excess Returns, Total Returns 12-5-23
HY Credit Spreads, Migration, Medians, and Misdirection 11-6-23
Quality Spread Trends: Treacherous Path, Watch Your Footing 10-25-23