
Quality Spread Trends: Treacherous Path, Watch Your Footing
We dig into quality spread trends across the tightening cycle.


We look at the post-tightening quality spread differentials for IG vs. HY, for BBB vs. BB, and for the Hi-Lo range between the BB and CCC tiers.
Starting at Jan 2022, we look at the beginning and recent differentials and the Hi-Lo points in between after inflation fears eased, recession probabilities declined, and credit repricing took a back seat to duration woes.
The Hi-Lo swings reflect the ebbs and flows of the recession debate, early nerves around aggressive Fed tightening, anxiety around oil fallout from Russia-Ukraine, and the regional bank stress.
Quality spreads for IG vs. HY are well inside the wides of early July 2022, BBB vs. BB near the middle of the range, and the Hi-Lo BB vs. CCC differential materially inside the highs of Nov 2022 despite being above the long-term median since 1997.
In this commentary, we update where quality spread differentials have migrated across the Fed tightening cycle of 2022-2023. We start in Jan 2022 and then wrap with this past Friday close (there have not been major shifts this week so far). We frame the composite OAS differential between IG and HY, along the speculative grade divide (BBB vs. BB), and in the Hi-Lo comparison of the upper tier of HY (BB) vs. the bottom rung of CCC and below.
We like to look at BB vs. CCC differentials for a read on how the low and high-end pricing framework is shaping up. Our shorthand term for the gaps in quality spreads on the migration down from the BBB tiers is the “cost of being wrong.”
The use of quality spreads as a concept is straightforward since it quantifies the incremental risk premium received (spreads) for moving down the credit tiers and taking on additional risk. More return for more risk is as old school as it gets.
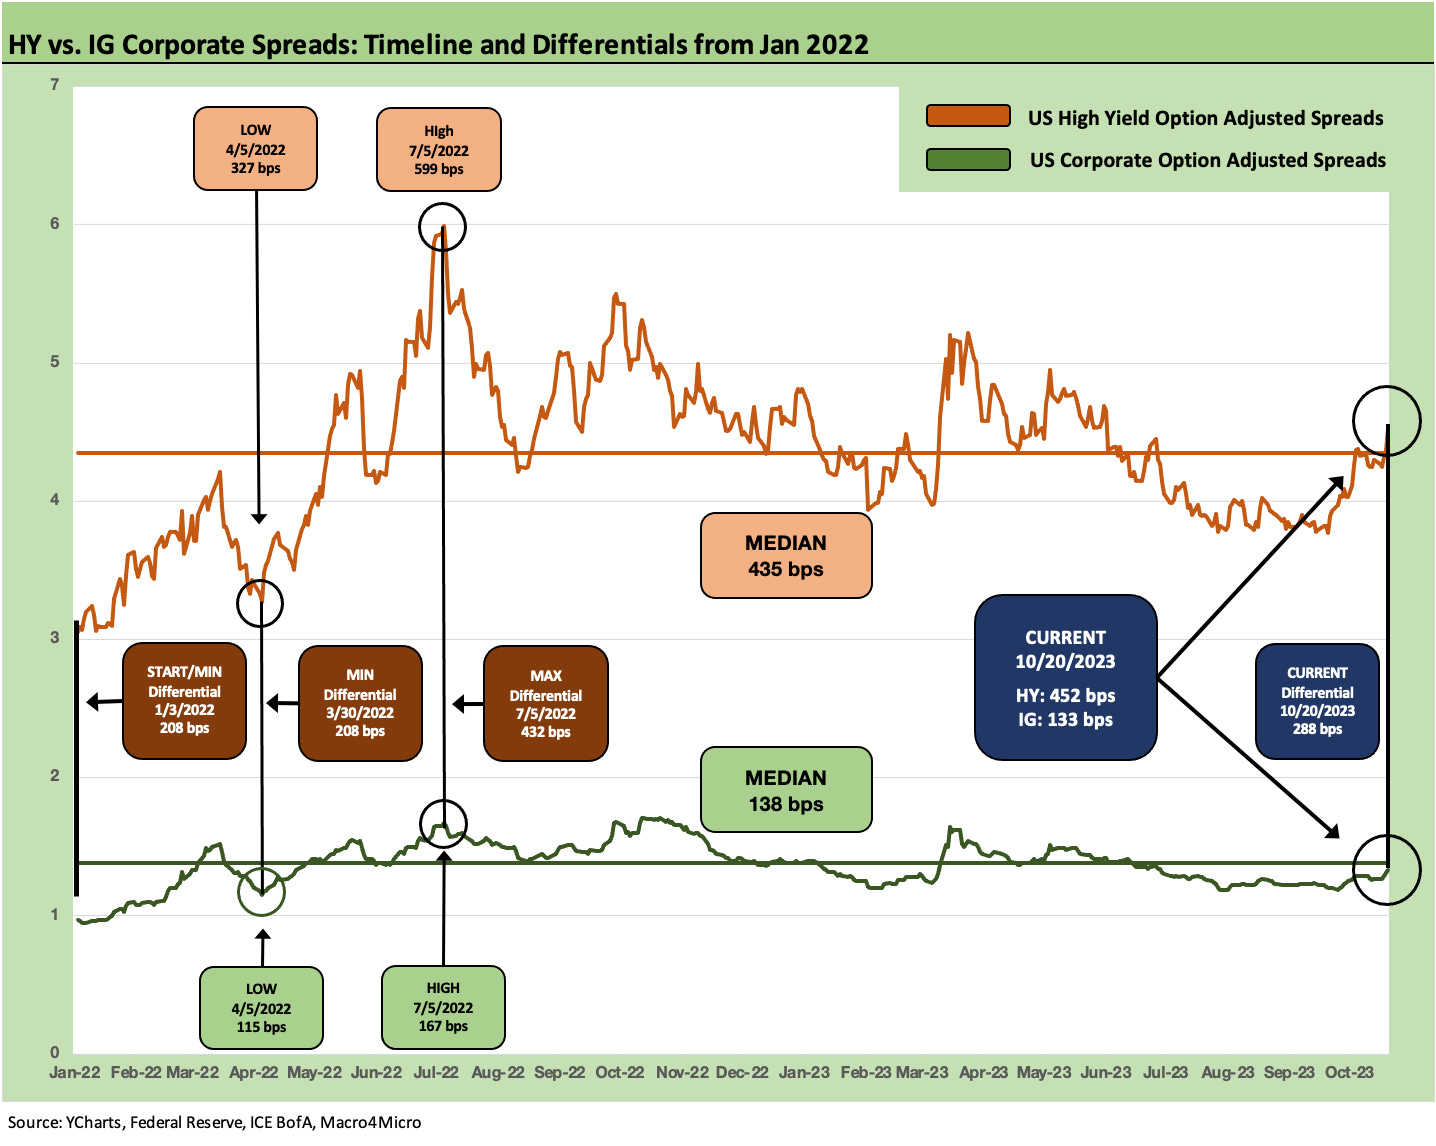
The focus on the compensation for IG vs HY has always been a big focal point in asset allocation, and we see that number now at +288 bps vs. the post-Jan 2022 high of +432 bps in early July 2022. The tights for IG vs. HY occurred on 3-30-22 at +208 bps immediately after tightening started. That low matched the start of the chart timeline (+208 bps in early Jan 2022).
For now, the IG vs. HY differential is much closer to the differential lows than the highs as IG spreads have held in very well. One exception was the period leading into the peak inflation month of June 2022 when the market saw a material widening of HY spreads. We saw both IG and HY rattled a bit in the fall of 2022 as well. At the time, high-conviction recession forecasts were not hard to find.
The Russia invasion of Ukraine and high inflation and material tightening took a toll on HY spreads as HY OAS just missed +600 bps (7-5-22). That is a long way off from the Friday (10-20-23) HY OAS close of +452 bps.
Quality spread widening from the bottom vs. the middle…
We provide links at the bottom for some long-term quality spread review as well. Such timeline comparisons always come with the asterisks of issuer and industry mix. The balance of industry groups (whether defined broadly or narrowly) and issuers across tiers is always dynamic with upgrades and downgrades and expanding balance sheets for some borrowers (for example, post-merger).
Other distortions can include shifts in the UST curve and how that flows into different securities (callability, etc.). The OAS differences are at least a starting point in looking at how the market is reacting to fundamental trends from macro to micro and from industry to issuer level.
As credit cycles start to turn and default cycles start to get built into current pricing, the biggest quality spread threat comes from the bottom up as CCC and “falling Bs” reprice and see some volatility. We got a little taste of that last week (see Spread Deltas: Not Rattled but Vulnerable 10-23-23).
As another example, the E&P implosion of 2015-2016 was a case study in imploding B tier names (and some BB tier names such as Chesapeake). Those can throw off credit tier spread relationships when major sectors are under the gun. There was a bad taste of credit tier distortions back in the TMT and Enron days also as the BBB vs. BB relationship went haywire on crashing BBBs.
As we saw in the crisis stretch of 2008, that middle tier of BBB and BB tier structurally subordinated bank paper can be a source of major dislocations as well, but we don’t see bank systemic stress in developed markets quite so often. We had a stretch in 2008-2009 and then again with a wave out of Europe in 2010-2011 that saw quality spread gapping in “medium grade” rated names. In those cases, the problem names in banks and securities firms. While there was a lag, the bank pressure had a rapid and direct transmission mechanism to the lower tiers of HY on credit contraction risk and more defensive secondary market-making by the street.
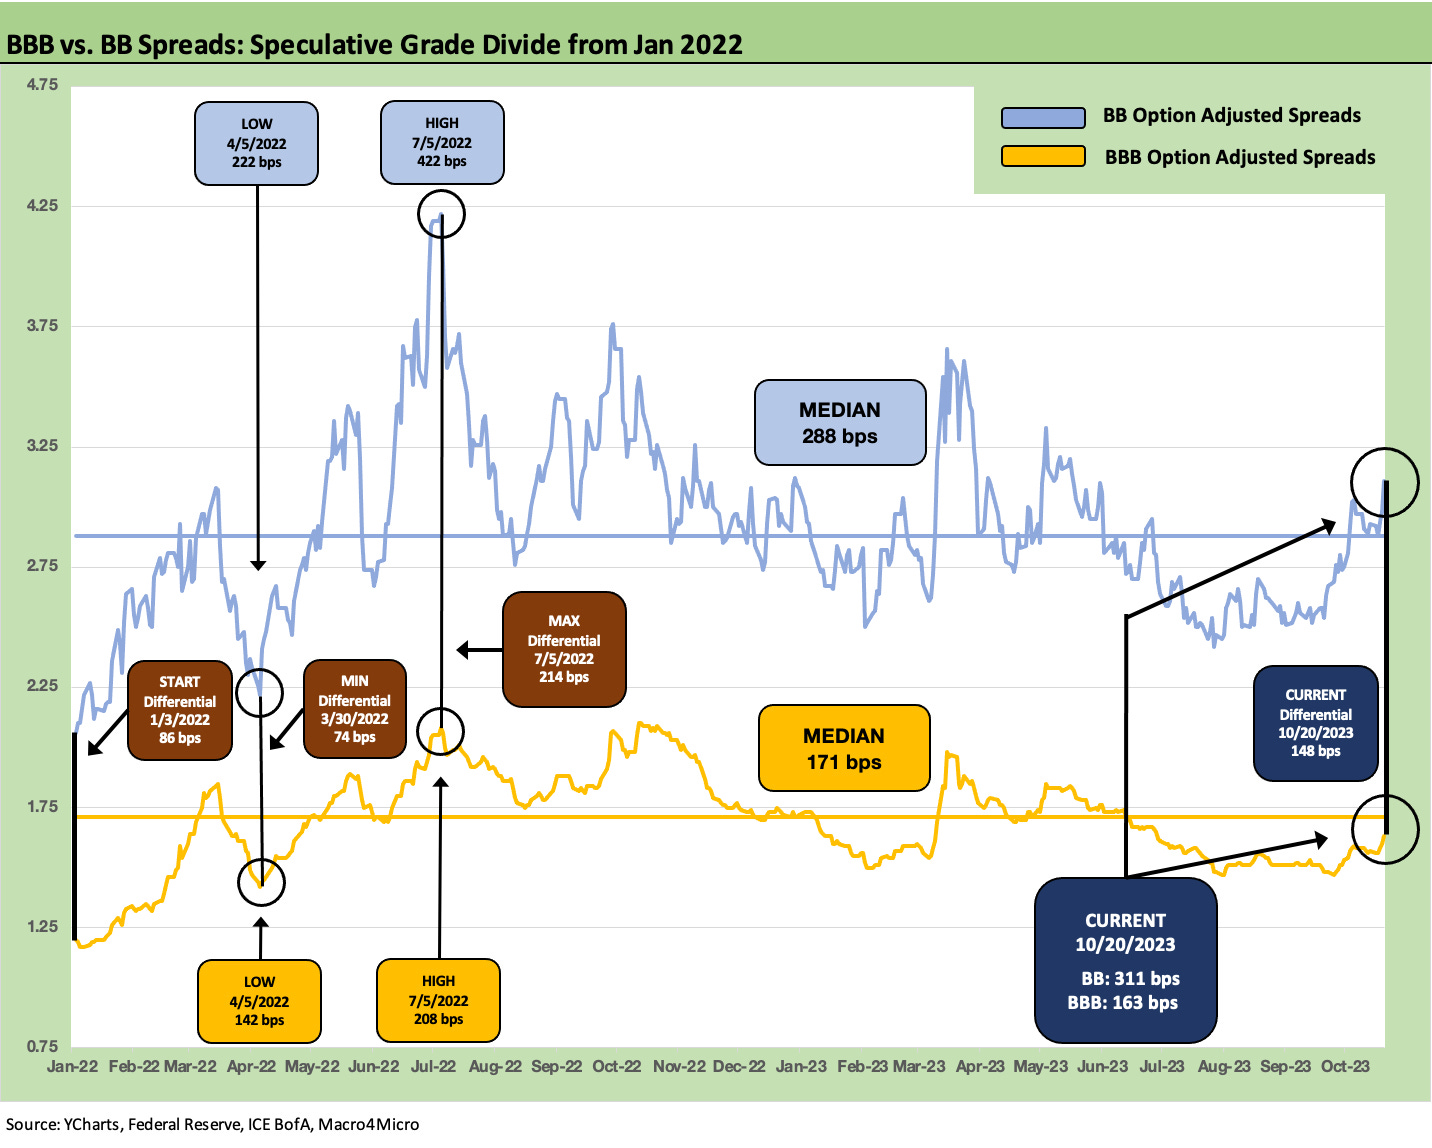
The above chart plots the BBB and BB tier OAS across the timeline while flagging the high, low, and median OAS for each tier. We then highlight the beginning and ending differential along with the high and low differential. At +148 bps on 10-20-23, the differential is inside the high point of the differential (+214 bps on 7-5-22) but a bit more above the low (+74 bps 3-30-22).
In other words, the BBB vs. BB quality spreads are in the midrange area of this timeline but would still need to see a material move wider in quality spreads to get back to the 2022 highs. A macro setback in fundamentals in the form of a consumer shift (jobs, PCE) or a major capex retrenchment (structures, equipment, construction) could move in the direction of wider quality spreads in a hurry. With some good numbers lately and a good GDP print expected on Thursday, that sort of trend is more about the future than the present.
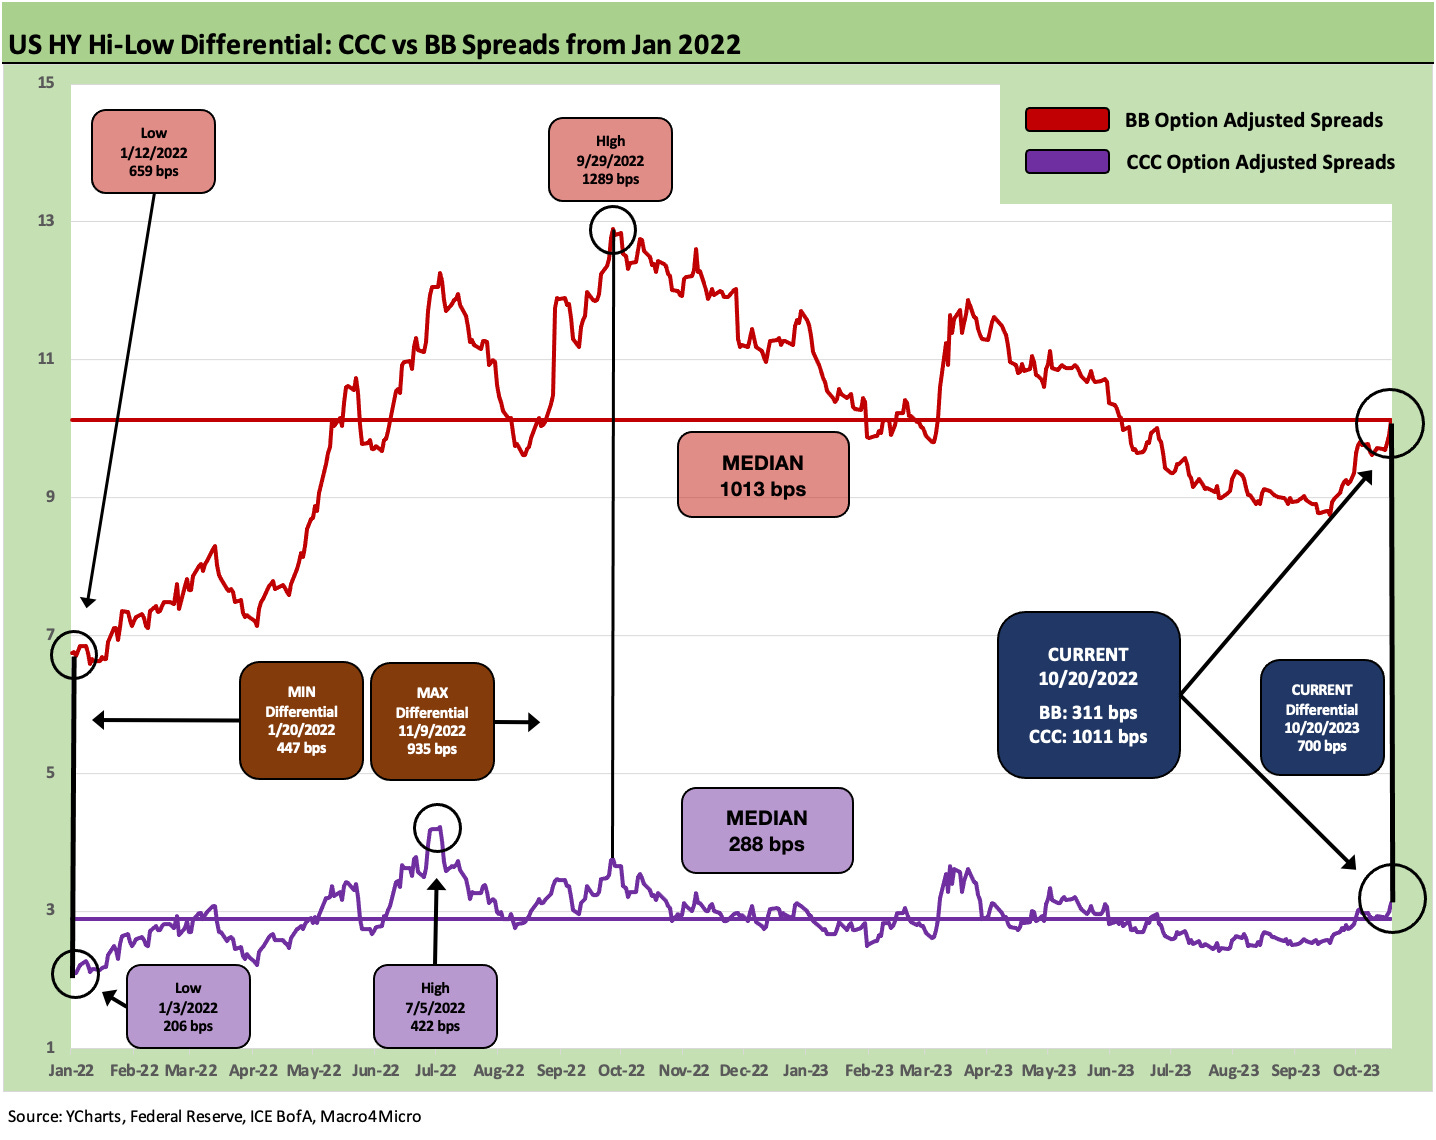
The above chart plots the Hi-Lo differential that captures the risk premium variance between the HY Lite strategy (medium risk mix) and the risk maximization plan (reach for yield and discounts, swing for the fence, concentrate by issuer, etc.). That quality BB vs. CCC spread differential as of now at +700 bps is comfortably above a longer-term median differential that is closer to 630 bps (not shown) but well inside the chart timeline high of +935 bps.
The path taken by spreads during the inflation and tightening cycle saw peak OAS for BB in early July 2022 and a peak for CCC in Sept 2022. The Sept 2022 period saw the max CCC-BB differential at +935 bps with a minimum differential of +447 bps in Jan 2022. That range underscores how quickly the Hi-Lo gap can move with the risk repricing of the CCC tier.
See also:
Market Commentary: BBB vs. BB Quality Spreads Revisited 8-21-23
Credit Spreads: Proportions Matter in Risk Compensation 8-14-23
HY Spreads: Proportions and Risk Compensation 6-28-23
Credit Spreads: Quality Differentials 2022-2023 6-12-23