
Employment Part Deux: Unemployment Claims Update
We look at initial claims and continuing claims in the ongoing employment drill down.


We update the initial claims and continuing claims time series as the market and UST bulls get into “employment watch” mode after a pretty good set of numbers for Dec 2023.
The initial claims-to-continuing claims employment dynamics offer another way to do some easy headline monitoring between monthly payroll numbers with an assist from the 1-month lag in JOLTS.
Continuing claims are going in the wrong direction from the lows with initial claims quiet and both far below long-term medians.
We review a wide range of time horizon medians for some context.
The market will be watching employment numbers closely for obvious reasons in 1Q24 if the UST bulls expect to get their March easing by the Fed. We get clean payroll numbers once a month with no lags (see Dec 2023 Jobs: Not Feeling the Early Ease 1-5-23) and JOLTS once a month with a 1-month lag (see JOLTS Nov 2023: Let the Games Begin 1-3-24).
So far, we are not seeing much to make the case for Fed easing on the employment front, so that ambition will need to get support from CPI and PCE inflation or perhaps some amorphous sense within the FOMC of how the lag effects on earlier hikes are playing out. The FOMC minutes and economist dignitary “speechifying” don’t seem to indicate a consensus or strong conviction on the timing of cuts.
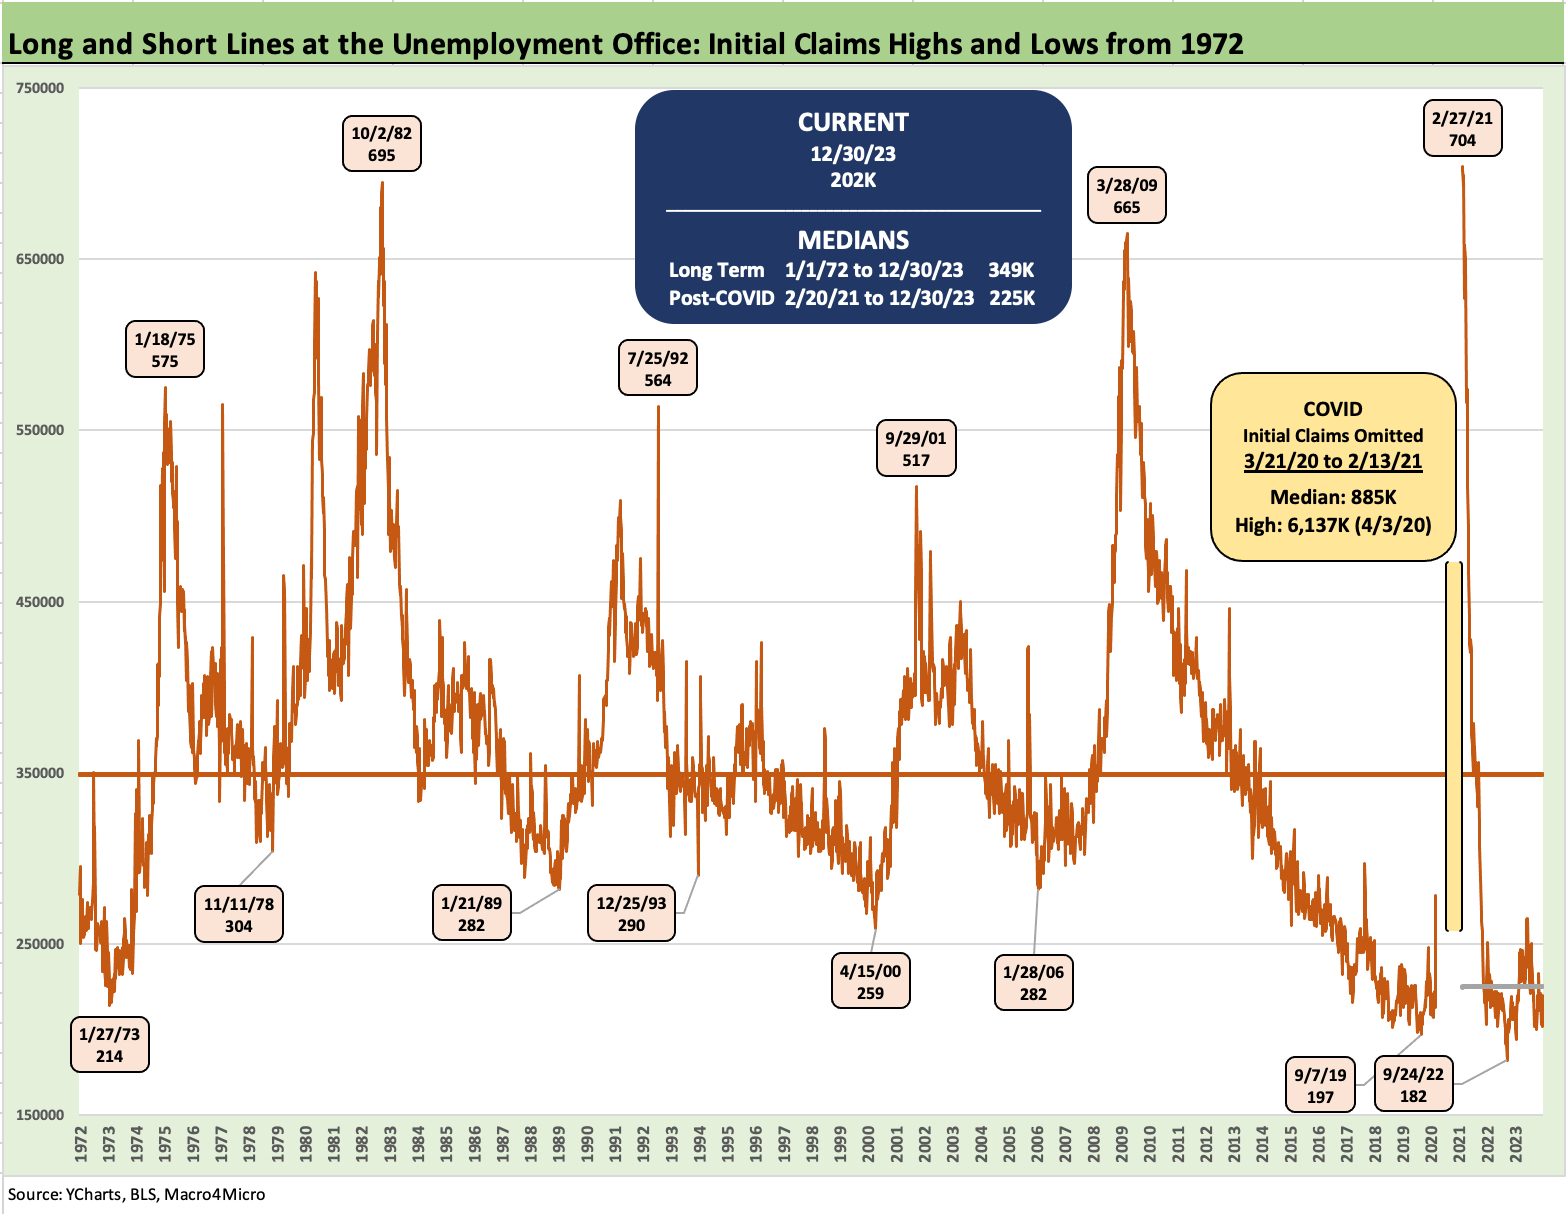
In the meantime, the initial claims trend should be higher for signals of easing as we covered in an earlier historical lookback across the cycles (see What 200K handles on Initial Claims Means (Not Much) 12-16-23). We will give updates as needed, but there is a reason the weekly claims do not get a lot of focus. They are quite low in historical context, and the absolute numbers are also quite low in the context of record payroll counts and a more diversified and less cyclical mix of businesses than we have seen in history.
As detailed in the above chart, the long-term median of 349K is a long way from the current run rate of 202K and the 2023 median of 223K as covered in the chart below. We see a “post-COVID” median of 225K. Note that we arbitrarily chose Feb 2021 as a “post-COVID” start date based on when the numbers came down to reasonable levels after the vaccine and the timing of major stimulus actions. The reality is that the Delta variant raged during mid to late 2021.
There is a lot of room to weaken from such low unemployment rates and curb record high nonfarm payrolls. The pain of the post-crisis period of 2009 into 2011 was brutal and it took quite a while to get payroll back to pre-crisis levels with a lot of help from the Fed and stimulus legislation. The Dec 2007 to Dec 2023 median of 308K is a long way off from the current levels in the low 200K range.

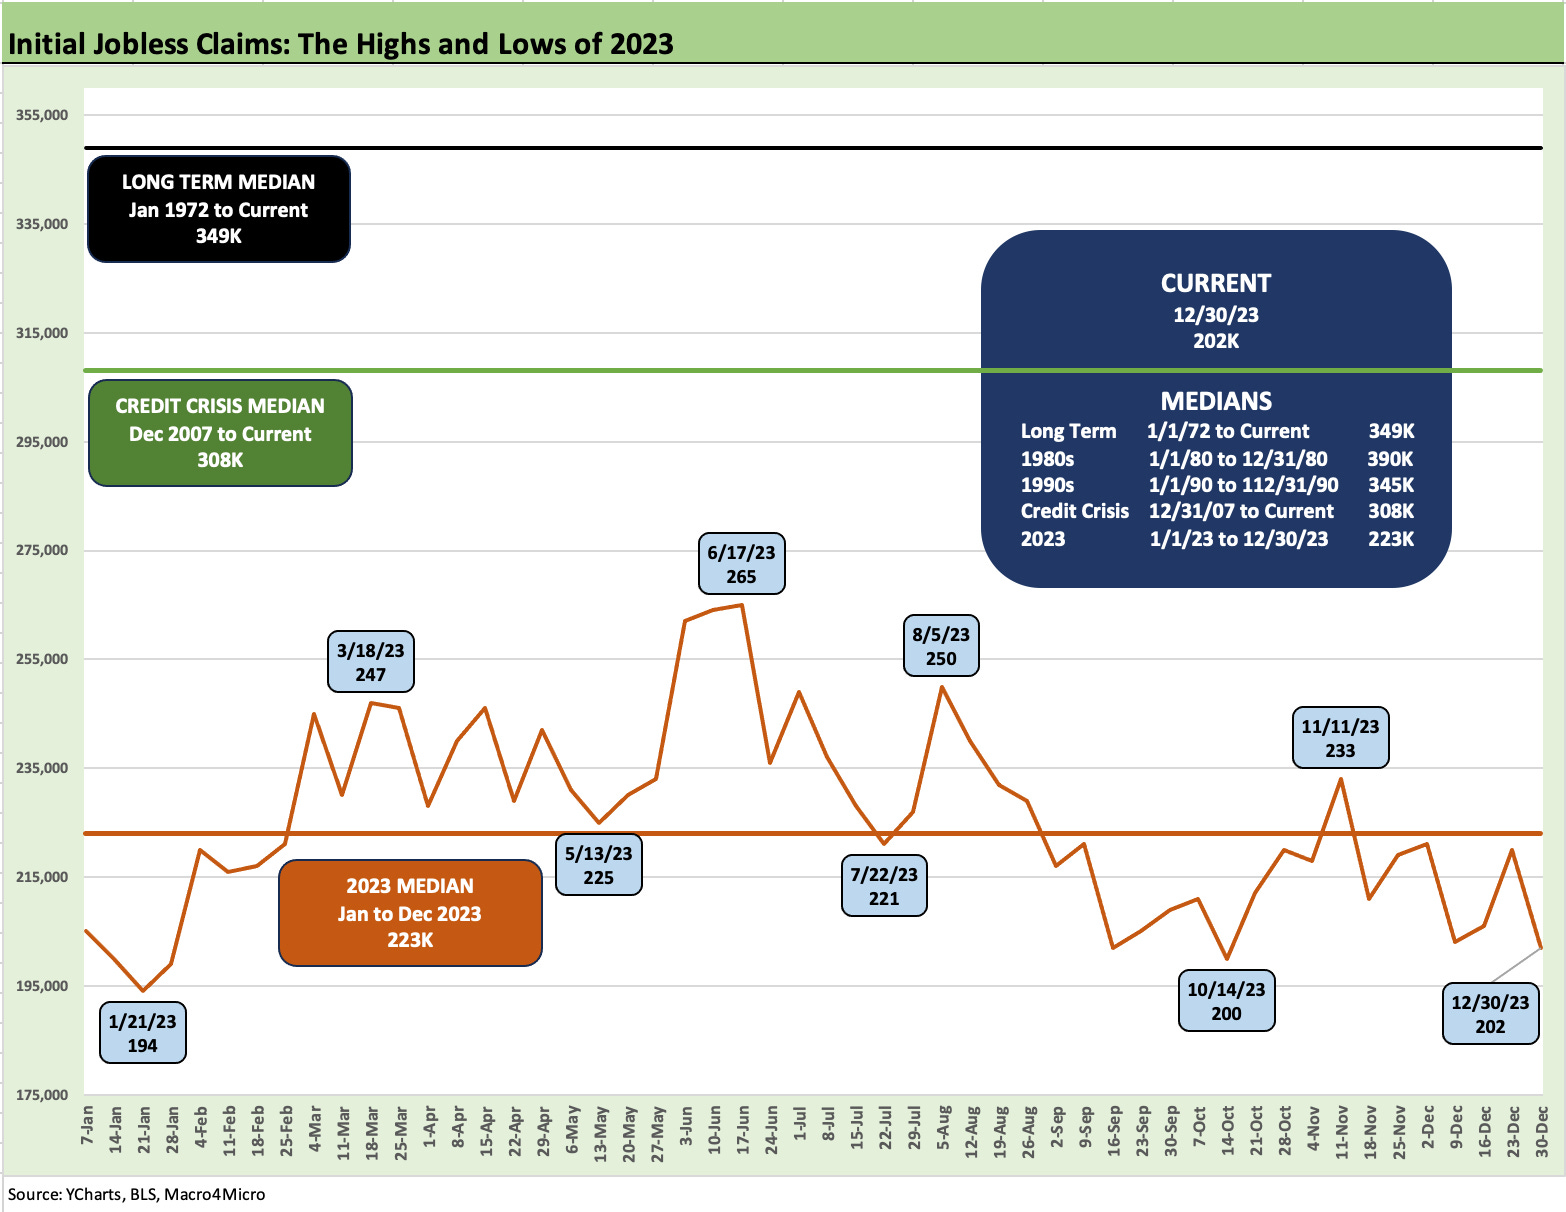
The above chart updates the trend line for the year 2023 with the highs and lows, and we also update a range of timelines for the median mix. The Hi-Lo range for weekly claims only saw a 265K high in June before sliding into the fall. The year ended on a good note as jobs kept rolling in.
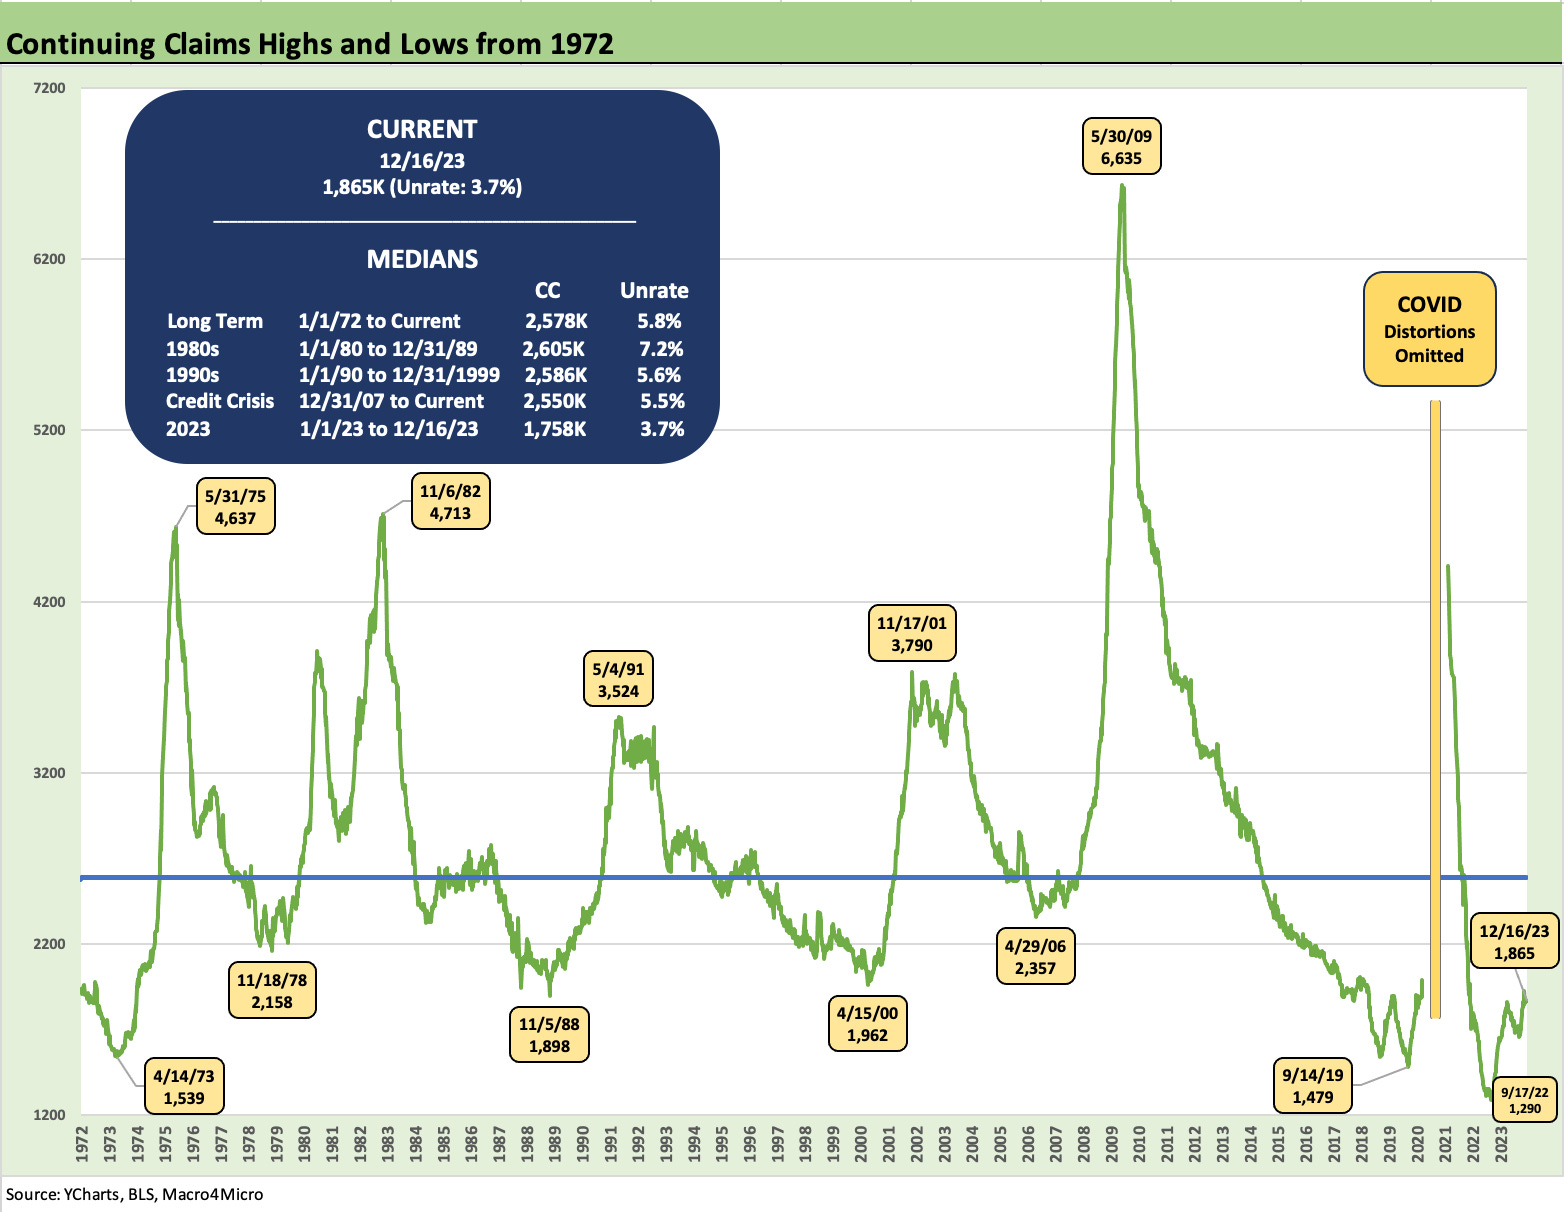
The above chart shows the history of continuing claims. The dynamics are what one would expect. After initial claims, the question comes down to how long the claims get collected and/or when they run out. The post credit crisis stress into a 2009 peak is clear enough in the historical timeline. We omit the COVID distortions from the chart but include them in the median math. Note: see the monthly payroll and JOLTs release commentaries for the COVID history in employment.
We see the lows in Sept 2022 as the inflation pressures and tightening cycle started to wear down on some sectors. We still saw sub-2000 numbers, however, reflecting labor shortages and a desire to retain employees after earlier problems hiring.
Looking back across the cyclical histories, those of us of working age in 1975 and 1982 know those downturns were not fun for friends and family even if some of the worst pain can vary materially by region across those cycles (auto and manufacturing 1980-1982, oil patch after 1986, manufacturing and construction and financials 1990 and later, tech after 2001, everything after 2008).
The above chart shows the 2023 timelines and includes some other historical median for frames of reference. The trend in recent months has been mostly negative in continuing claims, but the absolute numbers are low when compared to 2.5 million to 2.6 million medians in the 1980s-1990s when the payroll count was much lower. That stretched period of unemployment claims in recent weeks is consistent with the JOLTS trend, but the regional and industry mix questions make it hard to nail down.
These are numbers worth updating as the cyclical question marks and soft-landing handicapping will now be a steady exercise across 2024. Right now, Goldilocks is not working late on the numbers and needs to see more weeklies in the high 200 and low 300 range for initial claims numbers to get worried. Similarly, a steady rise in continuing claims numbers might raise some eyebrows for equity bulls and relief the UST curve bulls.
Contributors:
Glenn Reynolds, CFA glenn@macro4micro.com
Kevin Chun, CFA kevin@macro4micro.com