
Footnotes & Flashbacks: Asset Returns 1-28-24
We look at a relatively low drama week for asset returns with UST modestly lower, spreads tighter, and equity benchmarks positive.


The relative strength of economic indicators from the advance 4Q23 GDP to consumer sentiment and spending were balanced enough to be bullish for risk as inflation put another check in the Goldilocks column.
The FOMC game plan and jobs are teed up for more color this week with a fresh round of JOLTS and payroll numbers ahead, so the ability to have a more volatile week would seem to be higher even as inflation trends seem to be tempering the “good is bad” reactions.
The earnings season has been mixed enough to raise questions around growth for some bellwether sectors with Aerospace (Boeing) on edge and Autos set for some important data points after Tesla and Hertz spooked the secular story line on EVs with GM teed up for this week and Ford the following week.
We comment on a rough week for Consumer Discretionary (XLY) and Homebuilders (XHB) and also look at the resilience of the BDC ETF (BIZD) for the rolling month and what it might signal for the hot topic of private credit.
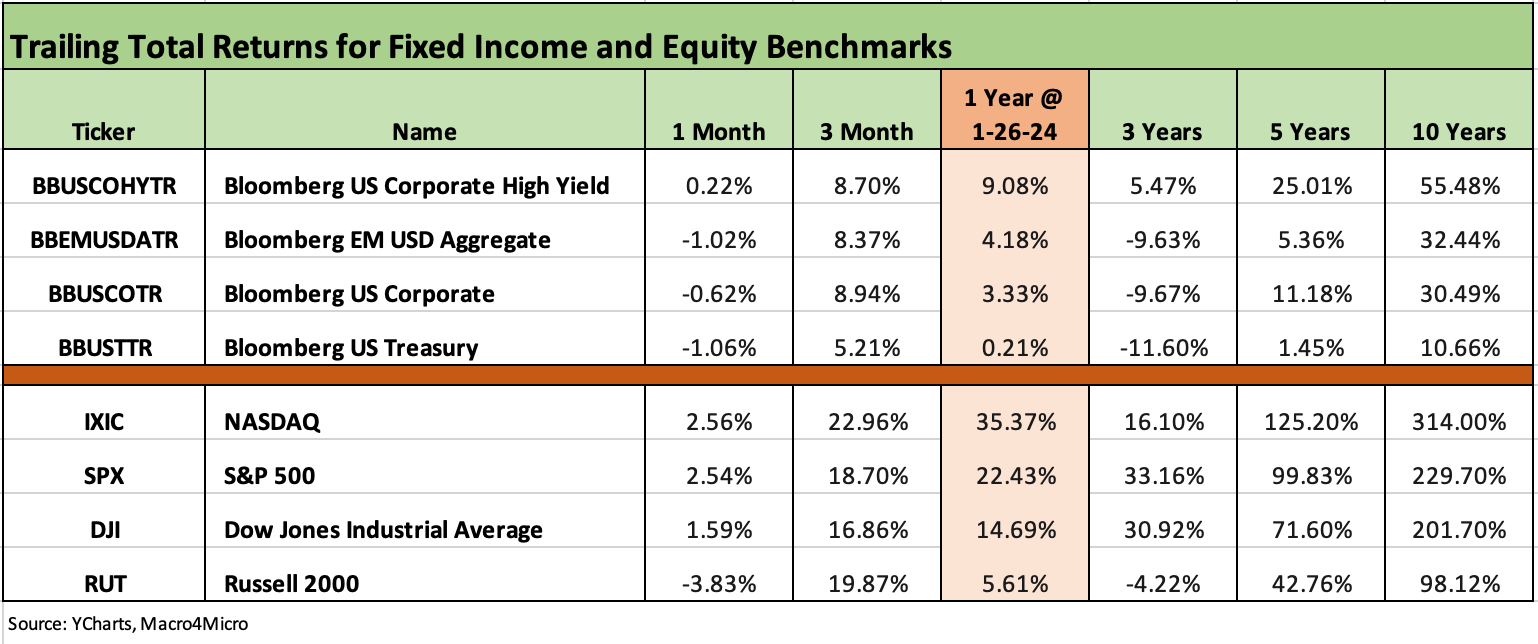
The above chart updates the debt and equity benchmarks we track each week. The chart lines up the asset classes in descending order of 1 year total returns. The big equity winnings for the past year allow those who stayed long to polish their trophies with growth stocks and the Mag 7 heavy S&P 500 showing outsized returns for the trailing year. That is also true for the rolling 3-month period that shows a much broader mix of equities in the rally.
For now, the small caps are off to the slowest start in 2024 of the mix above with the Russell 2000 in the red for the month and is already 6 points behind the NASDAQ and S&P 500.
The month of January has been a slow start for fixed income on adverse UST shifts even if spreads have been friendly (IG) to neutral (HY). HY has been able to generate slightly positive returns, but duration has not been rewarded as we review in the ETF results section later in this piece.
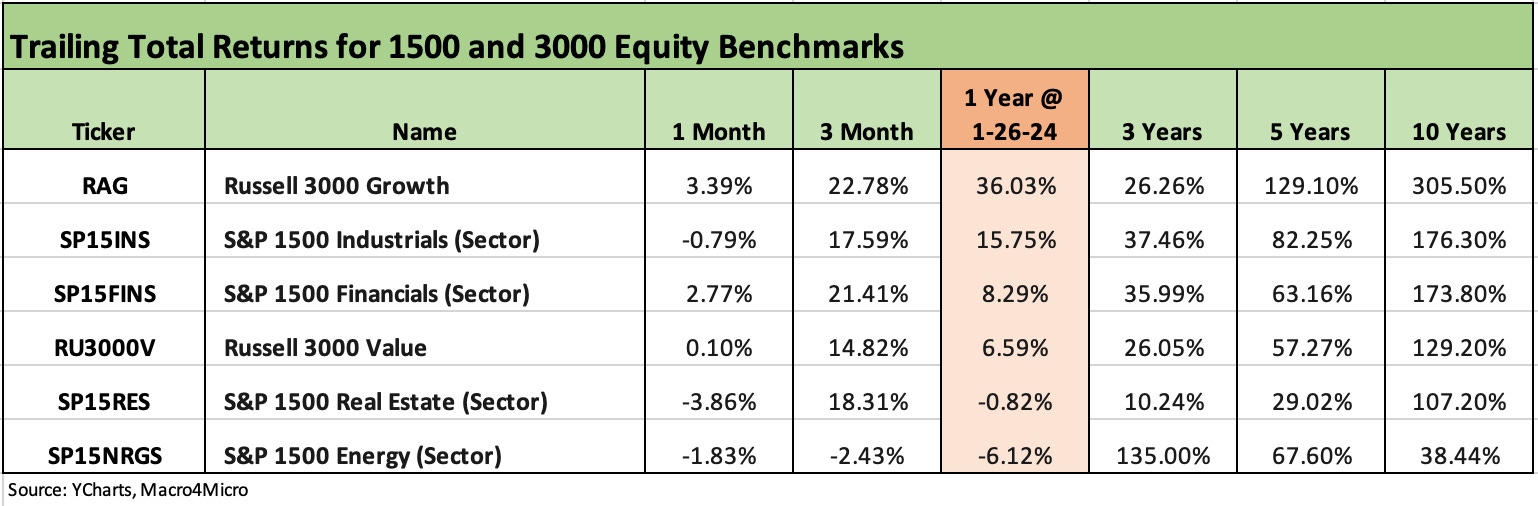
The 1500 and 3000 series show a mixed set of numbers for the rolling month. Growth is winning again as evident in the numbers. Industrials are slow off the mark with earnings season underway, Financials solid, and Real Estate reverting to showing some effects of the mixed UST curve action after a strong Nov-Dec performance. The Energy sector is erratic as always with a soft month including a good recent week as we detail in the ETF section.
The rolling return visual
In the next section we get into the details on the 31 ETFs and benchmarks for trailing periods. The collection of four charts below looks a lot like the recent Footnotes publications except this week we see a shift toward the positive side for the 1-week period after a negative shift the prior week. It will take some weeks to move the needle from the very strong numbers in Nov-Dec 2023, but the weakness is spreading back to more of the benchmarks and ETFs outside of tech. We look at each time frame in more detail in the ETF and benchmark return collection further below.
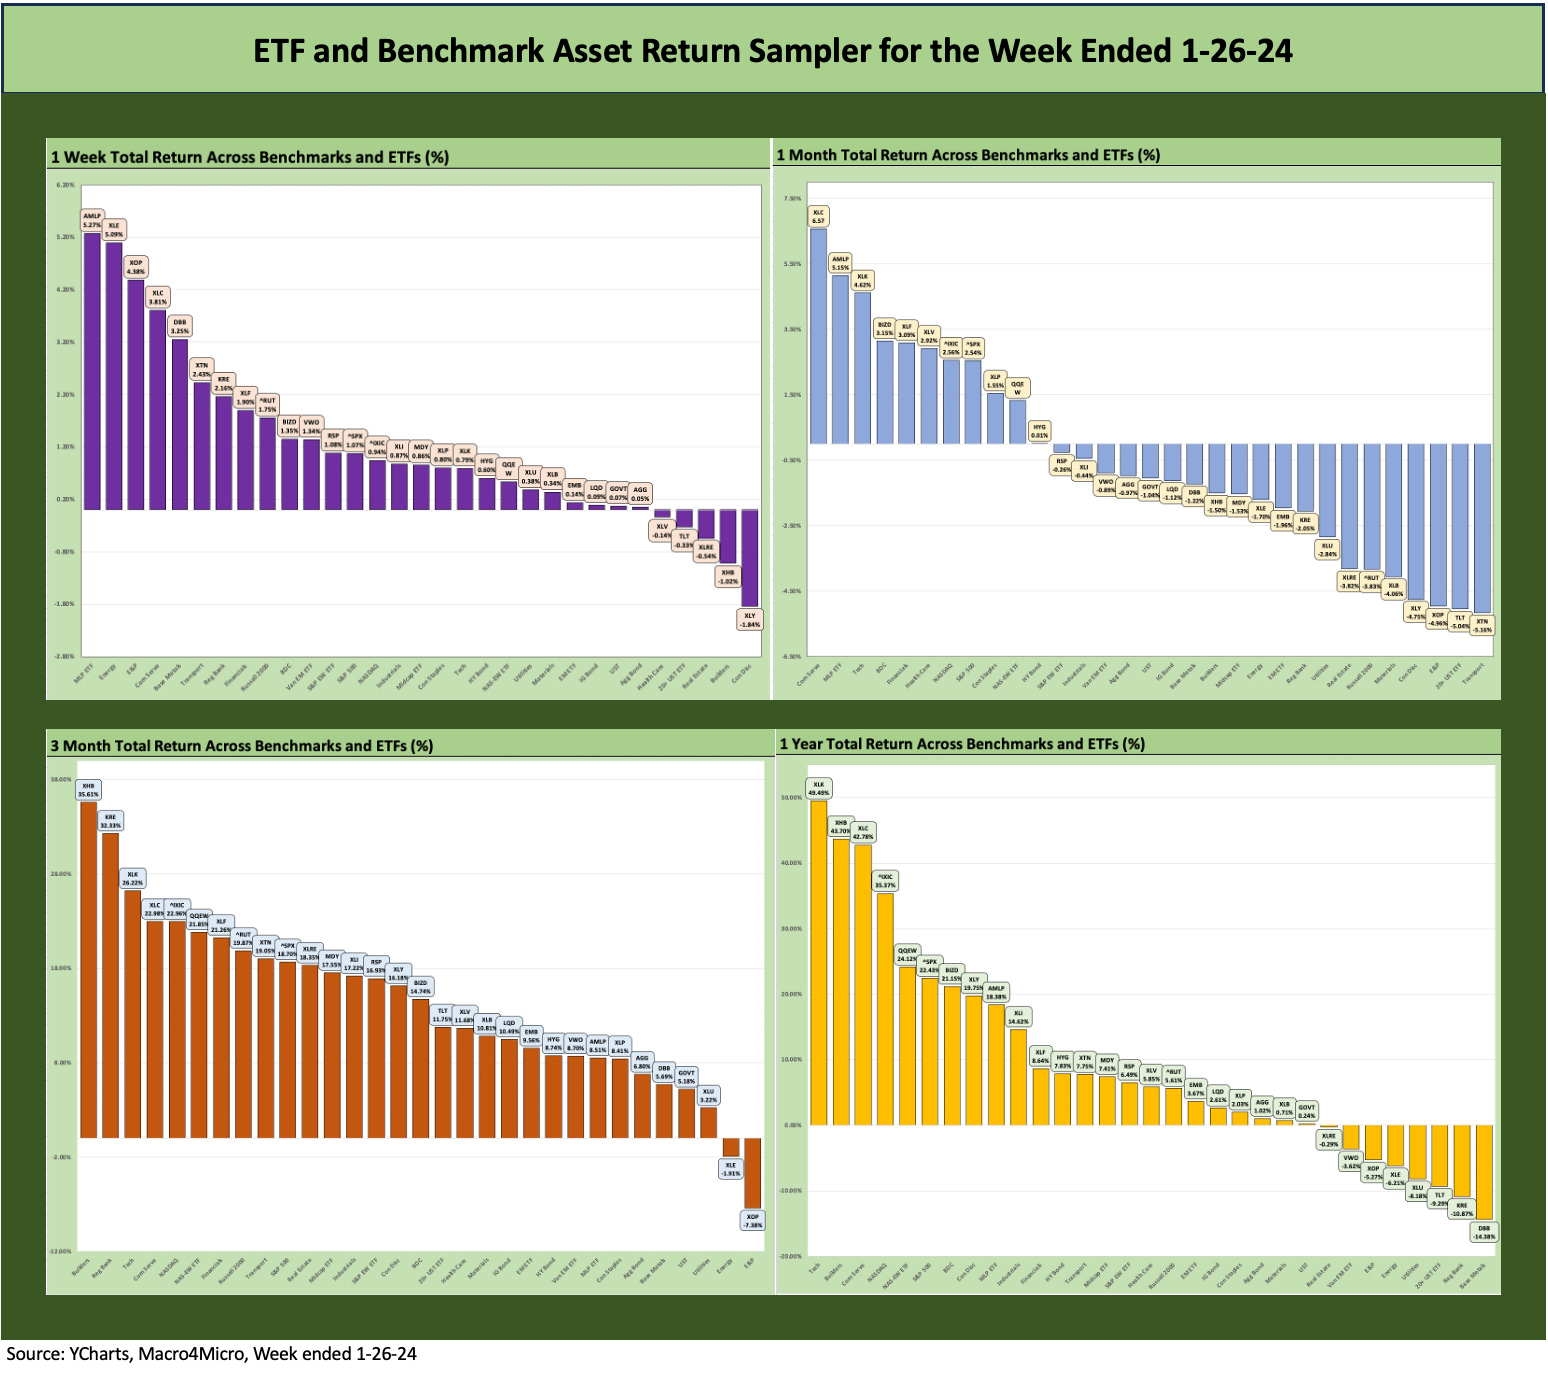
The above chart shows the swing in the latest week back to positive after the prior week was relatively ugly. This past week had much to celebrate including the material surprise to the upside in 4Q23 GDP and 1% handle headline PCE price index for the quarter (see 4Q23 GDP: Strong Run, Next Question is Stamina 1-25-24). We also saw the declining PCE inflation for Dec 2023 late in the week mixed in with solid consumer appetites to spend (see PCE Release Dec 2023: Consumption Strong, Inflation Favorable 1-26-24).
The Magnificent 7 heavy ETFs…
Some benchmarks face issuer concentration elements that leave them wagged by a few names. When looking across some of the bellwether industry/subsector ETFs, it is good to keep in mind which narrow ETFs (vs. broad market benchmarks) get wagged more by the “Magnificent 7” including Consumer Discretionary (XLY) with Amazon and Tesla, Tech (XLK) with Microsoft, Apple, and NVIDIA, and Communications Services (XLC) with Alphabet and Meta.
This past week we saw a big move by a lead name in Consumer Discretionary (XLY) with Tesla.
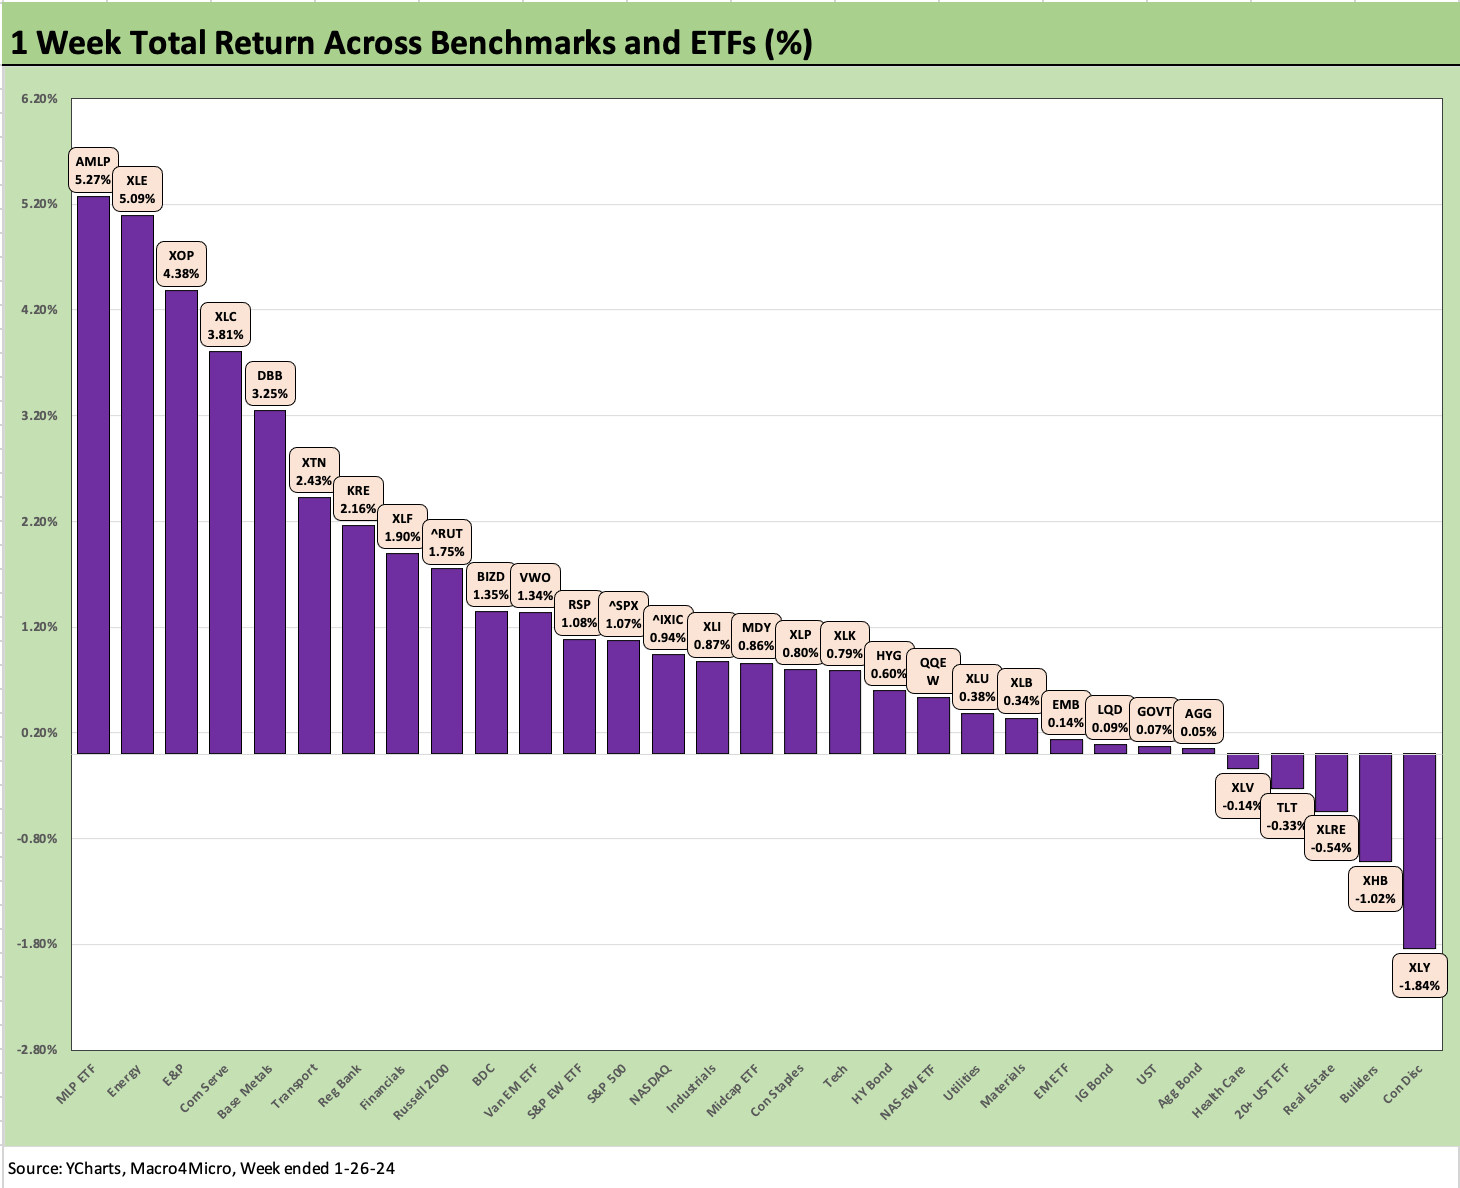
The 1-week time horizon posted a 26-5 score with positive returns dwarfing negative. The major equity benchmarks were all positive on the week with Energy coming out on top with Midstream (AMLP) at #1, Energy (XLE) at #2, and E&P (XOP) at #3. Both oil and natural gas posted a sharp late week increase.
The slight downshift in UST rates in short to intermediate UST edged most of the fixed income ETFs slightly into the black for the week but the long duration 20+Y ETF (TLT) was still across the border on the negative side. Over on the right side, we see the worst performers on the week in Consumer Discretionary (XLY) and Homebuilders (XHB).
Builder equity valuation anxiety…
The XHB weakness came after the #1 public builder in the sector, D.R. Horton (DHI), saw a sharp sell-off on its stock following results and guidance that did not inspire those sitting on massive gains in homebuilder stocks coming out of 2023. The issue around homebuilder (and supplier) equities is more about relative valuation than financial strength. The builders will be better off this year in core fundamentals. Their balance sheets are exceptionally healthy (the #1 and #2 players DHI and Lennar have cash in excess of debt and inventory levels dwarfing total debt.)
With builders, there has always been a tendency of the equity analysts to really fixate on gross margins as the overriding metric, and the builders have seen pressure on gross margins as higher interest rates flow into the cost of sales on multiple fronts. Pricing and incentives are one front, and that had been true in 2023. For costs, capitalized interest rolls into the home expense structure, and the hedging costs can hit cost of sales during times of extreme UST volatility as seen in the 4Q23 spike and plunge.
The hedging practices allow the major builders to use very effective selling tools such as mortgage rate buydowns. That allows the builders to pick up share of the total home sales market (see New Home Sales Dec 2023: Endurance Counts 1-26-24).
Such financing costs flow into the expense line in a manner we see in auto financing incentives with new car sales. It is a marketing cost that affects the profit per home. Different instruments, but that is the same concept as auto financing. It is an important competitive advantage for builders.
The direction and timing of UST curve shifts can help or hurt margins. In the end, if interest rates ratchet lower, there will be some quarterly mark-to-market risk, but demand and affordability will improve and the housing cycle will extend with larger numbers coming back into the market.
TSLA and its growth and margin math rattle holders…
The most notable loser on the week was the Tesla-heavy Consumer Discretionary ETF (XLY) as Tesla was pounded on concerns around its growth trajectory, run rate on margins, and how any longer-term mix shift with lower price EVs will play into the margin trend line. Some brand name street followers of the company did not like what they heard on the conference call, and the market may be bracing for some more negative color on the EV market from GM this week and Ford the week after.
The TSLA 4Q23 earnings call noise came soon after Hertz indicated it was cutting its EV count after announcing its EV fleet strategy with so much fanfare in 2021 and again in 2022. The HTZ EV news was perceived as a big positive headline at the time, but now the major headline is a negative.
Fleet concentration and mix issues are what got Hertz into trouble back in late 2016 that it struggled to recover from, but this latest EV issue does not affect the broader used car market (and other rental operators) the way the 2016-2017 Hertz fleet setback did. Back then, used car values were roiled during the ensuing fleet realignment by Hertz.
Used EV valuations and the mechanics and logistics of remarketing (and recycling) will be a thorn in the side of the EV story line that will need a lot of clarification as fleet turnover or returns increase in the future. There are a lot of issues on that topic showing up in the trade literature. That is a topic for another day.
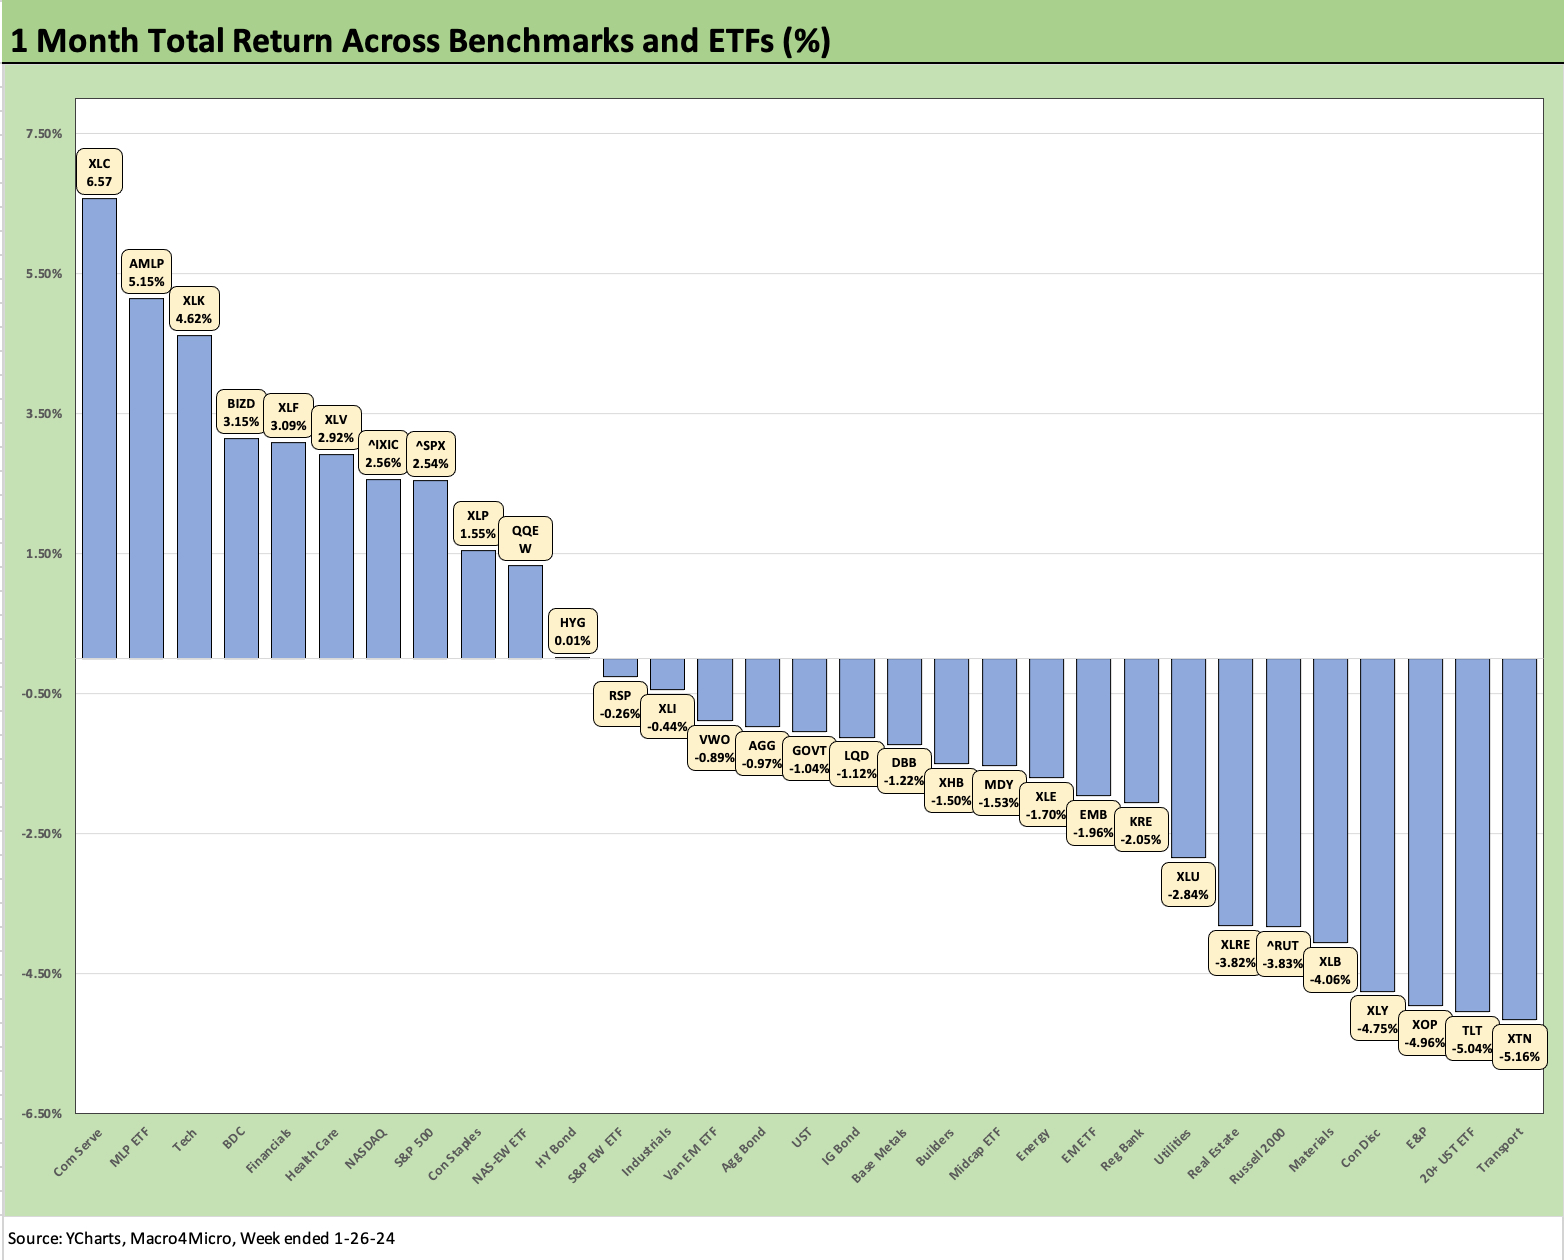
The 1-month time horizon keeps shifting in the wrong direction as the measurement period puts the Dec 2023 rally behind it. At the end of Dec, we saw only one line item negative (AMLP), but last week we saw 20 of the 31 negative. The above chart is at 20 negative again including 5 of the 6 fixed income ETFs (AGG, GOVT, LQD, EMB, TLT) with only HYG positive (barely).
The big winner is Communications Services (XLC) with the Big 2 of XLC (Meta and Alphabet) materially outperforming and Netflix hitting a grand slam. Among the notable and resilient of the better performers is the BDC index (BIZD). The same is true for Financials (XLF) after an earnings season that reassured on fundamentals. In the case of loans (for BIZD and XLF), the recent news flow might also have reassured that the floating rate repricing might be slower than expected.
For BDCs, the private credit and direct lending headlines are weighing very heavily toward private credit (BDCs or much bigger private portfolios) being a destination of choice for a lot of AUM allocation (notably retirement and pension) and a strategic focus for originators. For the skeptics, that often means “head to the bomb shelter and brace yourself for excess.”
For those more confident that immediate discounting of assured excess and imprudent lending is only for those lacking due diligence skills, those with well-conceived investment time horizons and manager selection processes do not have to assume all points head toward Armageddon. There are usually winners and losers in growth markets. It is hard to argue otherwise, and the performance of BDC equities shows both winners and losers.
There are always legitimate concerns around emerging asset classes. It is not clear to me that private credit is such a “new new thing” since leveraged finance has been around for decades. When I started my career in credit in the early 80s, it was in a private placement area in an insurance company that was doing a lot of LBOs and taking on higher risk credit (before the KKRs and Drexels of the world disintermediated them out of it). The credit assets and structure may be different, but higher risk private credit with minimal secondary liquidity is not entirely new by any stretch.
BDCs still strike me as the front door of the private credit market that opens into the lair of the elite credit managers under whatever major brand name umbrella they live under (private equity, leverage finance managers, etc.). Those managers have skin in the game to not screw up their BDCs since that will be the easiest way to monitor their skill sets when they come looking for your billions for their other, over-the-wall portfolio gathering exercises.
The challenge will be about the scale of investible funds (demand) vs. the amount of reasonably priced risky debt (supply). The phrase “putting money to work” can at times be like a 1980s flashback as AUM grows. That is when things get sketchy. That is true in any market whether stock IPOs or HY bonds. The challenge is similar either way. Do your homework and monitor performance.
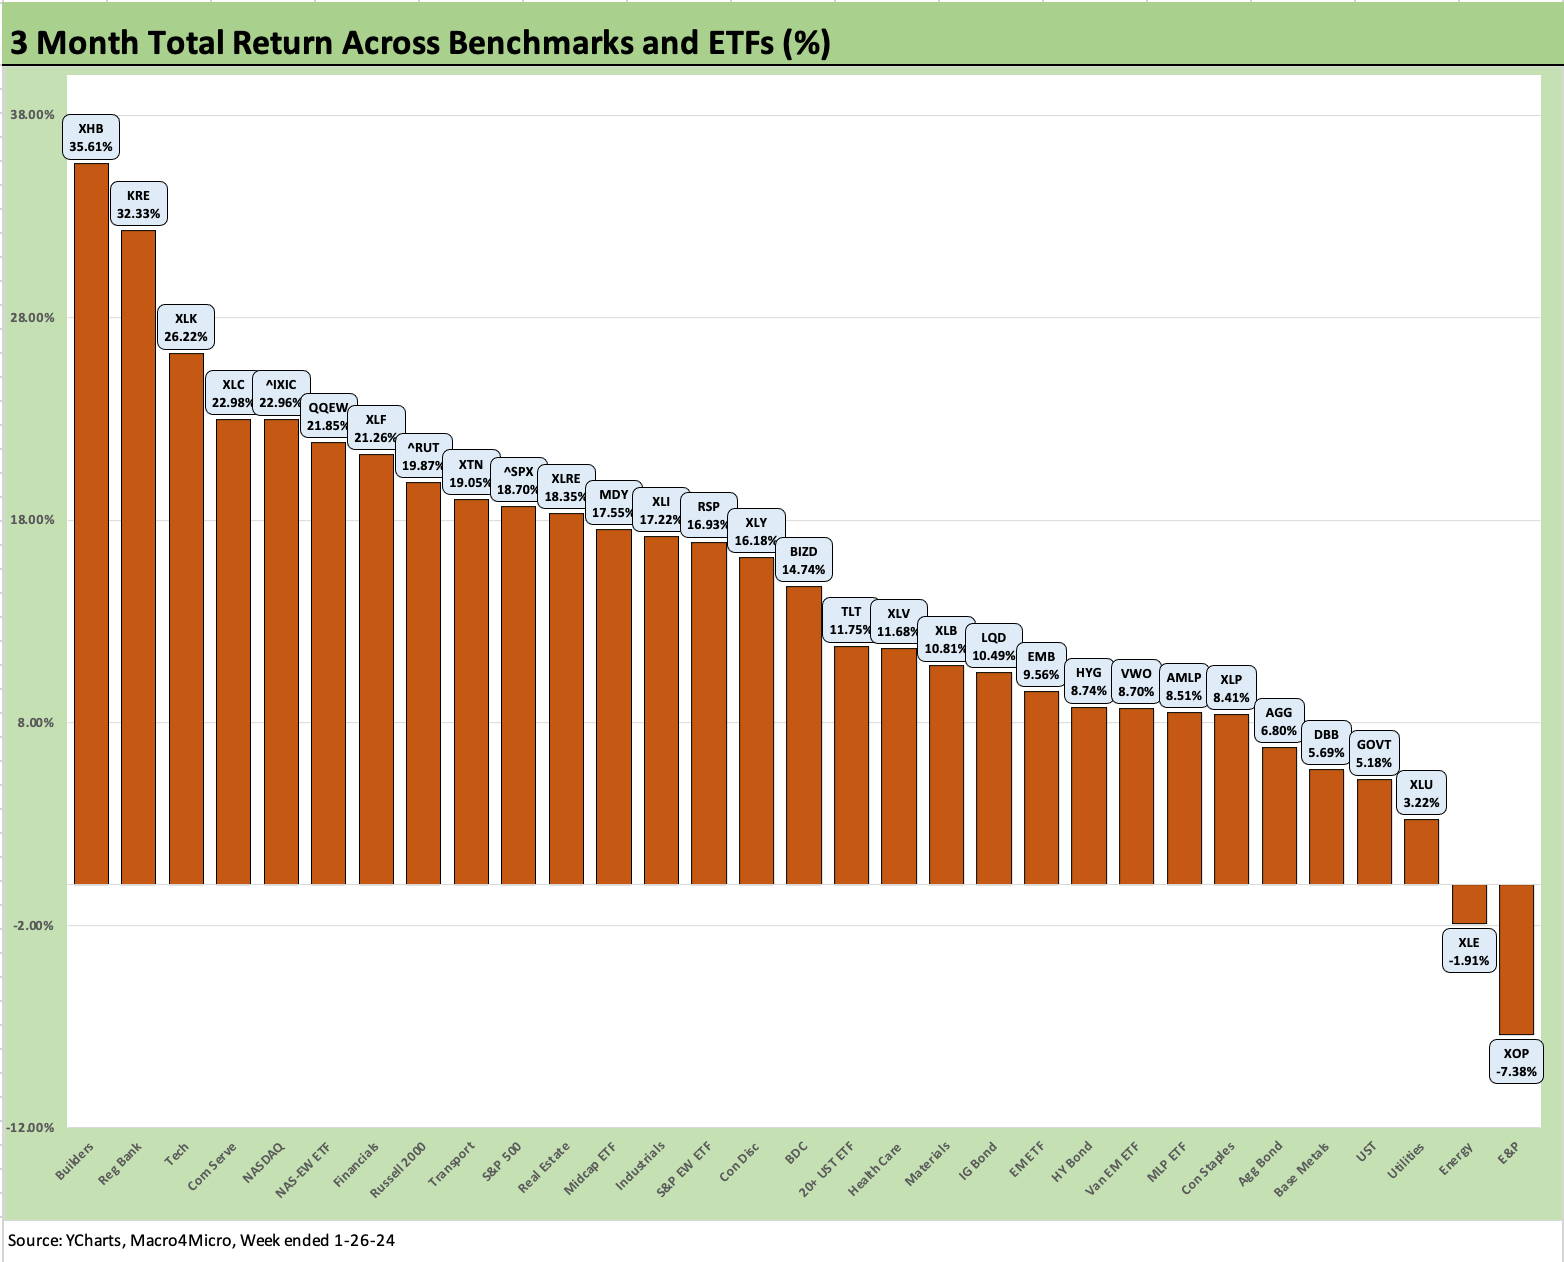
The 3-month performance is still holding on with only 2 negative and a 29-2 score as the big Nov-Dec rally holds the line. XHB is at #1 despite the soft performance the past week. The two energy laggards, XLE and XOP, rallied this week but are still sitting in the red after running at double digit negatives for the prior 3-months in last week’s update.
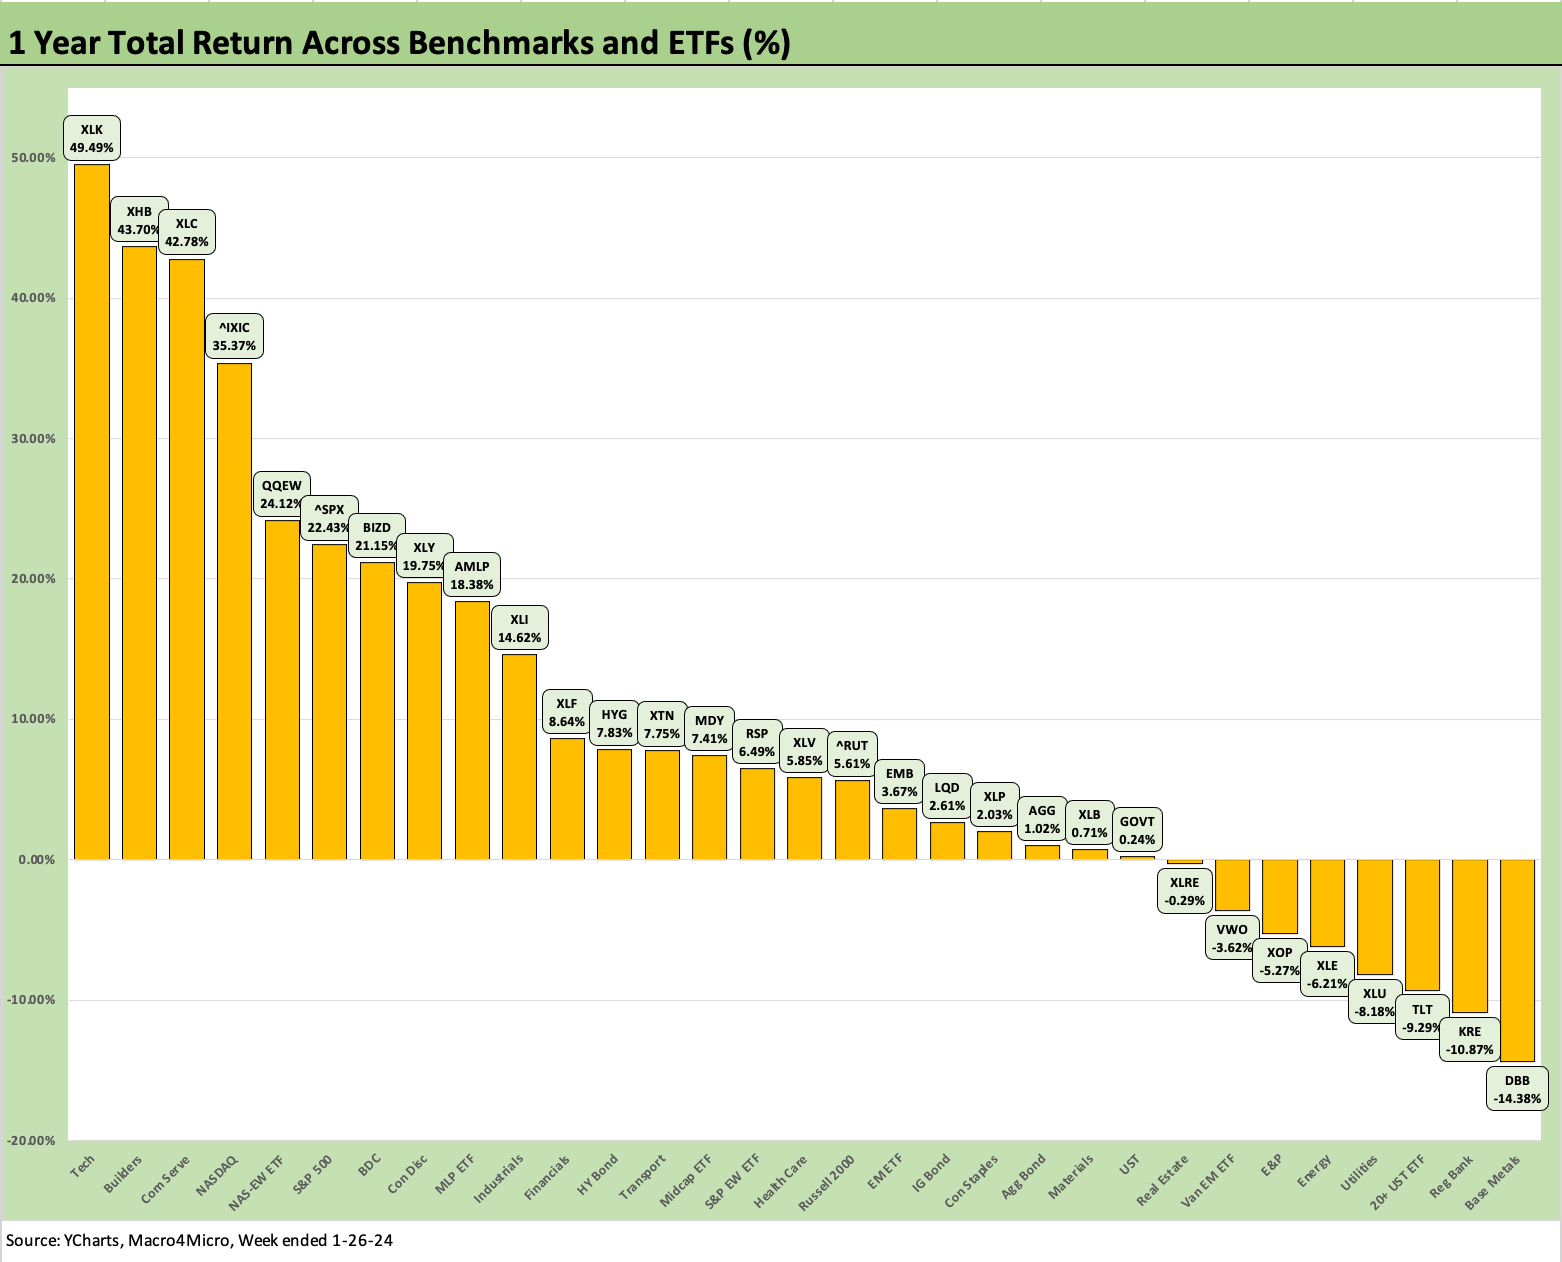
The 1-year return chart highlights that it will take some more weeks to whittle down the strong finish to 2023. The year 2023 ended with only 4 in the negative zone (27-4) but that crept up to 8 in negative range this past week, or flat to the prior week count of 8 in negative range.
The fact that DBB, KRE, and TLT are on the bottom shows some mixed influence with the Base Metals ETF (DBB) heavy on China risks, Regional Banks (KRE) still having the crisis of March 2023 in its measurement period, and TLT feeling the pain of its long duration bond profile. Among the bottom tier, UST pressure influences utility equities (XLU) and also undermines the real estate cycle (XLRE) and the relative value of dividend stocks. EM equities (VWO) are heavy on the China X-factor while XOP is all about oil and gas prices.
See also:
Histories: Asset Returns from 2016 to 2023 1-21-24
Credit Performance: Excess Return Differentials in 2023 1-1-24
Return Quilts: Resilience from the Bottom Up 12-30-23
HY Refi Risks: The Maturity Challenge 12-20-23
Coupon Climb: Phasing into Reality 12-12-23
HY vs. IG Excess and Total Returns Across Cycles: The UST Kicker 12-11-23
HY Multicycle Spreads, Excess Returns, Total Returns 12-5-23
HY Credit Spreads, Migration, Medians, and Misdirection 11-6-23
Quality Spread Trends: Treacherous Path, Watch Your Footing 10-25-23