
New Home Sales Dec 2023: Endurance Counts
We look at New Home Sales as builders continue to pick up market share of total home sales.


New home sales show the new vs. existing share continuing to rise as a percentage of total home sales and is now well over the 17% line.
From here, mortgage rates will be the bigger wildcard since demand handily exceeds supply and the unlocking of more alternatives needs to see the golden handcuffs unlocked.
The ability to match the home to the buyer profile still favors the builders with their arsenal of incentives and order books solid on the way into 2024.
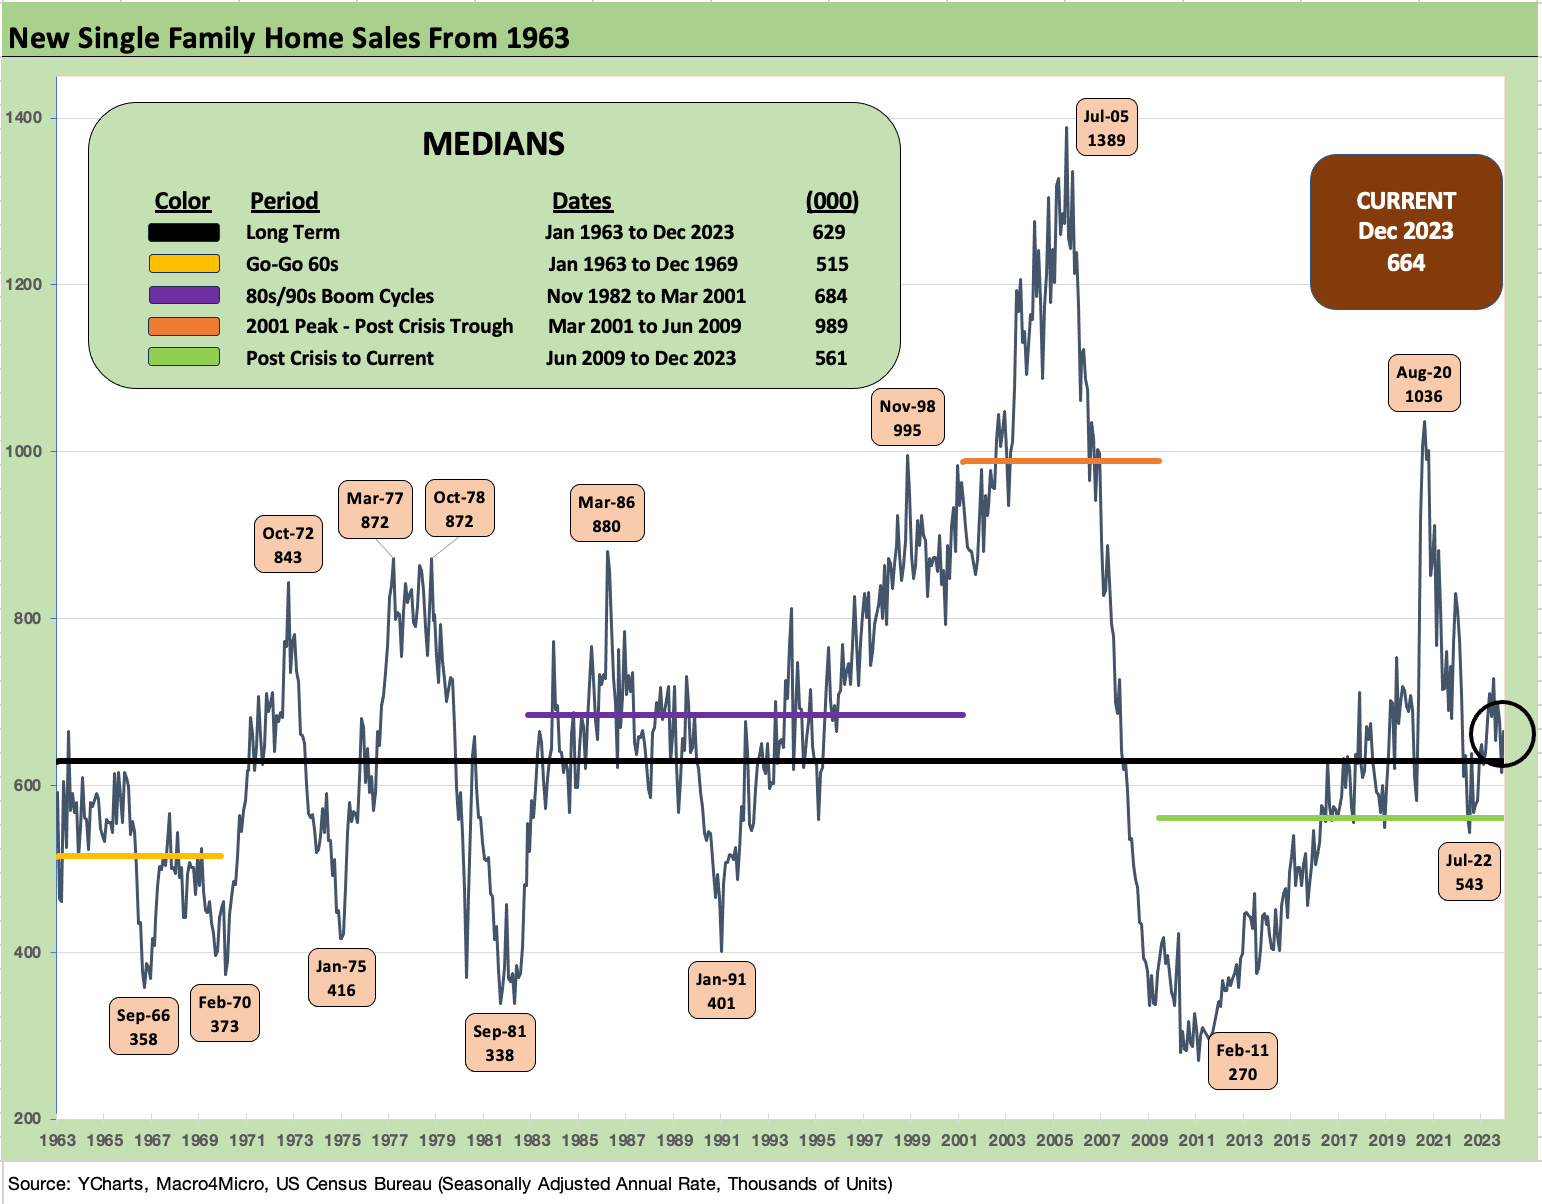
The above chart updates the new home sales run rate by the Census and highlights volumes at 664K are running ahead of the long-term median from 1963 and well ahead of the post-crisis median of 561K even if short of the 1980s/1990s economic expansion of 684K. The wild housing bubble years through the economic trough of 2009 are still in a higher zone at 989K.
The bottom line as we close out 2023 after almost two years of Fed inflation fighting is that volumes are strong and builders very well positioned to ramp up their investments in meeting what could be a very solid year if the UST curve behaves as many expect. The builders have made it very clear that prudently managing working capital and the balance of deliveries vs. starts is a priority.
Banner equity performance year for builders will keep stockholders on edge…
The builders got a lot of headlines on their stellar stock performance in 2023 with the Builder ETF (XHB) right in the thick of the top rankings with the tech heavy sectors (see Footnotes & Flashbacks: Asset Returns 1-1-24). After that performance, valuation worries will be natural as we saw with industry leader D.R. Horton this past week with a sell-off on earnings day on a modest miss.
There are always going to be reasons for markets to worry about the pace of the UST curve shift when it comes to homebuilder equity valuations after such an amazing stock performance in 2023. The run rate ahead on “price x volume” will remain strong and credit quality on homebuilder bonds exceptionally so given where balance sheets and asset protection (cash + inventory % total debt) have trended.
The homebuilding sector is very healthy and mortgage credit is available (even if at levels starting to crawl back to the high 6% range again in recent weeks). The consumer sector keeps proving itself as we saw in consumer sentiment last week (see Consumer Sentiment: Multiple Personalities1-19-24) and again in strong personal consumption stats this week (see PCE Release Dec 2023: Consumption Strong, Inflation Favorable 1-26-24).
Confidence and strong employment numbers usually are two major ingredients for a healthy new home sales market, but the monthly payments are still squeezing many even if the builders have demonstrated impressive dexterity in the use of sales incentives in mortgage buydowns and liberal fee incentives. We have already covered those topics more broadly in our housing research.
Below we run through some of or favorite homes sales charts that tell the story.
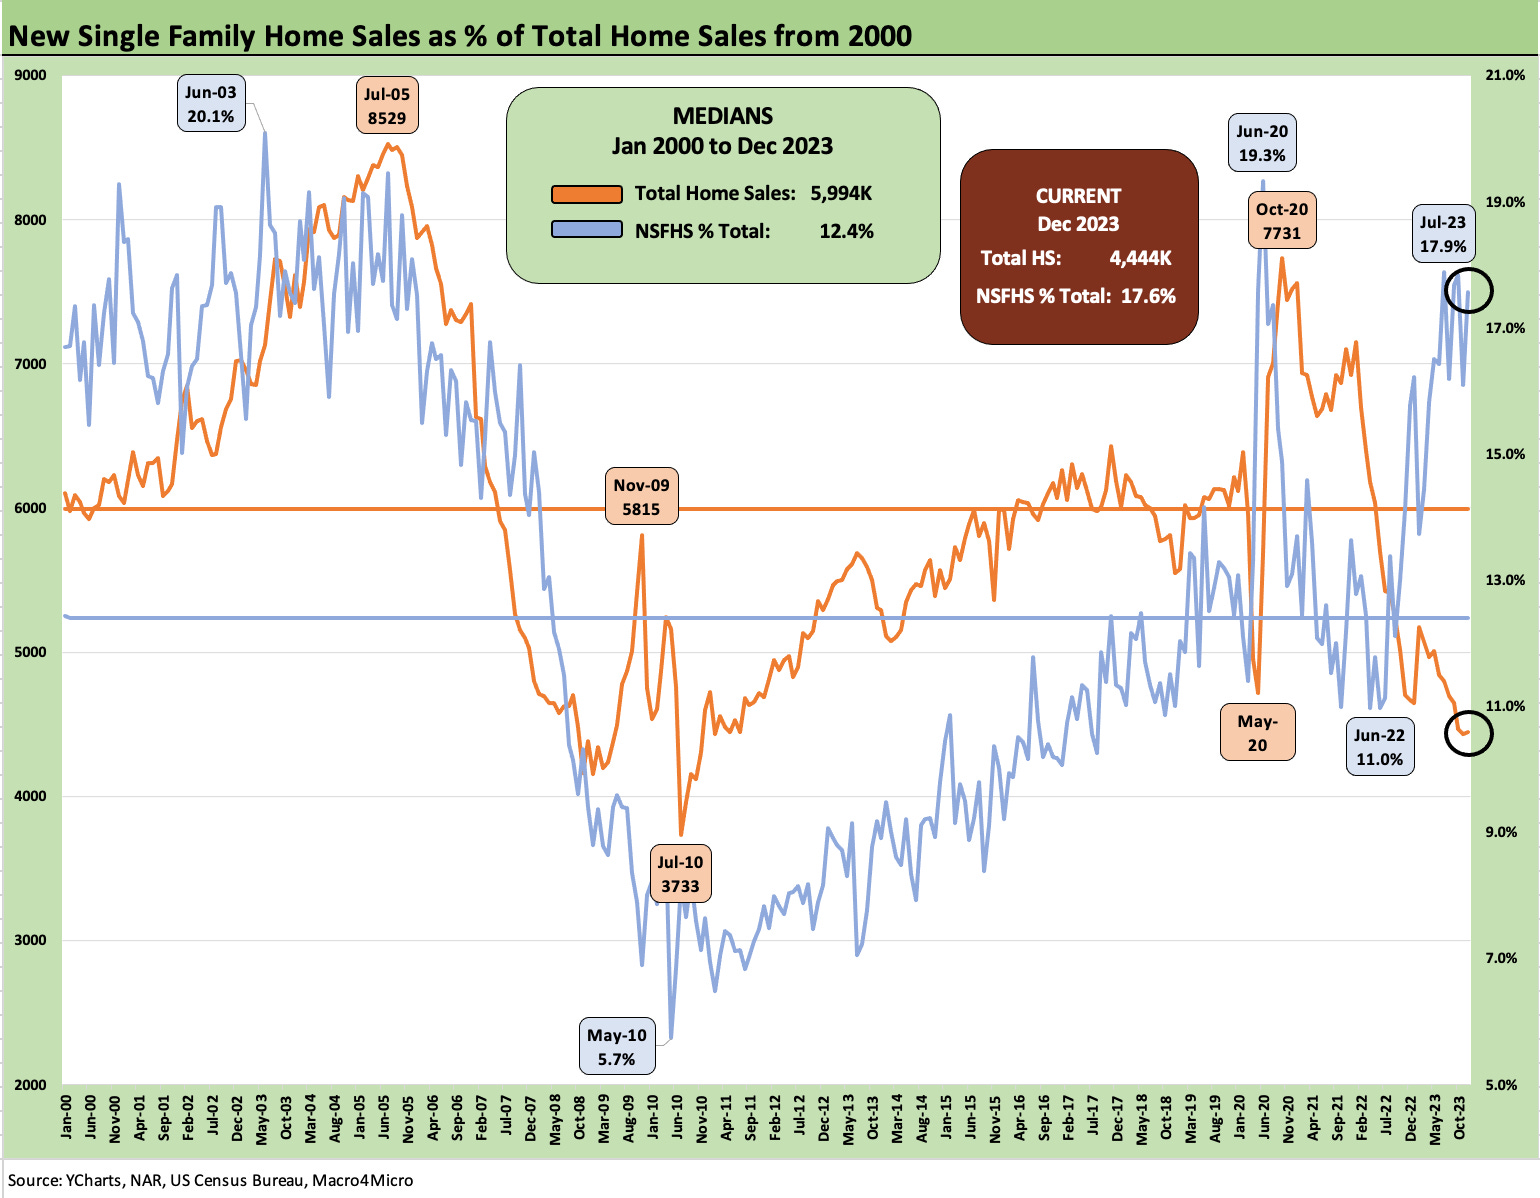
The above chart plots the share of total home sales (new + existing) that were captured by the “new home” builders. We see the share is now up to 17.6% vs. the long-term median of 12.4%. When inventory is scarce, the right home at the right price wins. That is especially the case with financing incentives.
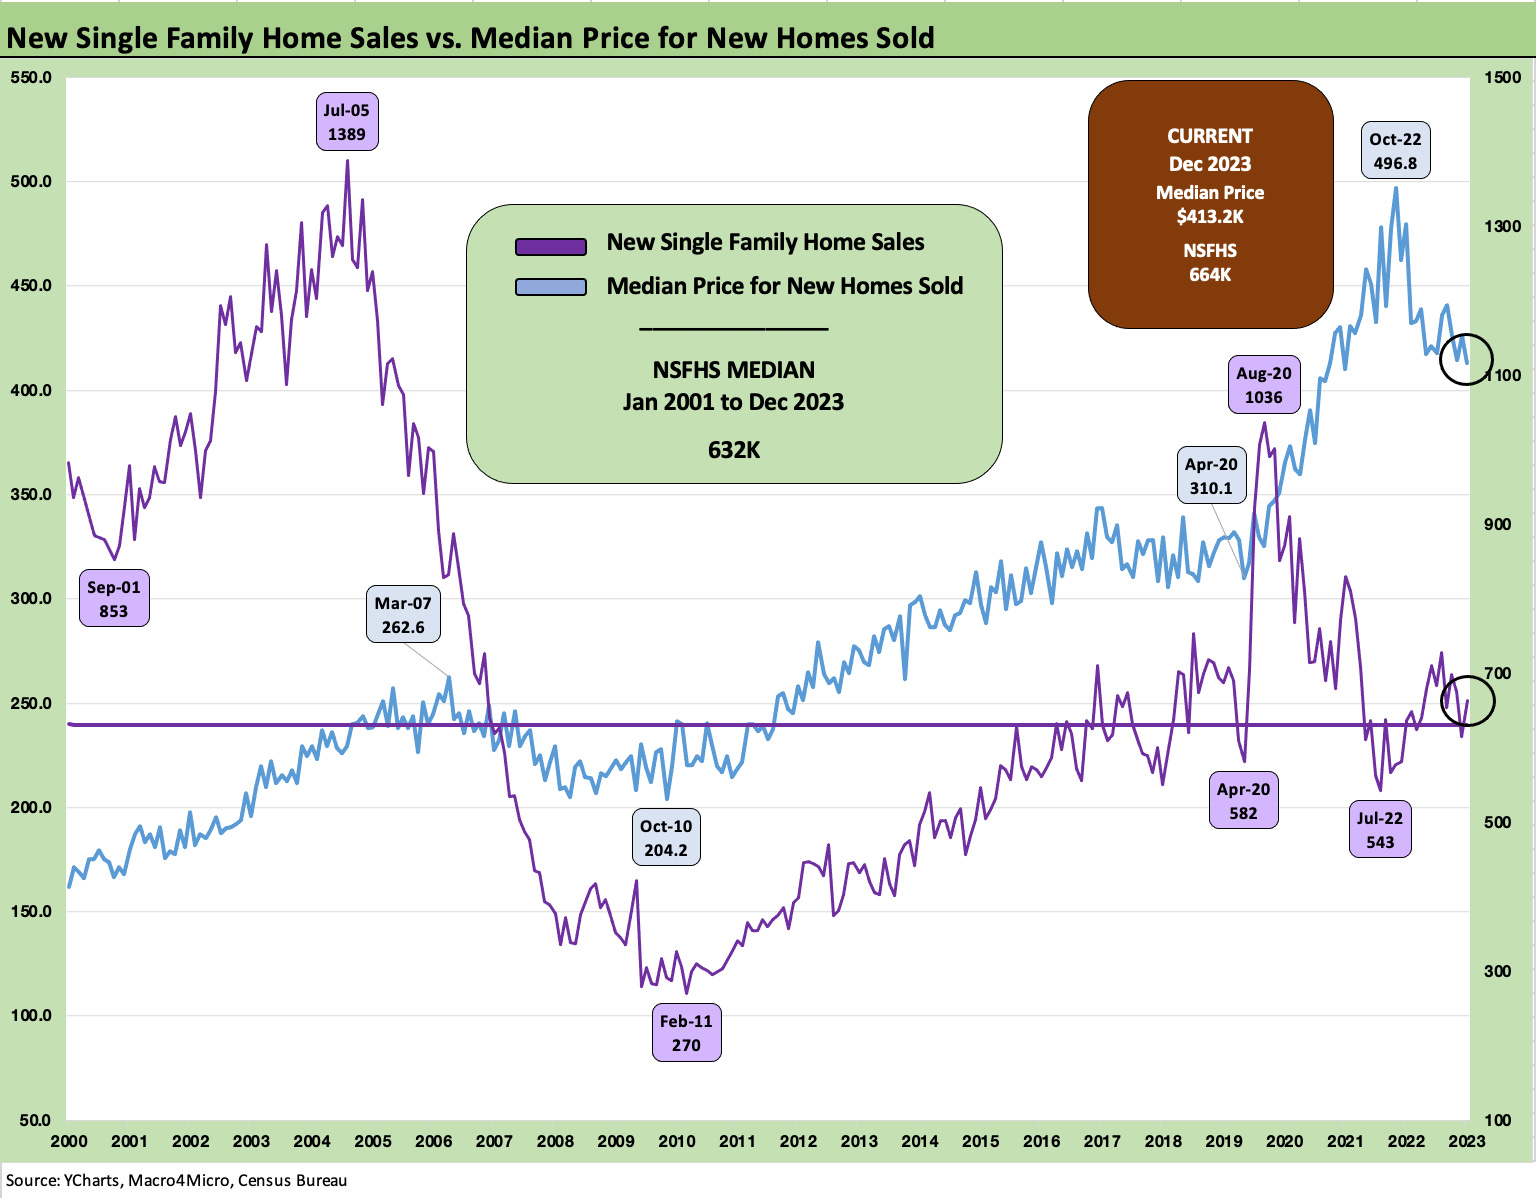
The above chart plots the sales volumes of new homes against the median sales price from the start of the housing bubble decade (Jan 2001 to Dec 2023). Steadily higher prices are the norm even if we are below the peak as some of the lagging contracts of earlier in 2022 wound down and prices felt some pressure. The time series comes with the “mix asterisk” of the regional mix and the shifting that occurs across price tiers in various regions.
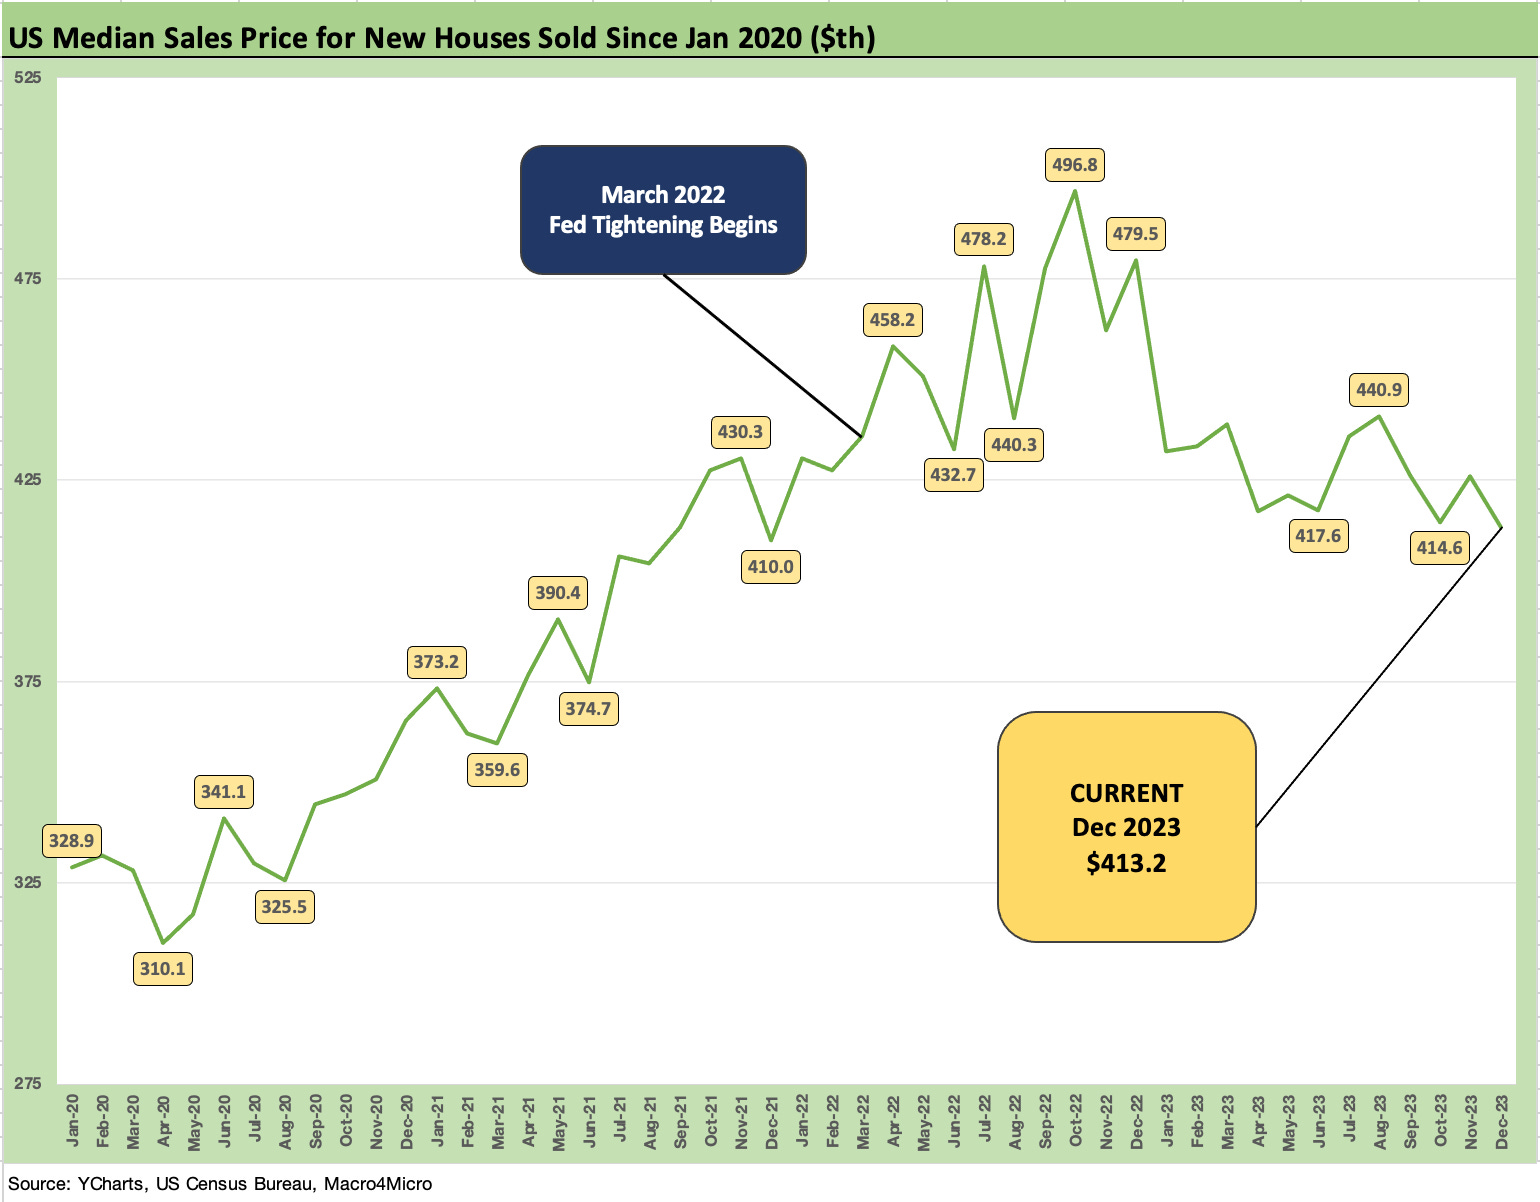
The above chart plots the median prices from Jan 2020 through current times. The idea that prices will decline to bring the supply and demand into better balance across home inventory has not at all been what has transpired. The barriers to existing home owners in selling houses with low mortgages are just too high given what mortgage rates would be on the other side of the sale when they seek a new home. This is an old theme at this point, and it is not close to changing at current mortgage rates (see Existing Home Sales Dec 2023: Rerun of Multi-Decade Low 1-19-24).
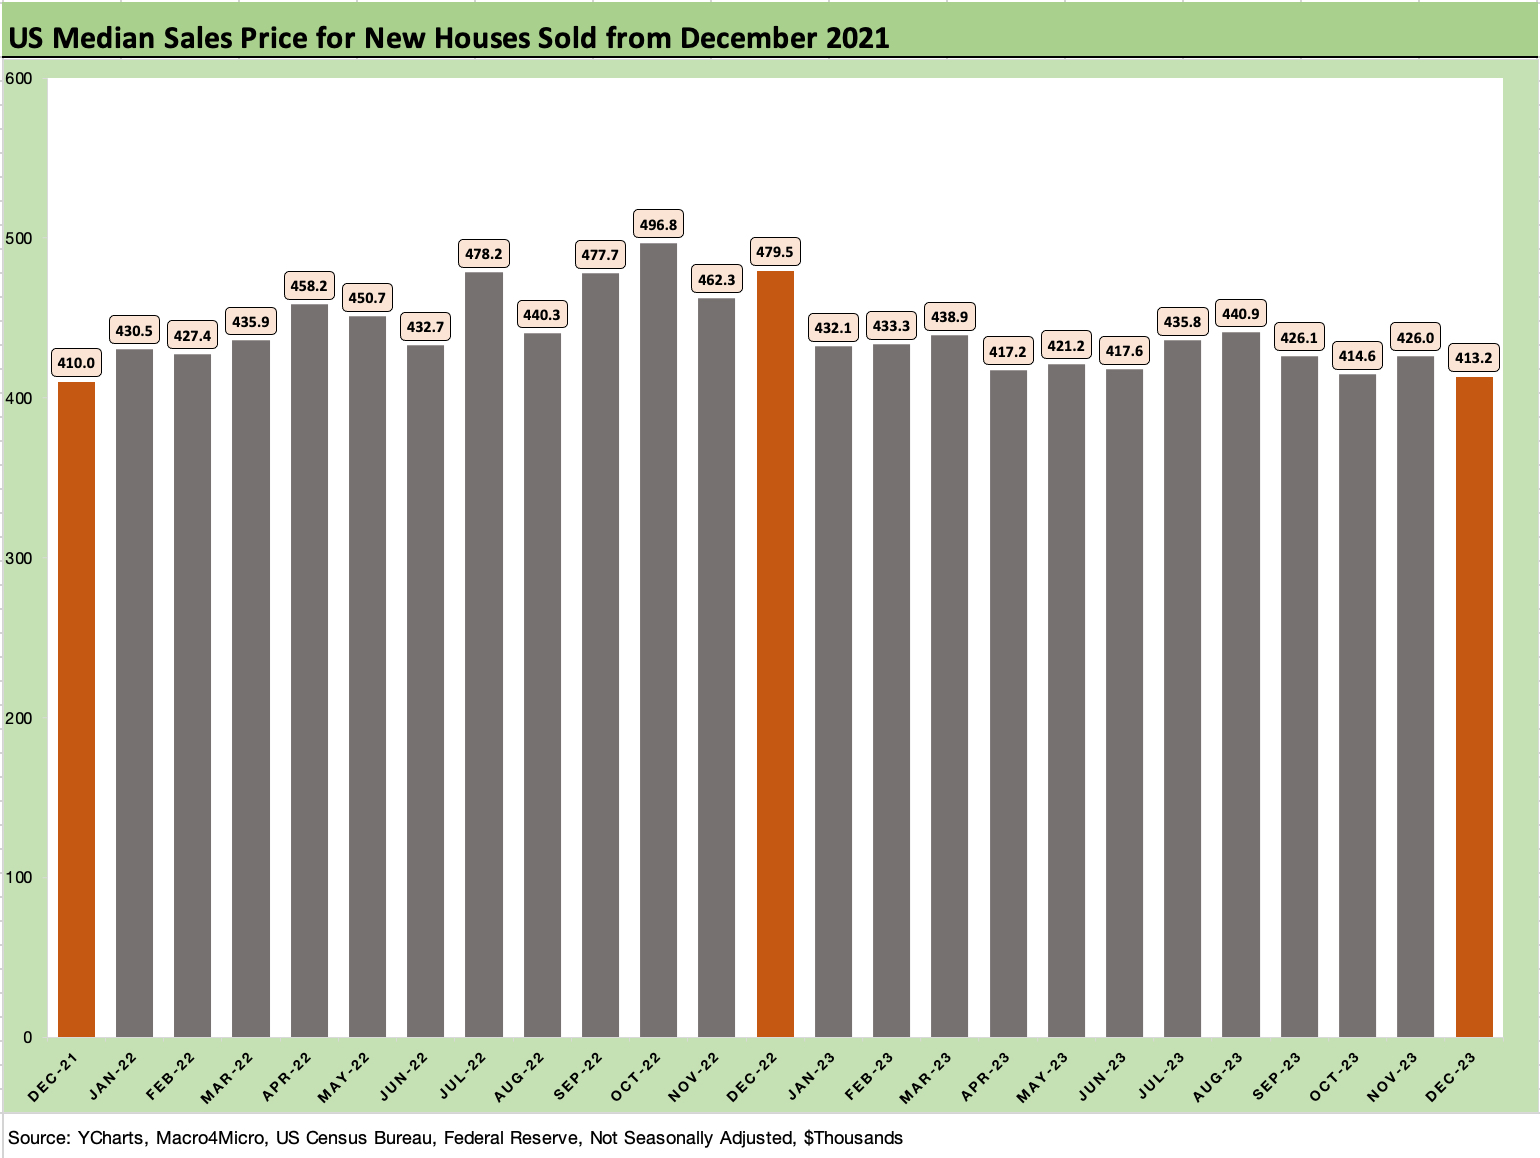
The final chart lines up 2 years of median prices. The steady $400K pricing across this timeline is soothing for those not looking to sell their homes since home equity is healthy. These price ranges give the builders a lot of room to maneuver by region and price tier and community planning as they invest in land and make decisions on options.