


I demand 1% or less fed funds and a negative real fed funds rate!
The FOMC action of a +25 bps hike with a 12-0 vote was a credibility builder for the market in terms of the current Fed regime and its commitment to fighting inflation. The hike offered more reassurance of Fed independence since it came in the face of Trump foaming at the mouth and threatening to cut off trade if the Fed did not ease.
Even if one views the Fed vote 12-0 as 24 middle fingers aimed at Trump’s demands for multiple cuts now, the emotions of the moment are less relevant than the economics of the move. The action translates into higher borrowing costs that could squeeze some leveraged credits. The FOMC handicapping kept the 2Y UST moving higher in anticipation of another hike before year end.
The latest Summary of Economic Projections (“SEP” report) that accompanied the FOMC meeting highlights median expectations of 1 more hike by year end along with GDP growth expectations ticking slightly higher from the June median to 2.3%. The SEP also highlighted median PCE expectations for 2026 moving higher from June to 3.7%, and Core PCE higher to 3.4%. The median expectation for 2026 fed funds moved to 4.1% from 3.8% in June. Unemployment estimates for 2026 moved lower from 4.3% to 4.1% (then stays there through 2028). Relative to the June SEP report estimates from the Fed, the latest release adds up to “higher inflation in 2026, slightly higher GDP growth, notably higher fed funds from 2026 to 2028, and a lower unemployment rate.”
Mortgage rates ticked higher with the UST curve pushing 10Y UST rates higher. The Mortgage News Daily survey ended the week at 7.2% while the higher quality Freddie Mac mix was 6.95% (vs. 6.76% last week), up by 69 bps YoY from 6.26%. Back in Sept 2024, the 30Y mortgage was closer to 6.0%.
It is worth highlighting that the medians show low 2% GDP growth estimates (2.3% 2026, 2.4% 2027, 2.2% 2028, and 2.1% for 2029) that do not merit any “Golden Age” endzone dances or excessive superlatives from Trump. The US is now a 2% annual real GDP growth economy even if Hassett loves to cite nominal GDP growth in his mix of Jedi Mind Tricks.
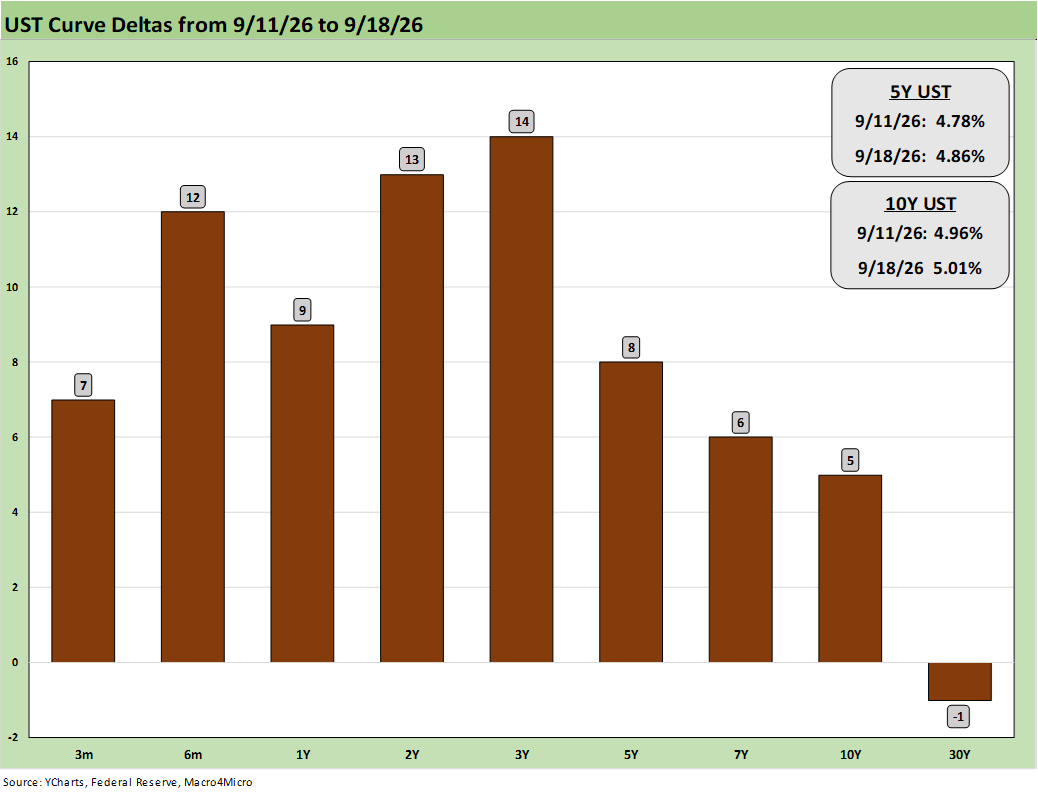
While the FOMC action drove the headlines and Washington noise, the UST deltas for the week saw the market hashing out where 10Y UST should land vs. the 5.0% focal point. The bear flattener UST deltas for the week are detailed above with the 2Y UST reflecting FOMC tightening risks. Meanwhile, the long end of the UST shows the recurring battle of where oil and downstream products will land in inflation risks. Risks remain around other “flow-through effects” of higher operating costs from energy and tariffs. Wage growth remains below inflation – for now.
The issues around monthly payment trends in consumer credit (mortgages, autos loans, credit cards, etc.) all factor into the “household basket affordability” debate even if “purchasing power” is not always part of the recurring inflation handicapping. Those “inflation vs. current purchasing power” issues (one-time increases etc.) sometimes blur when the bigger issue in buying a house is the mortgage rate and monthly payment demands.
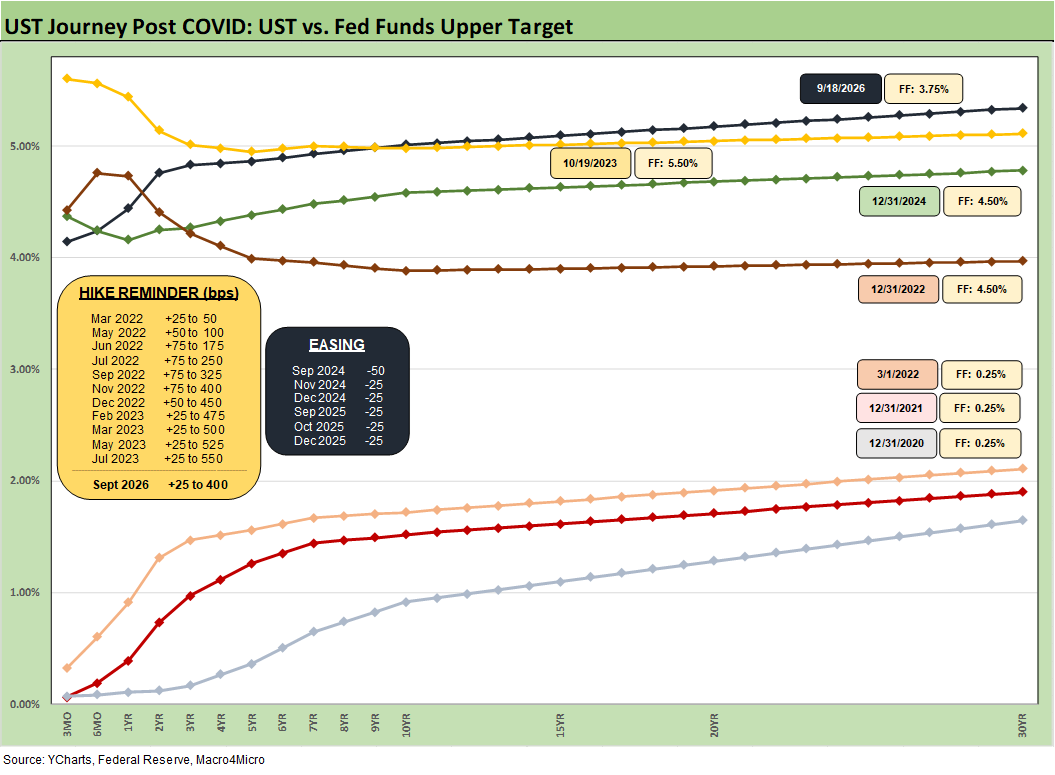
The above chart looks at the ZIRP period of COVID across the tightening and easing cycle. The upward migration of the yield curve does not show much sign of abating with some critical variables and time lags still to work through. The national debt trend line says “more, more, more” while trade war uncertainty, tariff and pricing decisions, and even just what gets Iran and its supporting cast (Houthis, Iraq-based elements) to a cease fire is an impossible call. The “other side” is certainly watching US political dynamics.
The oil price uncertainty and the stubbornness of gasoline, diesel, aviation fuel, and home heating oil will be major factors ahead for household and inflation – whether PPI, CPI, or PCE. The oil speculation scenarios (“oil will spike”, “oil will crash” etc.) will be constant, but the markets have been schooled lately on how downstream refined product prices can move quickly and painfully based on global supply and demand from the “refined barrel.”
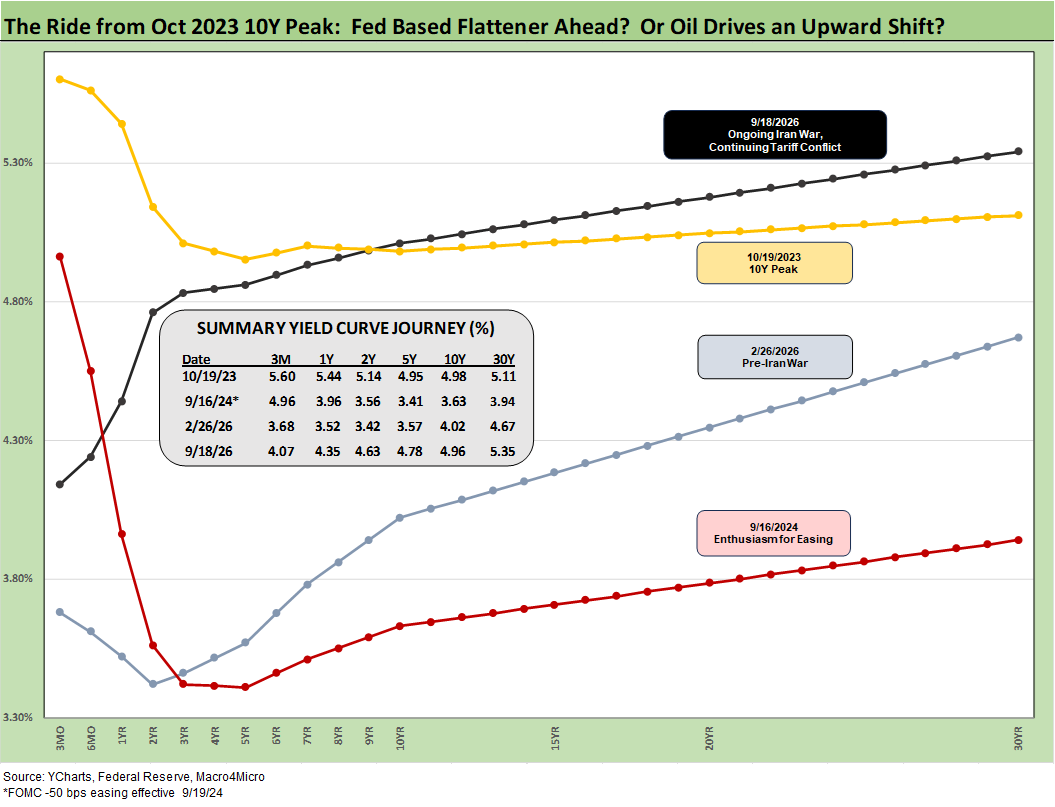
From another angle and scale vantage point, the above chart narrows the migration timeline. We see the rapid rise from Sept 2024 as the easing cycle kicked into gear. The latest move has pushed past the 10Y and 30Y yields out the curve. The worry is the shift from the front end continues and undermines financing costs for banks and finance companies and that in turn flows into the consumer durables cycle.
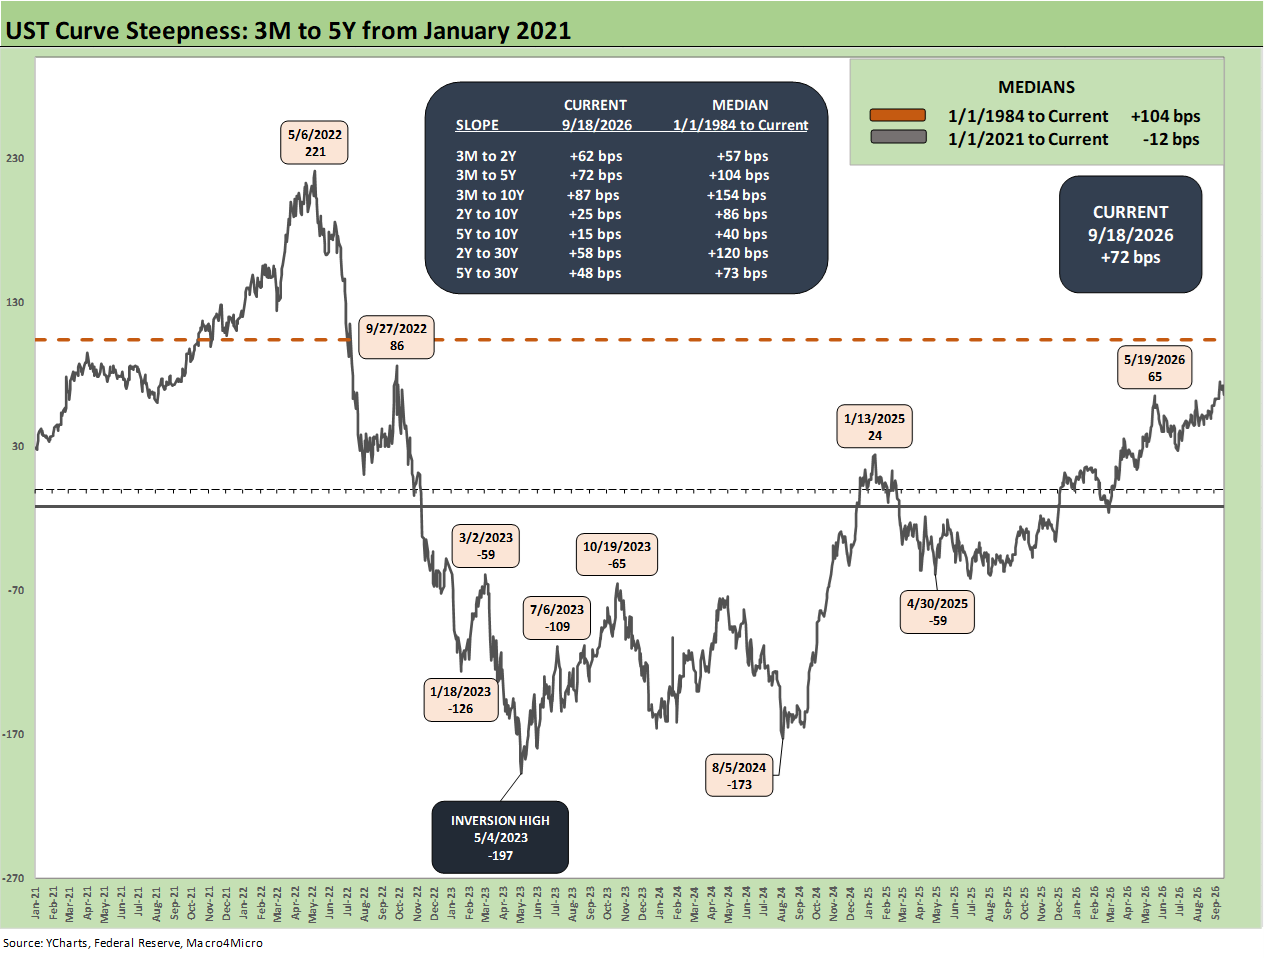
For a longer timeline on the 3M to UST we plot the trends since 1984. The current slope of +72 bps is below the long-term median of +104 bps. We can look back across the highs and lows of the slopes and frame them against where the cyclical dynamics and FOMC policies were moving at the time.
The inflation X-factor today looms larger than in some of these earlier cycles. Asset quality and systemic risk as well as economic cycle and dual mandate questions were more at play even if inflation was always a high priority for the Fed after the brutal 1970s and 1979-1982 inflation and stagflation (see UST Moves 1978-1982: The Inflation and Stagflation Years 10-18-22).
The lows on the 3M-5Y in the inverted zone usually came late in the cycle or after/during tightening moves (1989, 2000, 2007). The 1989 shift from tightening to easing was a whipsaw as bank system and securities markets trouble surfaced (bridge loans, leveraged lending etc.).
We cover those periods in other commentaries (see UST Moves: 1988-1989 Credit Cycle Swoon 10-20-23, UST Moves: The 1990-1991 Risk Factor Pig Pile 10-24-23, Wild Transition Year: The Chaos of 2007 11-1-22, Greenspan’s Last Hurrah: His Wild Finish Before the Crisis 10-30-22).
The UST delta collection…
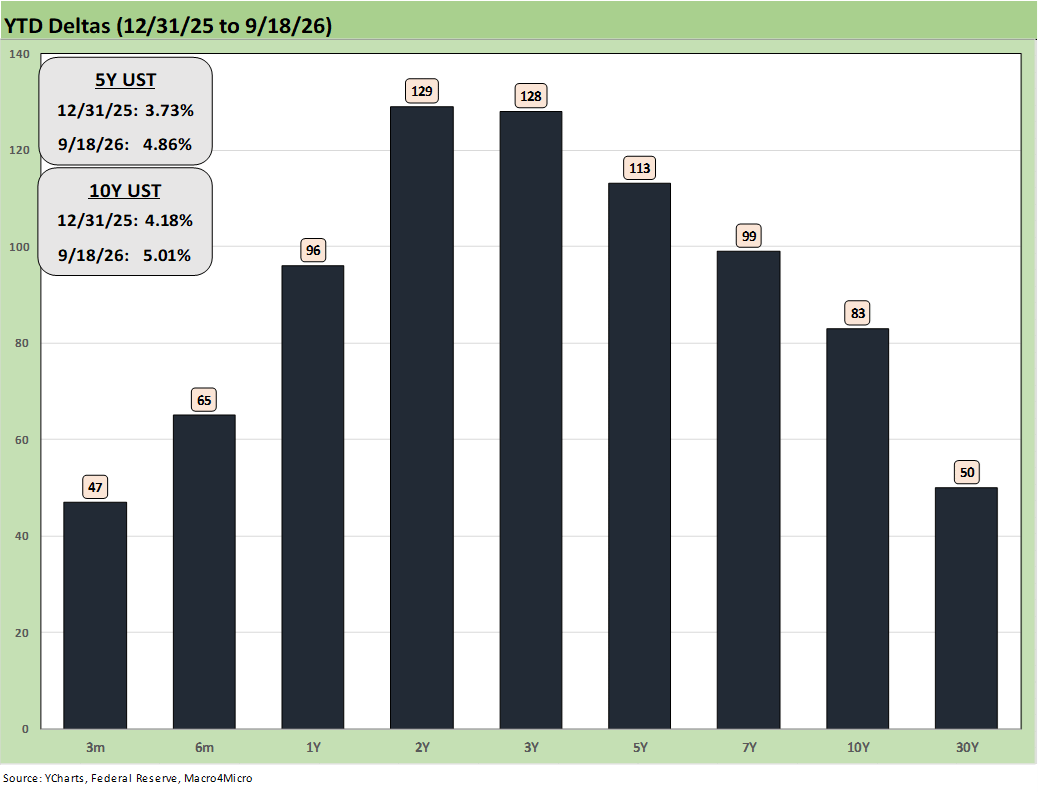
The above UST delta chart for YTD details the bear flattener that has unfolded from 2Y to10Y and 30Y. Clearly 2026 has been a rough time for bonds and for those who expected lower inflation and lower oil.
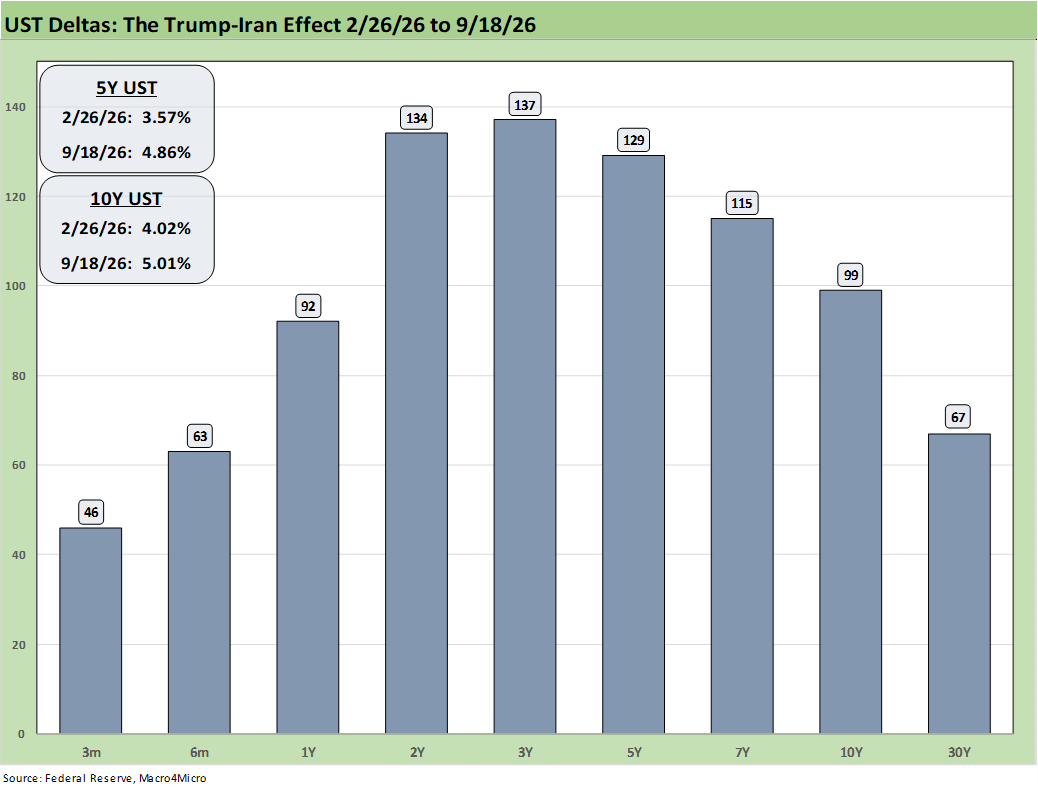
The above UST deltas update the post-Iran effect that has caused a lot of the damage. That is a lot of duration carnage (see Duration Daze: Post-ZIRP Bond Returns 9-7-26, UST Curve: A Brutal Week 9-12-26).
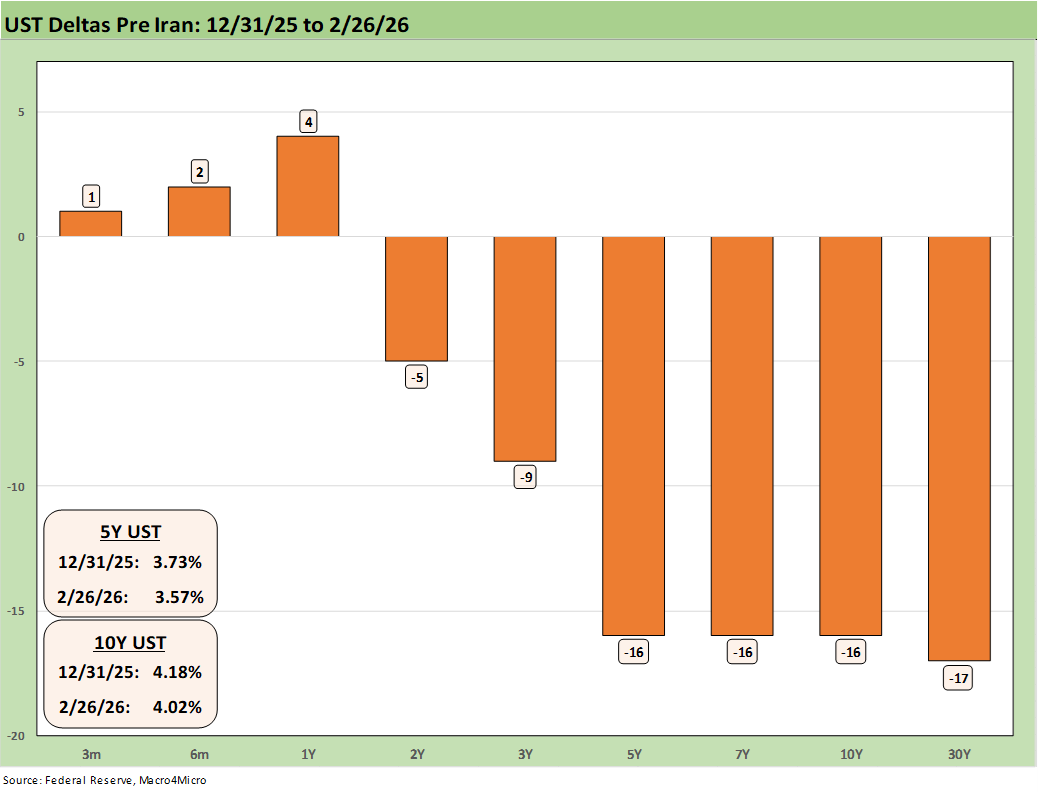
The above UST delta chart is the recurring reminder of where the markets stood before the fateful decision to launch the Iran bombing campaign. The failure to understand what was on the other side of that action (Hormuz, supply shocks, Houthis and Red Sea) led to the “nuclear weapon replay” after Trump earlier had demand that everyone agree that such capabilities had already been obliterated. Taking victory laps is standard politics, but it is important that later victories do not deny the earlier celebratory moments.
See also:
Market Commentary: Asset Returns 9-13-26
UST Curve: A Brutal Week 9-12-26
CPI Aug 2026: Staying Stubborn, Not Accelerating 9-11-26
PPI August 2026: Leading Indicator Signaling Struggling 9-10-26
Duration Daze: Post-ZIRP Bond Returns 9-7-26
UST Market: Curve Meets Knuckler 9-7-26
PCE July 2026: Mixed Consumption, Stubborn Inflation 8-26-26
2Q26 GDP: 2nd Estimate 8-26-26