


Trump appoints new AI Safety Czar.
The week rang up a score of 5-27 positive across the benchmarks and ETFs we track to wrap up a trailing 1-month time horizon of 6-26 with all 7 bond ETFs in the red for the month.
An ugly turn in oil prices and downstream refined products can hurt inflation expectations and hit household discretionary cash flow. That will weigh on consumers in the 2026 home stretch. The adverse shifts in the yield curve are battering markets directly and indirectly with mortgage rates edging above 7.1% per the Mortgage News Daily survey (see UST Curve: A Brutal Week 9-12-26).
The Canada trade war is in its early stages with ample room to escalate in the fall as more decisions are made by Canada and Trump continues the retribution game plan. Tariff impacts only appear at a lag with working capital cycles and rolling effective dates.
The coming week brings the FOMC decision on a hike with FedWatch currently showing odds over 86% for a hike.
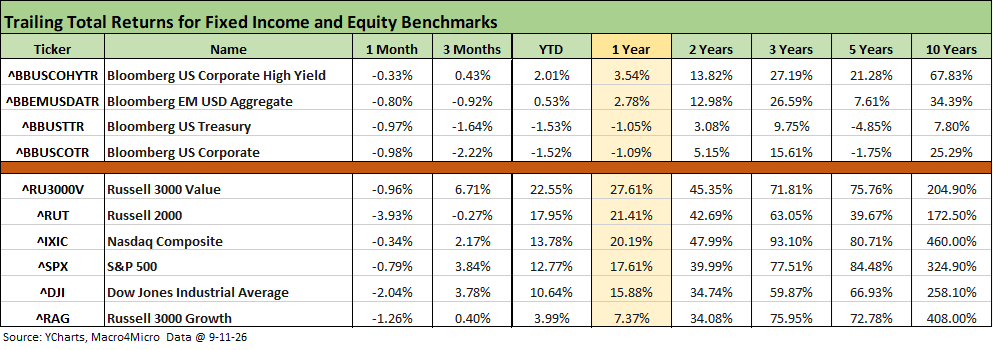
The above chart updates the time horizon returns for the debt and equity benchmarks we monitor. It has clearly been a rough month for debt with all negative returns while 3 months shows 3 of 4 in the red. YTD, we see 2 benchmarks in the red.
In equities, we see an all-negative month but the Russell 2000 is feeling some pain over 3 months. The Russell 3000 Growth has lagged over 3 months and has been the worst of that column YTD with the rest in double digits.
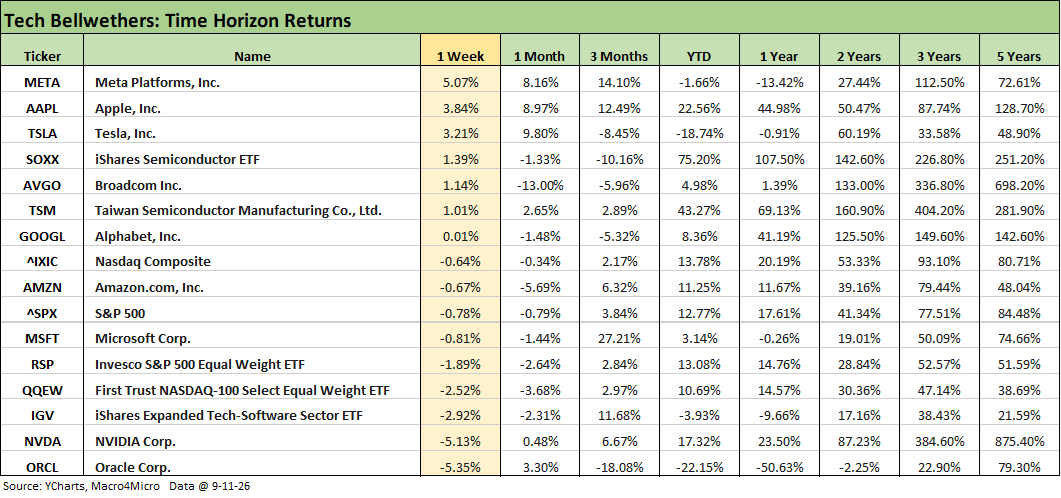
The tech bellwether checklist and benchmark comps show 9 in the red and 7 posting positive returns for the week. The Mag 7 shows 4 positive and 3 negatives. Looking back 3 months, we see the Software ETF (IGV) well ahead of the Semiconductor ETF (SOXX). That reverses dramatically YTD with SOXX at +75.2% vs. -3.93% IGV. For YTD returns, Oracle (ORCL) has been the worst of the pack followed by Tesla.
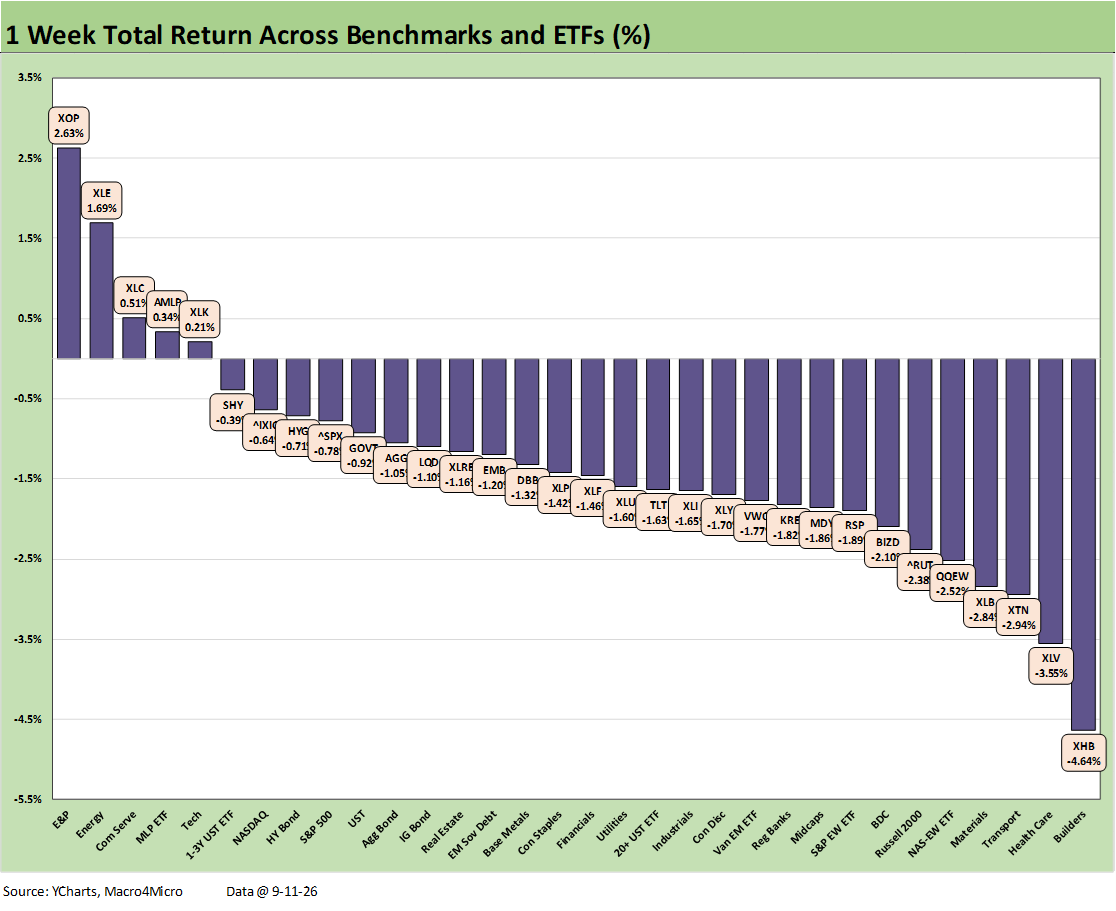
We already posted a commentary on the weekly returns for the benchmarks and ETFs (see Weekly Returns: Benchmarks and ETFs 9-12-26). The 5-27 score includes 3 energy names (XOP, XLE, AMLP) in the positive range in a flip side of what is ailing many other line items.
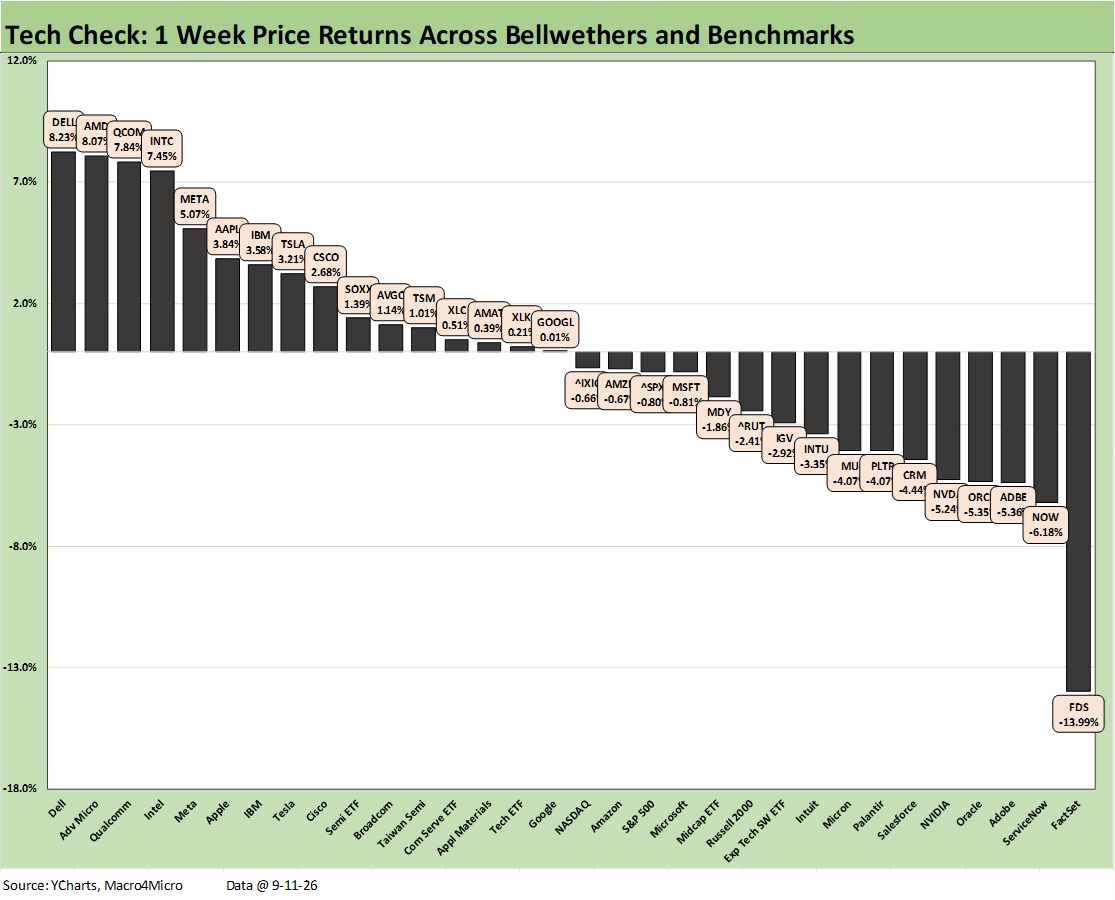
We already looked at the weekly tech check returns (see Weekly Tech Check Returns 9-12-26). The main takeaway is that the AI ecosystem and semiconductor names had a good week with software still dragging on the right.
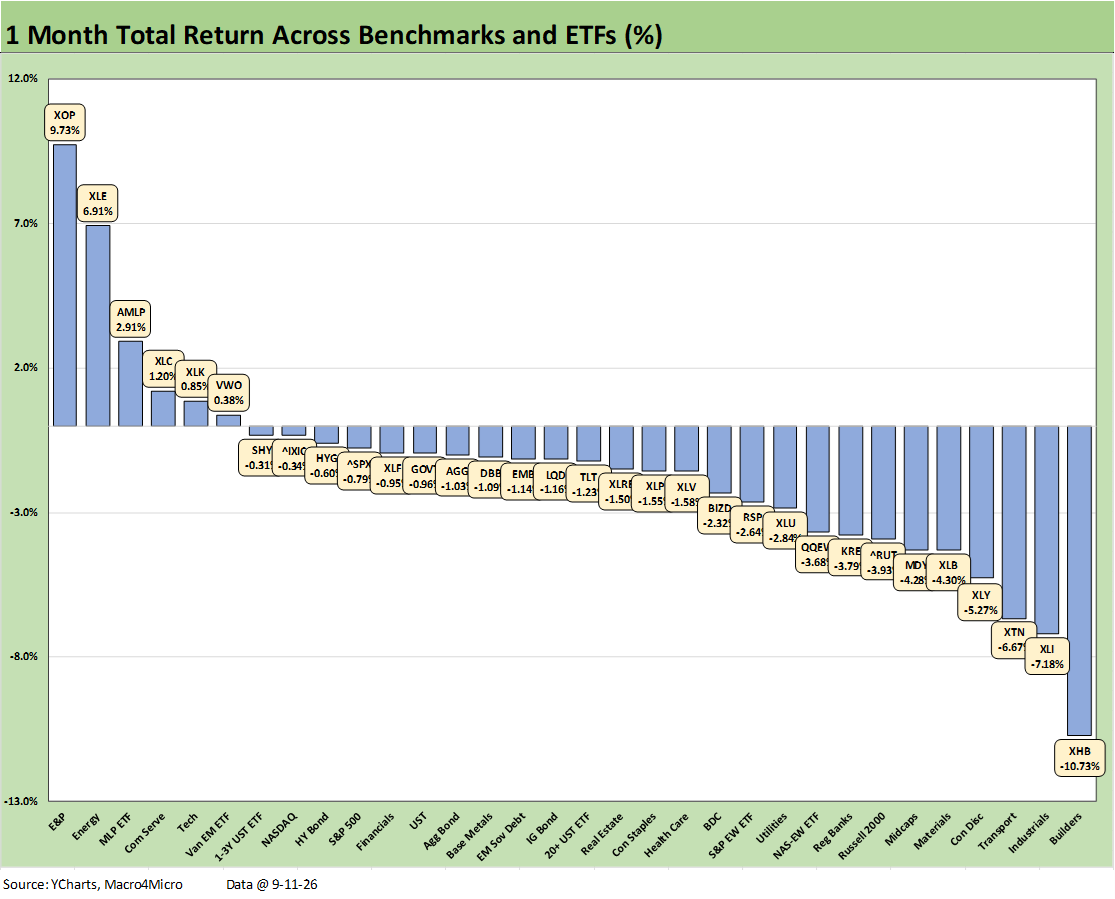
The 1-month returns for the broader mix of benchmarks and ETFs were almost as glum as the past week with a score of 6-26. We see energy related names in the top 3 slots. The Communications Services ETF (XLC), Tech ETF (XLK), and EM ETF (VWO) squeezed out some unimpressive but positive 1-month returns.
We see some of the more interest rate sensitive ETFs weaken. That includes Homebuilders (XHB), which is really feeling the adverse move in the 10Y UST that flows into mortgages. Seeing Industrials (XLI), Transports (XTN) and Materials (XLB) can be traced to some jitters around fallout in downstream refined products and in the case of XLB on the feedstock and tariff side.
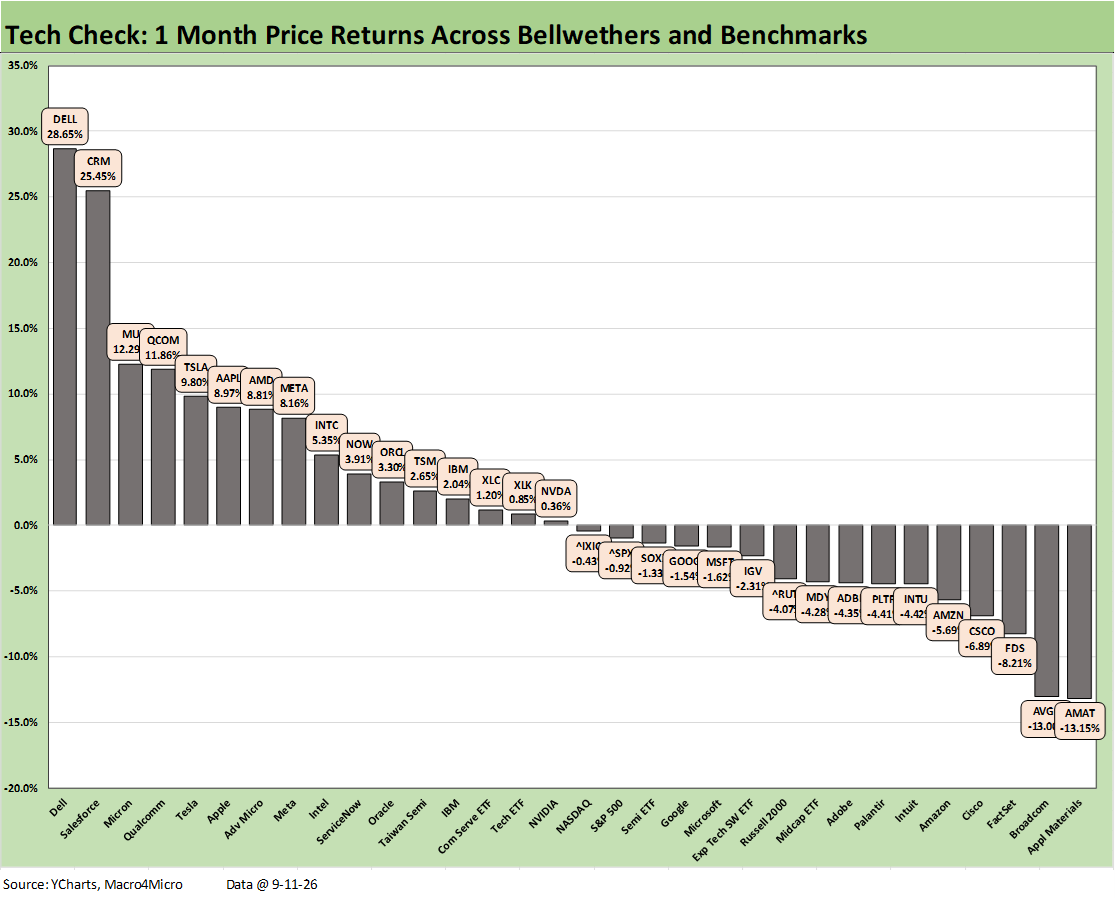
The 1-month tech check shows a more varied mix than what we have been seeing with blurred lines of outperformance in the top quartile across semiconductors and software. We see Dell (DELL) and Salesforce (CRM) well ahead of the pack at #1 and #2. We see Micron (MU) and Qualcomm (QCOM) in the top 5 with Applied Materials (AMAT) and Broadcom (AVGO) on the bottom and NVIDIA sitting in the middle of the pack.
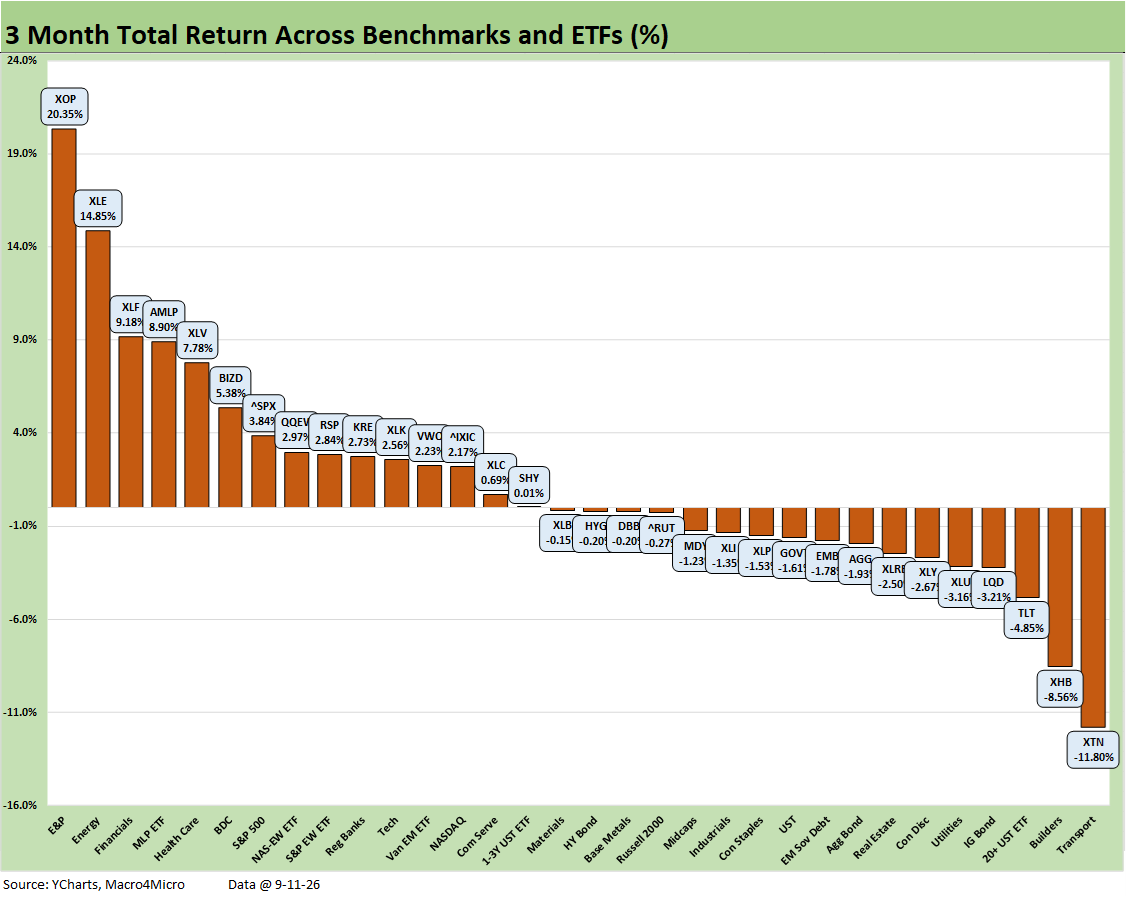
The 3-month score at 15-17 showed better balance with 6 of 7 bond ETFs in the red with the Short UST 1-3Y ETF (SHY) barely positive at +0.01%. We see aviation fuel and diesel pain hitting Transport (XTN) and the most curve-exposed assets on the bottom with Homebuilders (XHB), the long duration UST 20+Y ETF (TLT), and the IG Corporate ETF (LQD).
Among the winners, the energy names (XOP, XLE, AMLP) were 3 of the top 4 slots with E&P (XOP) the runaway winner. One of the top quartile names that might get some attention was the BDC ETF (BIZD) after an earnings season that was not as bad as might have been feared by many.
Among notable results was only 1 broad market index (S&P 500) in the top quartile with the NASDAQ in the 2nd quartile and Russell 2000 and Midcaps in the 3rd quartile.
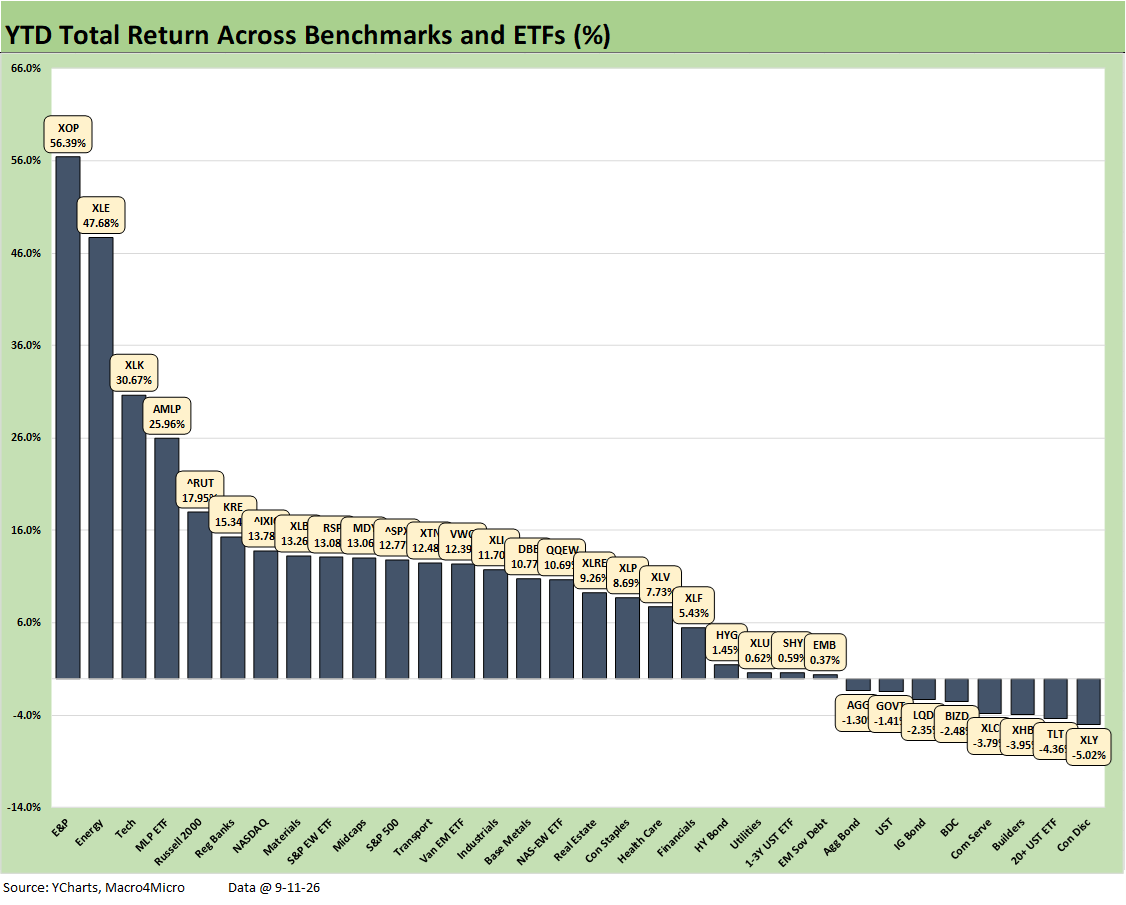
The YTD story on the broader mix still shows a very strong year for equities and a bad year for debt with 4 of 7 bond ETFs in the red zone and only one bond ETF over +1% (HYG at +1.45%). That is not pretty. The overall score was a solid 24-8.
Energy names (XOP, XLE, AMLP) took 3 of the top 4 with Tech ETF (XLK) grabbing #3. Russell 2000 took #5. Regional Banks (KRE), NASDAQ, and Materials (XLB) round out the top quartile.
Of the bottom quartile assets in the red, we see 4 bond ETFs with Consumer Discretionary (XLY) on the bottom with Homebuilders (XHB) 3 off the bottom and Communications Services (XLC) just ahead of it. The BDC ETF (BIZD) posted -2.48% after posting a decent rolling 3 months.
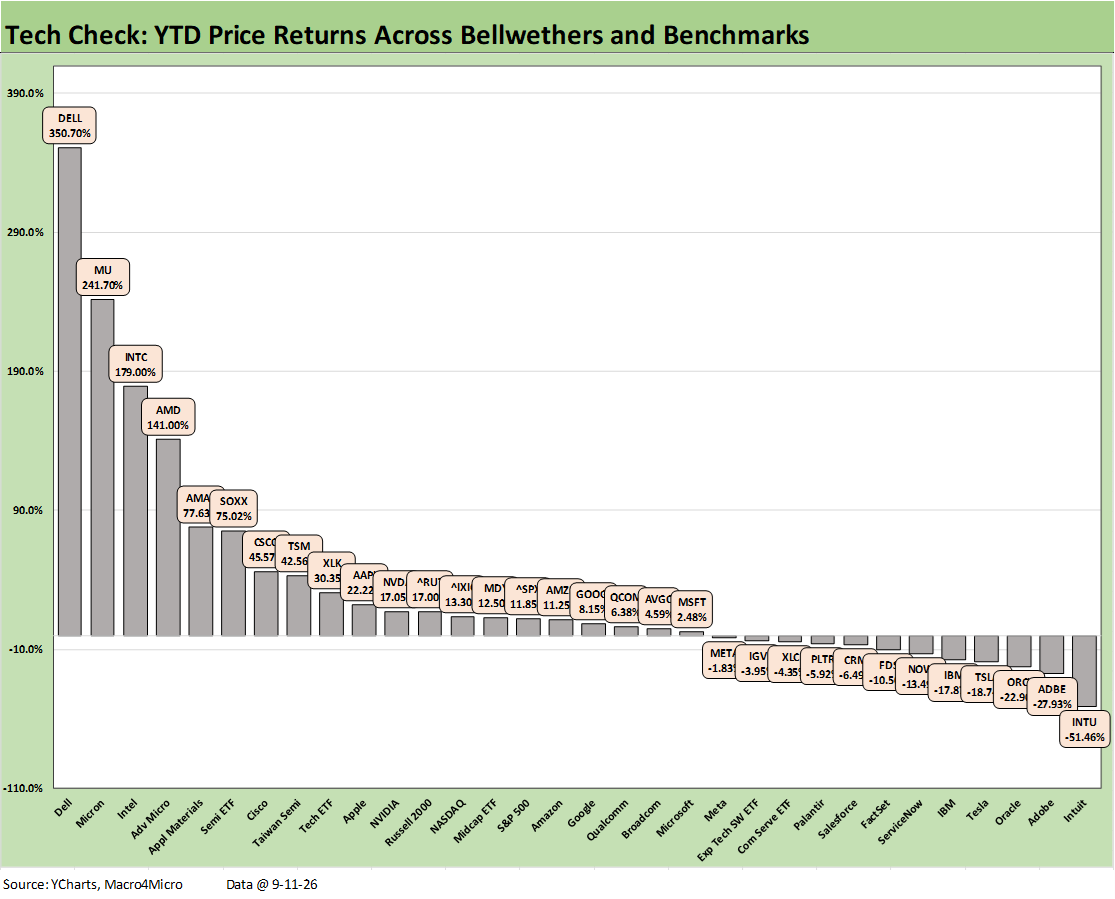
It is hard to shift the patterns of the tech return distributions after such amazing numbers were generated by the semis and AI ecosystem names. It took +75.0% to rank #6 with the Semiconductor ETF (SOXX). It took +42.6% to make the top quartile with Taiwan Semi (TSM). The bottom tier is comprised of 6 software names out of the 8 joined by Tesla (TSLA) and IBM.
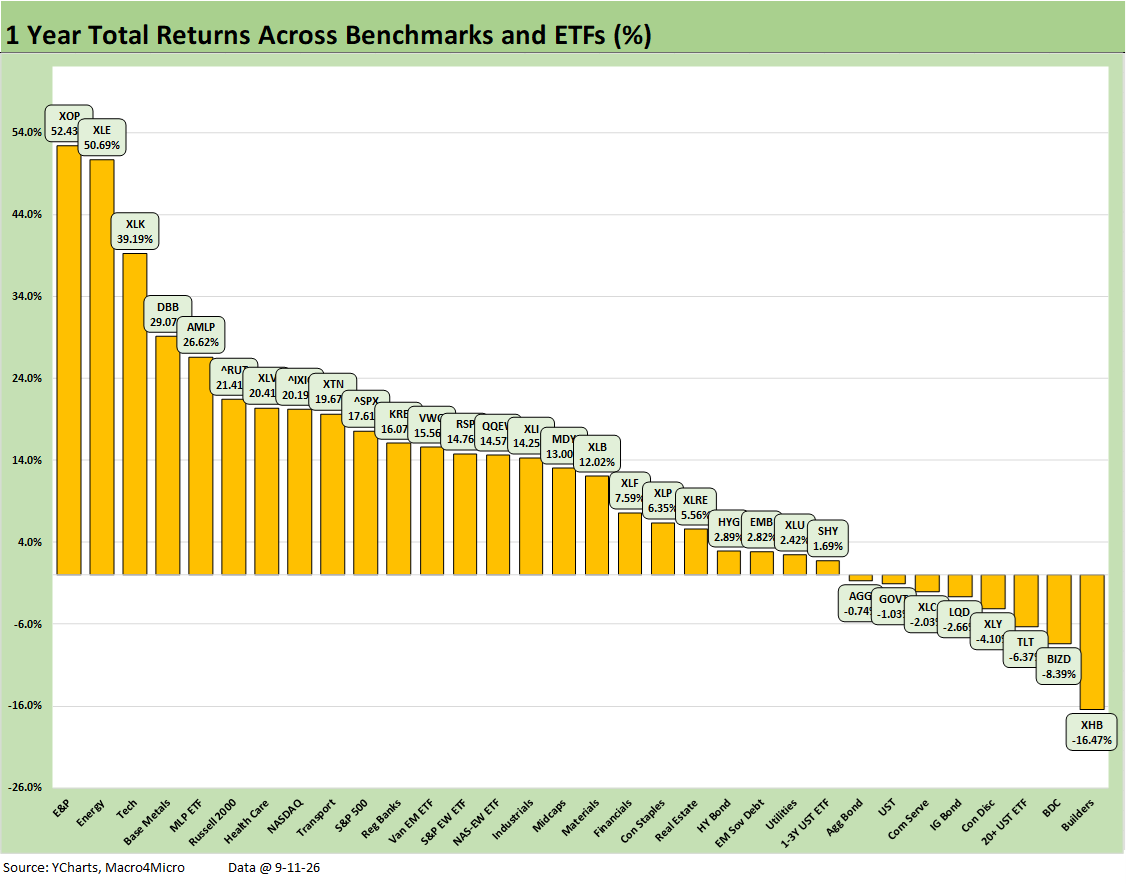
The running 1-year positive-negative mix has been slowly trending more negative than the low single-digit counts of earlier weeks. As of this week, the score is 24-8. As recently as the Aug 23 update, the score was 29-3.
We see more bond ETFs joining TLT in the red zone with IG Corporates (LQD), Consumer Discretionary (XLY) turned negative and Communications Services (XLC) joined the negative range.
XLY had some major underperformers such as Lowe’s, Home Depot, DoorDash, Booking Holdings, and TJX. XLC has problems with negative numbers from Meta, Netflix, Comcast, and T-Mobile.
See also:
Weekly Returns: Benchmarks and ETFs 9-12-26
Weekly Tech Check Returns 9-12-26
UST Curve: A Brutal Week 9-12-26
CPI Aug 2026: Staying Stubborn, Not Accelerating 9-11-26
Existing Home Sales Aug 2026: Headwinds Still Driving the Story 9-10-26
PPI August 2026: Leading Indicator Signaling Struggling 9-10-26
Weekly Tech Check: Semis vs. Software Push-Pull 9-7-26
Weekly Returns: Benchmarks and ETFs 9-7-26
Duration Daze: Post-ZIRP Bond Returns 9-7-26
UST Market: Curve Meets Knuckler 9-7-26
Payroll Aug 2026: Trouncing Low Expectations is “Positive” with an Asterisk 9-5-26
Market Commentary: The Curve 8-30-26
PCE July 2026: Mixed Consumption, Stubborn Inflation 8-26-26
2Q26 GDP: 2nd Estimate 8-26-26