
Spread Deltas: Not Rattled but Vulnerable
We look at the 1-week and 1-month spread deltas across the credit tiers.


We look at spread deltas across IG and HY credit tiers as fundamentals are not shaking the credit markets too much (yet) in terms of total risk premiums vs. history.
The US HY spread widening is showing concerns over the adequacy of risk compensation, but HY OAS is still running below long-term medians while set against a higher “risk free” asset than we have seen since before the credit crisis.
Duration has hurt total returns across HY and IG bonds while the absolute levels of spread change have been growing the excess return effects.
HY has not been helped by how equities have behaved, but a coupon beats a risky asset price sell-off in some markets for total return and cash flow support for certain portfolio profiles (e.g., pension benefit payments, retirees, etc.).
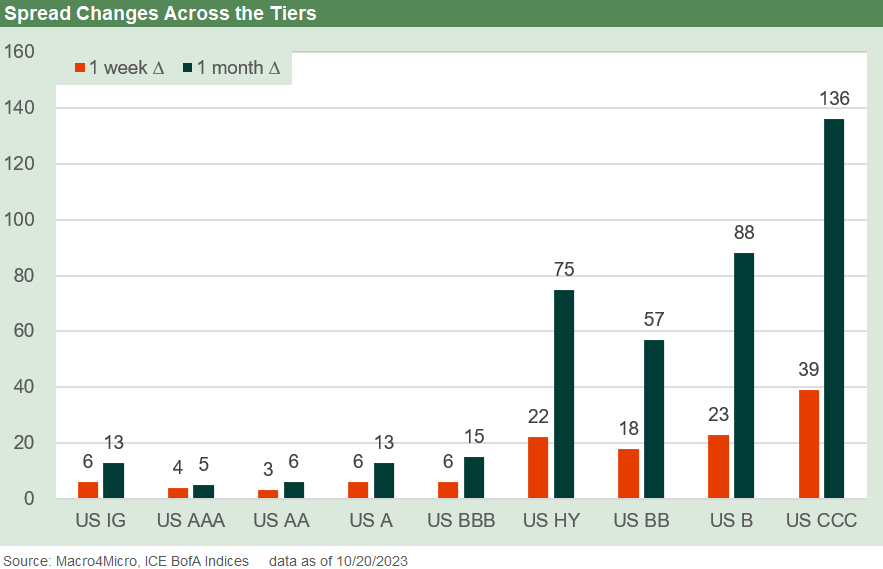
The above chart frames the spread deltas for 1-week and 1-month across the credit tiers. It is clear in the numbers that the market is experiencing some quality spread widening. The sustained yield curve migration is undermining risky asset markets and hurting fixed income returns (see Footnotes & Flashbacks: State of Yields 10-21-23) and causing choppy equity markets (see Footnotes & Flashbacks: Asset Returns 10-22-23).
The state of yields certainly matters in the asset allocation decision and flows. The supply and demand side of the UST markets has been dominated by debates around Fed policy (fed funds), but the discussion is now moving into the area of term premiums. Duration trends have weighed heavily on IG bonds.
The more straightforward discussion is whether the “commodity” of UST supply is just too big to avoid repricing the market and keep the steepening underway. In addition, the fiscal profile of the US takes such a beating in Washington tirades that the rating agencies and market may be creating their own “mental risk premium” that lacks a spread framework in a market so large and liquid (and growing!).
The “UST spreads to itself problem” is not a punchline, but the market can demand higher yields on relative credit risk vs. where it “should be.” The conversation starts to sound inane, but supply and demand should have made Newton’s short list.

As the crow flies across the credit cycles, the HY OAS is still below median. We are starting to see some of the late year spread widening we have been expecting but had not seem much of since the mid-summer lows in spreads were down under the +400 bps OAS threshold. The +75 bps trailing month widening still leaves the HY market modestly tight to where last year ended (+481 bps, ICE).
The long-term trend line for HY spreads takes some of the alarm out of the widening. HY OAS is heading back toward the median and is 20 bps inside it as of Friday pricing. We always get back to the simple question of whether this is a median risk or above median risk HY credit market. We would say this is an above median risk.
The pushback in our internal debate is that this is a below median “risk mix” of issuers and industries with a BB heavy flavor in contrast to past cycles. The HY market is also over $1.3 tn in face value and requires a lot of demand in a world with many credit risk alternatives in loans and private credit for allocation.
The refi and extension boom of 2020-2021 has bought time for many issuers and cleaned up many capital structures (higher unsecured mix termed out at low coupons, etc.). The 2020-2021 refi and extension wave allowed the loan market ample room for alternatives and repricing opportunities for lenders when the time is right in coming periods and the need is there for liquidity (bond or loan refi or otherwise). Many had been hoping for easing, and that looks unlikely.
The low end of the credit tiers is much more vulnerable since the day will come when a coupon repricing freight train will be headed at some highly leveraged issuers. The rise of private credit has broadened the range of lenders, and the high UST rates bring all-in new issue coupons closer to long-term nominal equity returns.
This challenge always gets back to the asset allocation decisions across equity or credit risk and the relative mix of returns (coupon income vs. price). With the IG and HY market around 85-86 composite dollar prices, the accretion income is an unusual twist in evaluating options. The par weighted coupon in IG is just under 4% and just under 6% in HY. Basically, the decision menu expanded.
The impact will be more benign for many BB tier and “quality B” tier names, but the interest cost line change will be significant in the next refi process. Some borrowers might not have an easy time on structural expectations when that time comes (2L anyone?).
Those “refi needed” periods are when quality spreads will reprice more dramatically and in theory from the bottom up as CCC tier and more marginal B tier names start the decompression trend in a more meaningful way. Those quality spread updates will be for another day.
The risk mix is more a list of ingredients than a recipe…
The mix of risk factors across industries and issuers run the gamut, but the fears of yield curve fallout on the cycle and geopolitics is spreading into more nervousness on strains in global financial stability. That escalation worry is more about forward looking pathways rather than where we stand now and on a recent trailing basis. The GDP numbers this week are likely to remind everyone of a constructive current set of economic variables.
The economic metrics numbers out of the consumer sector have been solid and industry and nonresidential construction have held in well enough (see links at the bottom). The decent fundamentals are in fact the problem behind the yield curve expectations.
Spreads ahead, nerves frayed…
We still see room for more HY OAS widening through year end with the low end still vulnerable and default expectations rising. Domestic politics and geopolitics are any combination of unpredictable and depressing, but both political risk variables (home and abroad) can spill into consumer confidence, global trade, and questions around economic and financial stability in some key developed markets. Ukraine is not going away any more than the eroding, tense relationship with China. Ukraine is very important to the #1 trade partner (Europe) with the US and #1 US export market (see Trade Flows: Deficits, Tariffs, and China Risk 10-11-23).
Defense budget debates in Congress will heighten the rhetoric around the need for more investment in defense and security. The dark and stormy commentary intrinsic to making the case (“the US and the world are in greater danger”) has the effect of promoting division and anxiety that is not the usual aphrodisiac for consumer spending, traveling, and hiring.
Recent Research:
UST Moves: 1988-1989 10-20-23
UST Moves 1978-1972: The inflation and Stagflation Years 10-18-23
Yield Curve Lookbacks: UST Shifts at Cyclical Turns 10-16-23
Economics:
Sept Existing Home Sales: The 7% Solution Running Low 10-19-23
Housing: Starts, Completions Firm Sequentially, Permits Down 10-18-23
Industrial Production: Holding Pattern 10-17-23
Retail Sales: The Consumer is Alive and Well 10-17-23
September CPI: Big 5 Buckets and Add-Ons 10-12-23
Trade Flows: Deficits, Tariffs, and China Risk 10-11-23
Contributors:
Glenn Reynolds, CFA glenn@macro4micro.com
Kevin Chun, CFA kevin@macro4micro.com