
Sept Existing Home Sales: The 7% Solution Running Low
Existing home sales keep the bad streak going with 8% mortgage headlines.


The reality of more 8% 30Y mortgage quotes from lenders is settling in even as we meet the offseason blues and the potentially rising toll of consumer debt service overall.
While this is certainly not late 1990 ahead of the Gulf War, the question of how consumer sentiment will weigh big ticket decisions is more worrisome with the world threatening to melt down and Washington diving below the bar of very (very) low expectations on functionality.
Affordability keeps eroding and the forces of supply and demand still exist, so the existing home vs. new home conundrum and the “rent vs. buy” decision remain alive and well as potential homebuyers check their list of options.
We look at the weekly Freddie Mac benchmark each week but also like to watch what Mortgage News Daily (MND) and some other housing/finance publications have to say. MND has a mortgage index that hit 8.0% yesterday after running at 7.92% the day before. That 8% hit the headlines and all the superlatives that go with it (“highest in 23 years,” etc.). The mortgage rate at 8% drives home the “golden handcuffs” just got tighter. Watching the needle move on price will not offset the monthly payment effects. Rates dominate and volumes stay low.
The balancing act of “need to buy now and refinance later” vs. “wait until later and rent for a while” can be driven by many factors. Rents are coming down in many areas but going higher in some and especially in the suburban single family rental space according to some of the trade rags. Multifamily is seeing steady growth in supply that will help ease the inflation pain in many markets and shift the cost of housing (vs. “owning”) in many metros.
Higher for longer has been a tough force to reckon with as we cover in our weekly Footnotes publications (see Footnotes & Flashbacks: State of Yields 10-15-23). The wrestling match over term premium models and the common sense of an inversion at least moving toward “flat” if we aren’t having a recession has been a bad scenario for a while for duration and mortgage rates.
There are still plenty of cyclical bears running around, so the higher rates go, the more the forecast will shift toward consumers being stretched, lenders getting defensive, and fixed asset investment doing a double take at higher costs of capital and cyclical fears.
The unfolding war in the Middle East also just took a turn for the worse with the hospital headlines and the potential for scenarios to get out of hand. That is where the flight to quality question mark comes into play and how a shifting discount on recession odds could trend if oil starts spiking.
Existing home sales details by the numbers…
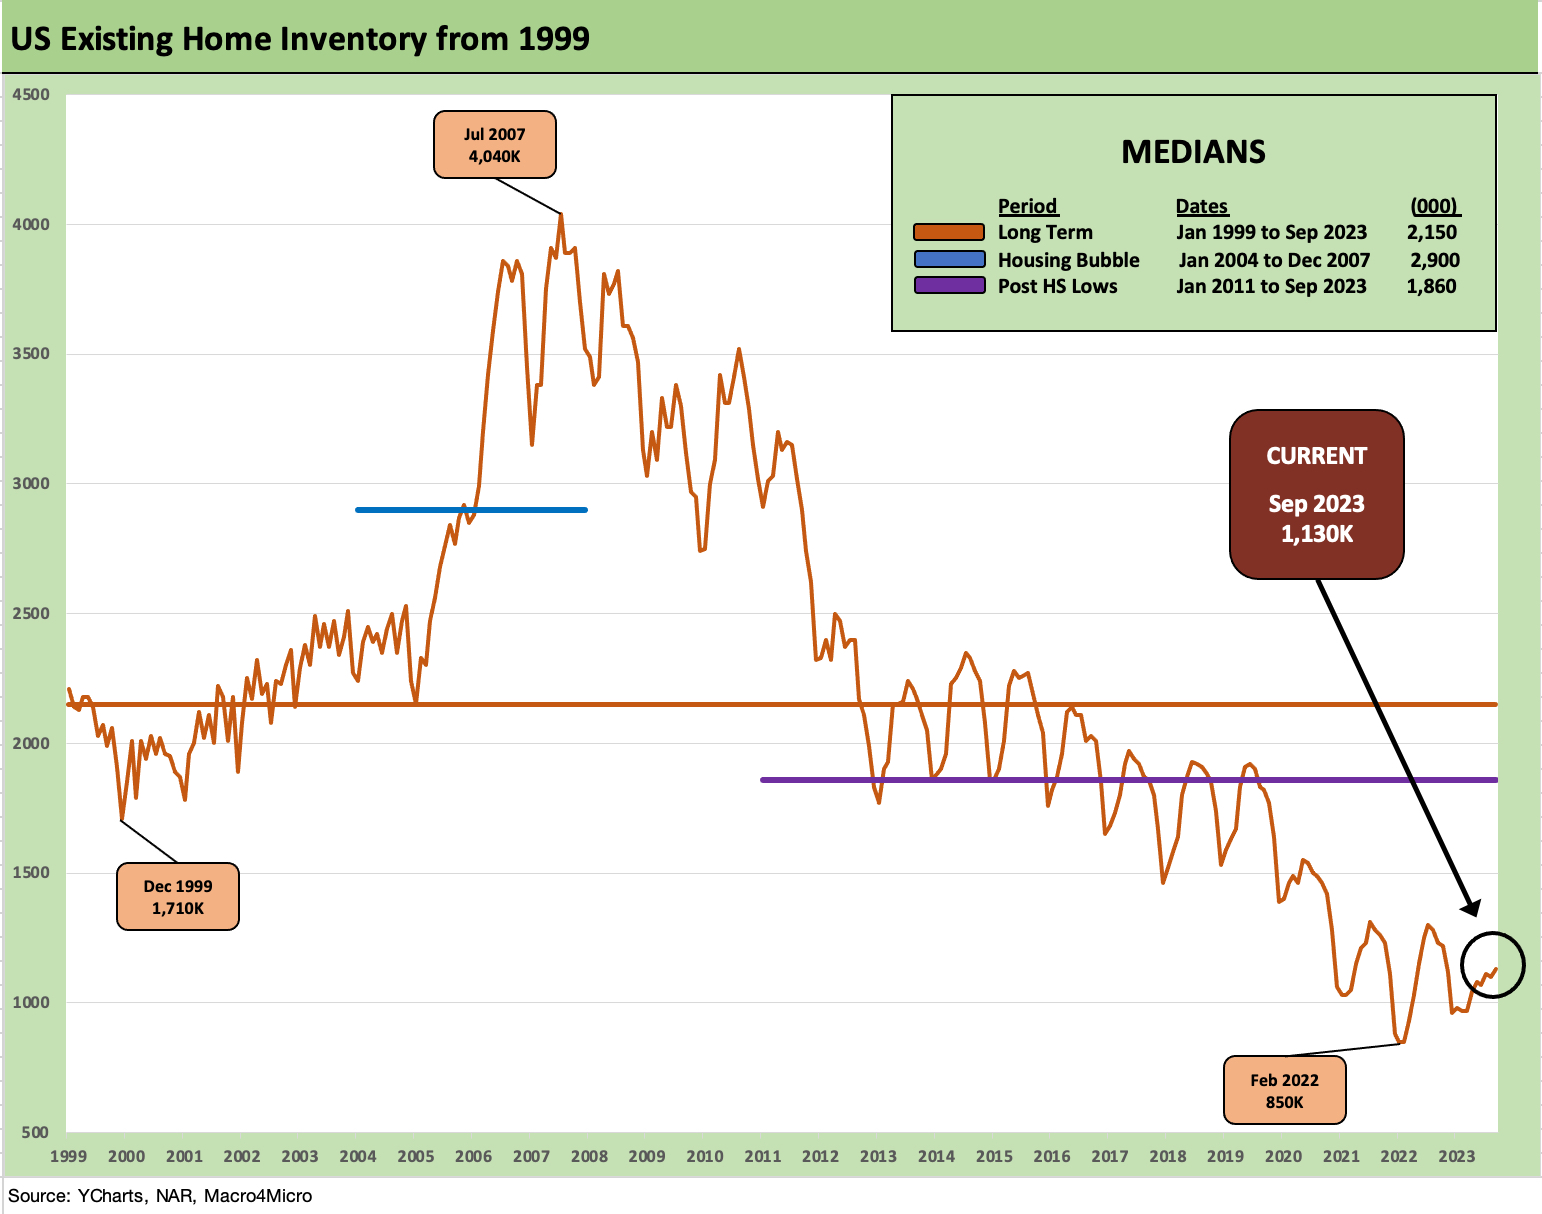
The above chart tells a very straightforward story of low inventory but still higher sequentially and still off the lows of Feb 2022 that sent home prices into ballistic mode. The low inventory levels are obviously driven by a very different dynamic tied to a lack of sellers who cannot walk away from the typical 3% handle mortgages held by so many homeowners.
The 1.13 million units was up sequentially by 2.7% from August but down YoY by 8.7% (from 1.23 million). Supply and demand is a pretty basic concept and the balance has kept valuations firm. The demand side is fading and that shows up in lower median prices. The price sellers want and the price they will get remains a challenge although monthly mix shifts by region and price tiers keep things a little less clear.
The home equity valuations and median price trends have been covered ad nauseum in housing commentary (including ours), but we would note that the median ($394.3K) dipped below the $400K after 3 months of $400K+ months. The median price was still higher by +2.8% YoY so homeowners and mortgage lenders can feel good about their positive home equity for owners and asset protection for lien holders.
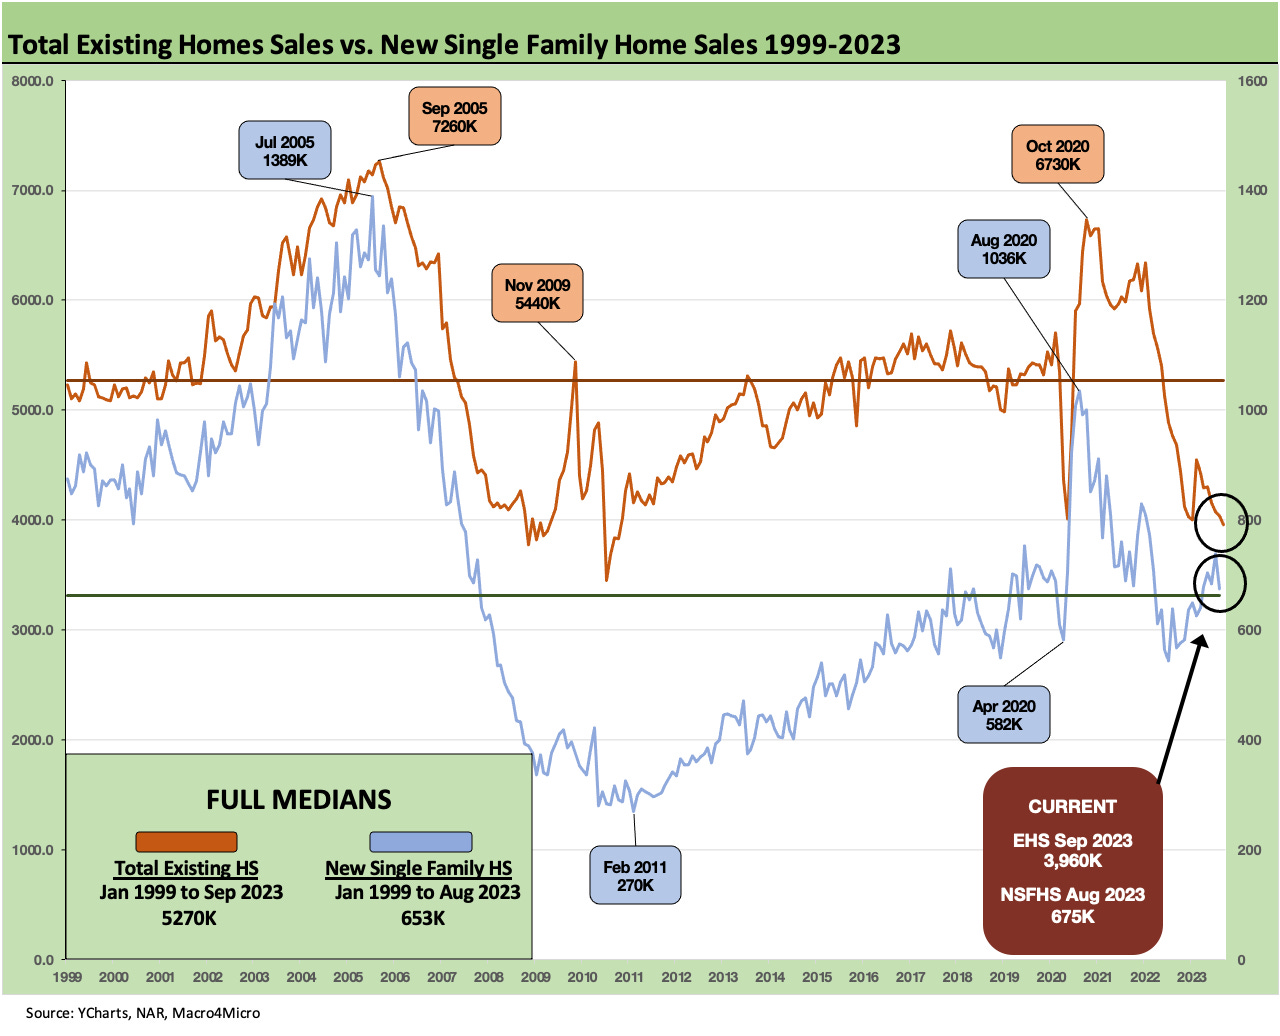
The above chart updates the “existing vs. new” sales time series, and builders continue to pick up share as we have covered regularly. The ability of builders to target price tiers and products and build to a price at a cost that allows a projected margin have helped builders flourish this year.
Sustained 8% mortgage rates would lead to weaker volumes and a gradual lowering of inventories (i.e., cash generation) as spec inventory gets run down, contracted homes get delivered, and decisions are made around the rate of starts and permits (see Housing Starts, Completions Firm Sequentially, Permits Down 10-18-23).
The healthy large cap builders have an edge in their ability to facilitate financing through their mortgage units or JVs and offer a mix of buydowns or fee incentives that still allow them a profit on an all-in basis net of costs. The supplier chain gets mixed reviews depending on the builder (and that builder’s supplier chain clout), but the backdrop is far better than what sent inventory plunging to historical lows and prices soaring after COVID – at a time of extremely low mortgage rates.
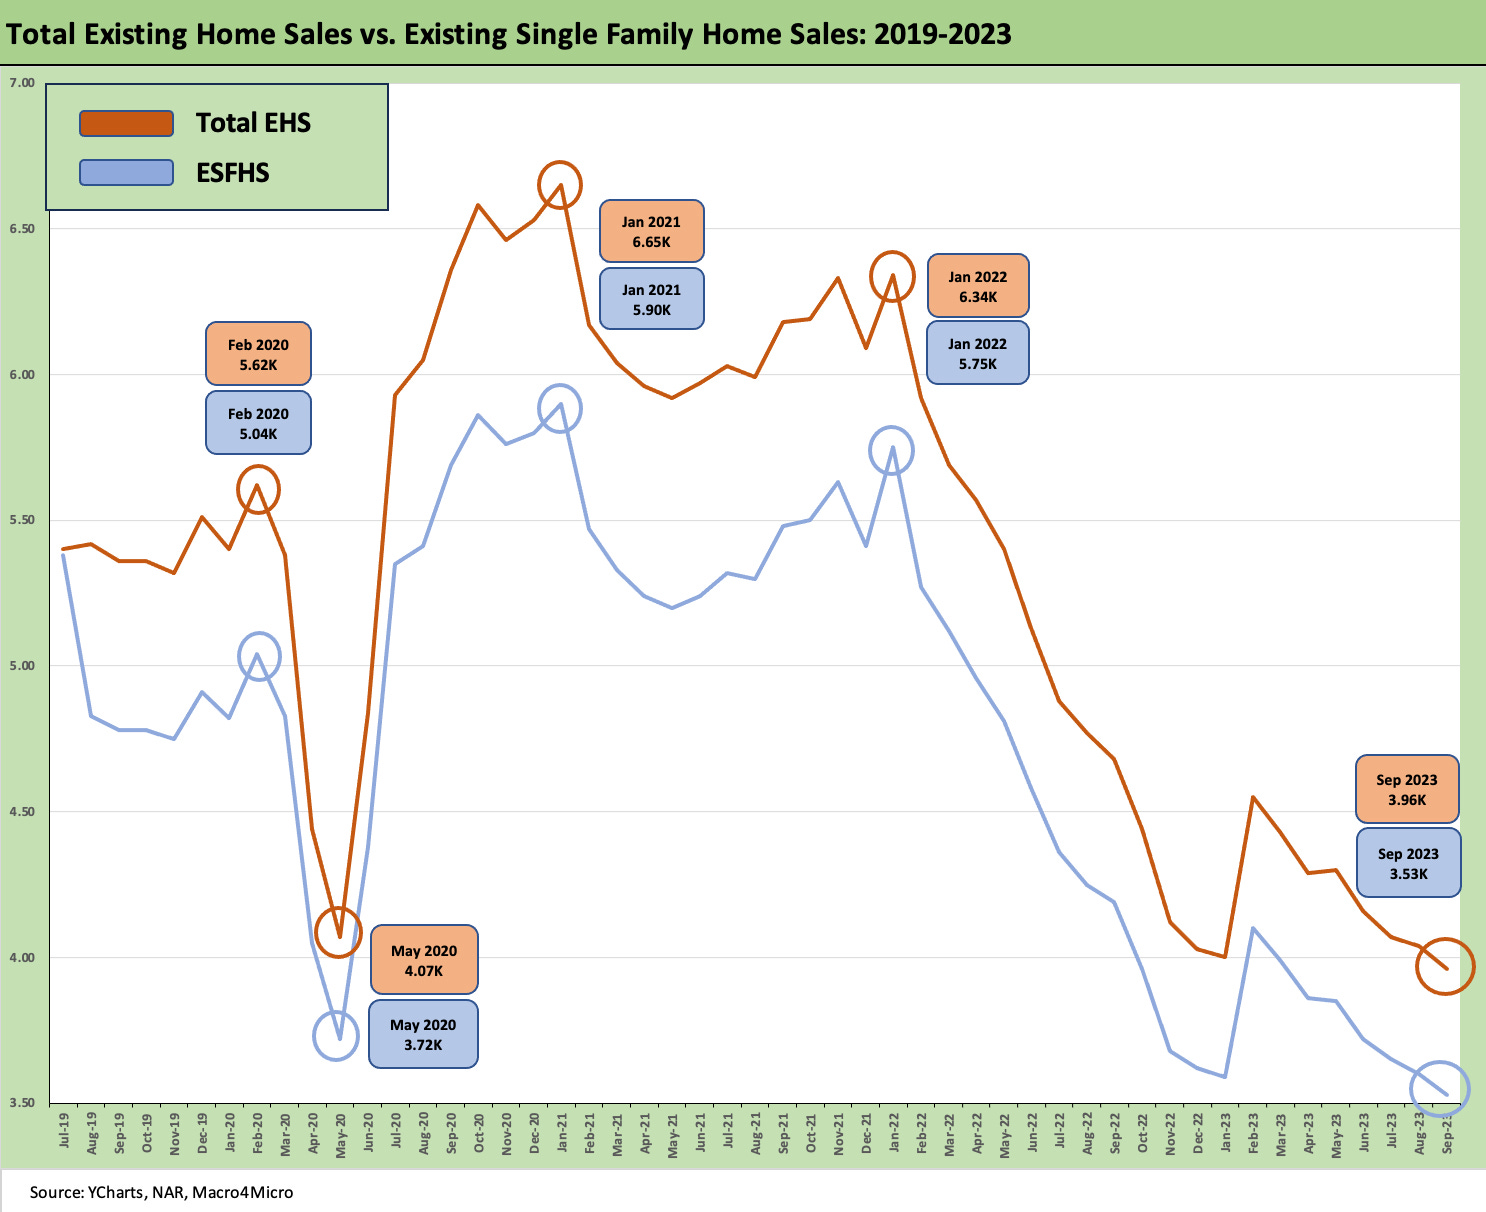
The above chart frames the time series for total existing home sales (including single family, townhouses, condos, and coops) vs. existing single family homes. The two lines offer some nuance on the same broad trend – as in low supply and low activity in historical context. For condos and coops, volumes are well below the 2021 peak of 707K.
Condo and coop sales in Sept were down -2.3% sequentially and down -12.2% YoY. Sales prices for condos/coops were +6.8% YoY to $353.8K. For an example of the high end, the West posted prices of $509.2K. The low end was the Midwest at $247.5K.
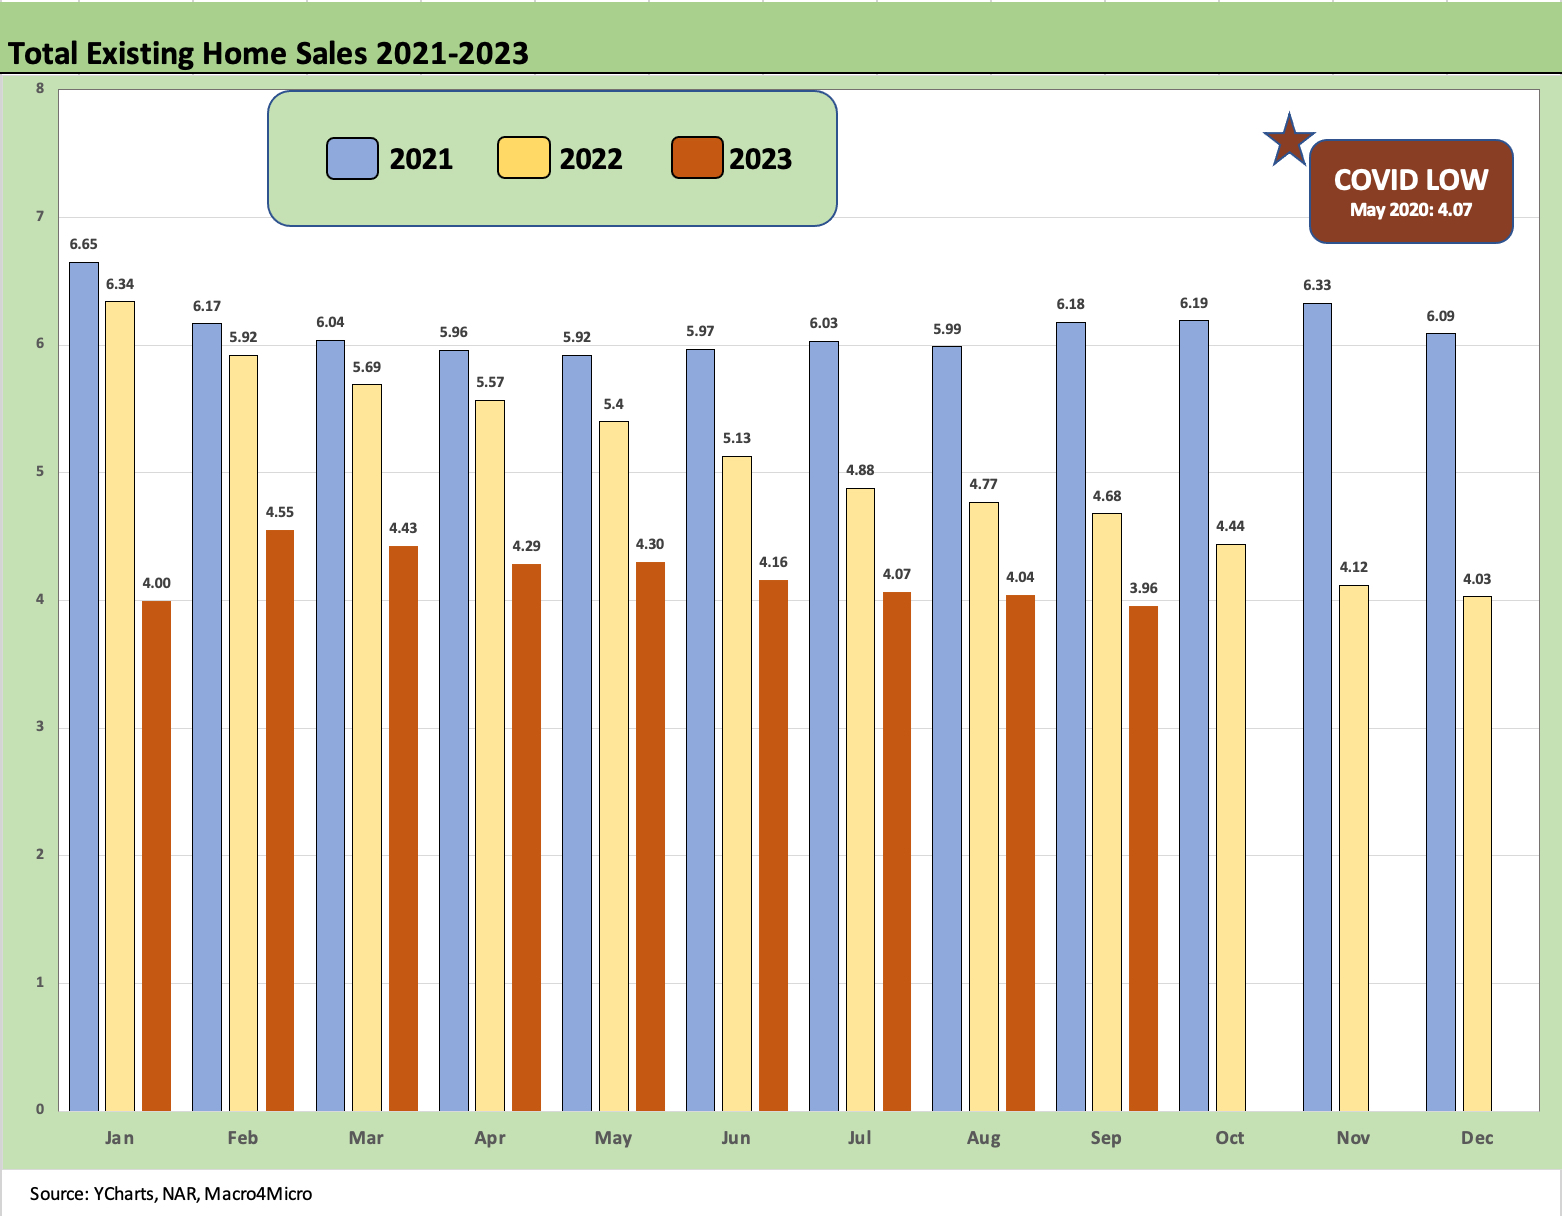
The above chart tells an easy story as the volumes are well below the lows of COVID (4.07 in May 2020) and for 2023 (4.0 in Jan 2023). From what we can gauge, it is among the lowest since the NAR started to disclose these stats in 1999. There apparently was a lower month registered in 2010 from what we could dig up, but 2008 and 2010 ended the years with 4.1 million handles for those full years. 2023 will be down near the bottom as a full year and will be in the area of 2008 and 2010.
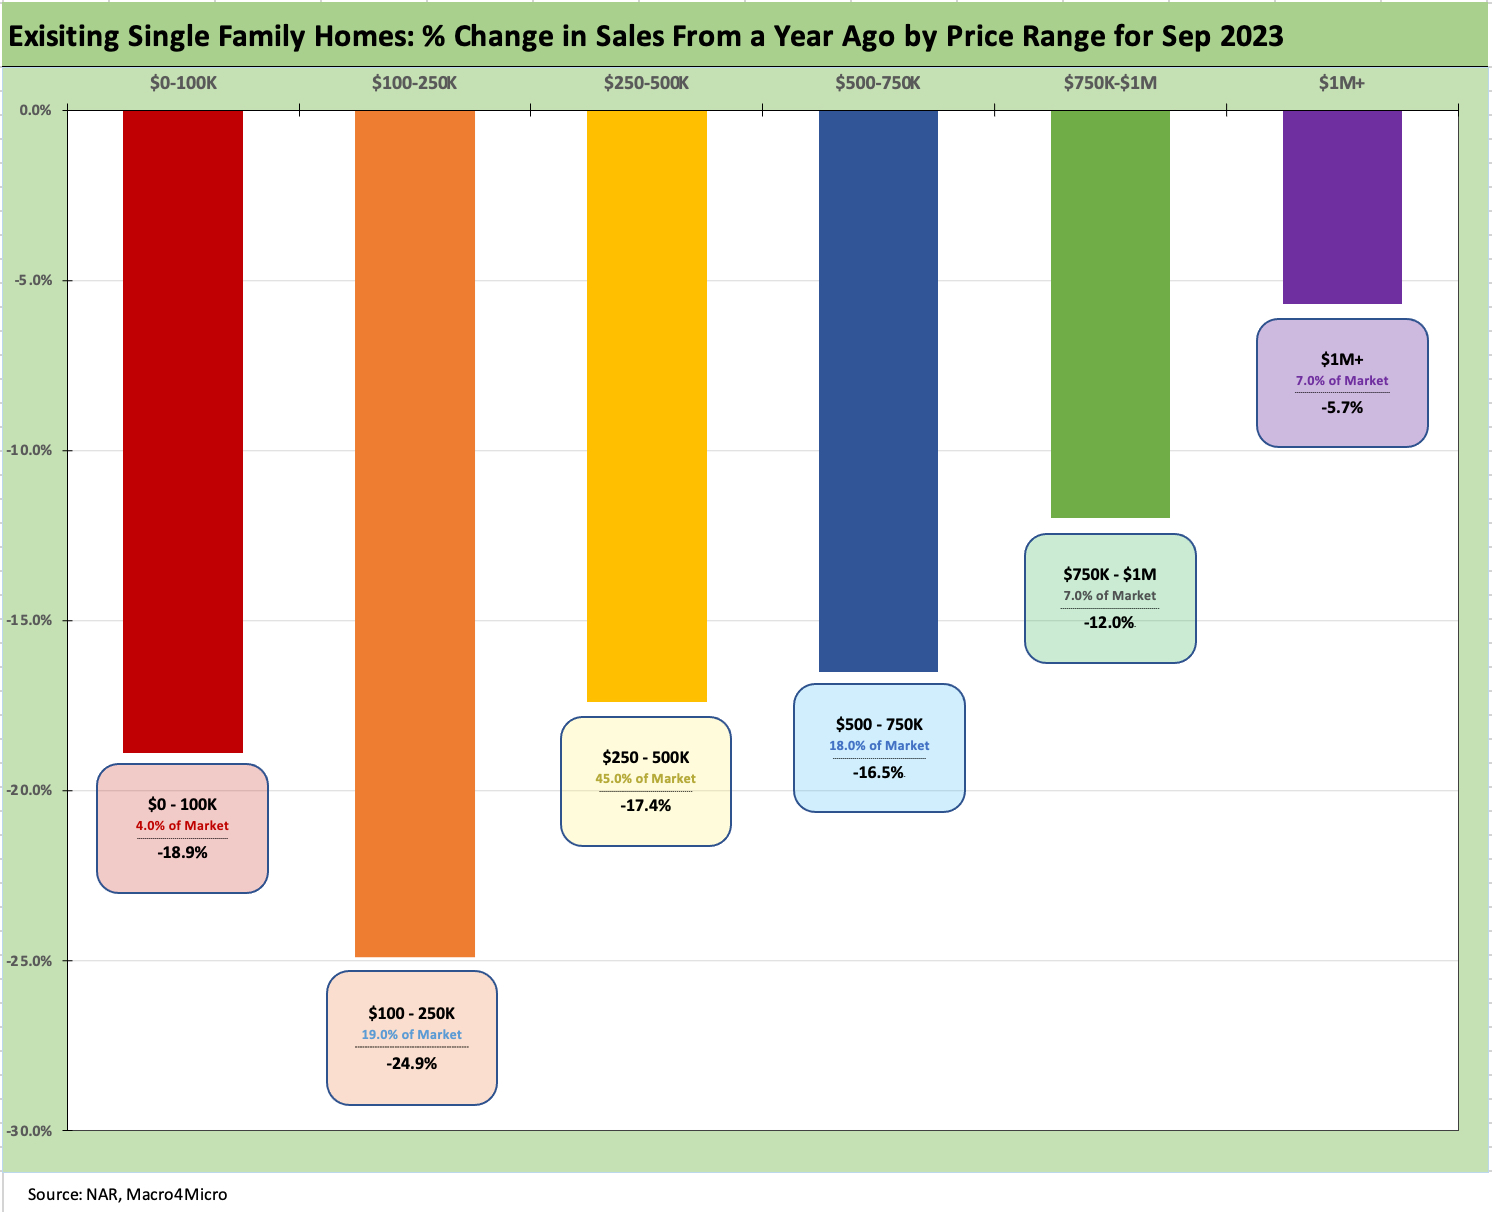
The final chart frames the sales trends by price bucket. The chart shows the share of the overall market held by that price tier and the YoY decline. The sweet spot of $250K-$500K is down over -17% while the $500K-$750K is down over -16%. Together, those two tiers are just under 2/3 of the market.