
Housing: Starts, Completions Firm Sequentially, Permits Down
We look at a respectable showing for new residential construction despite rates.

As the industry heads into the offseason and rates are working against the industry, the balancing act between starts and completions and permits has proven to be a dance that the builders do well as they manage what are very resilient cash flow dynamics for the industry.
The painful trend in affordability for buyers and the lack of willing sellers is still the core story line to read for the industry, as builders can see hope in record payrolls and a steady consumer but on the flipside cannot see serious signs of relief in rates.
The new fixation on UST curve term premium theories and what constitutes a “normal” UST does not change the simple fact that the market must still face the less exotic and “intellectually low brow” realities of supply and demand – for homes as well as the massive UST supply ahead.
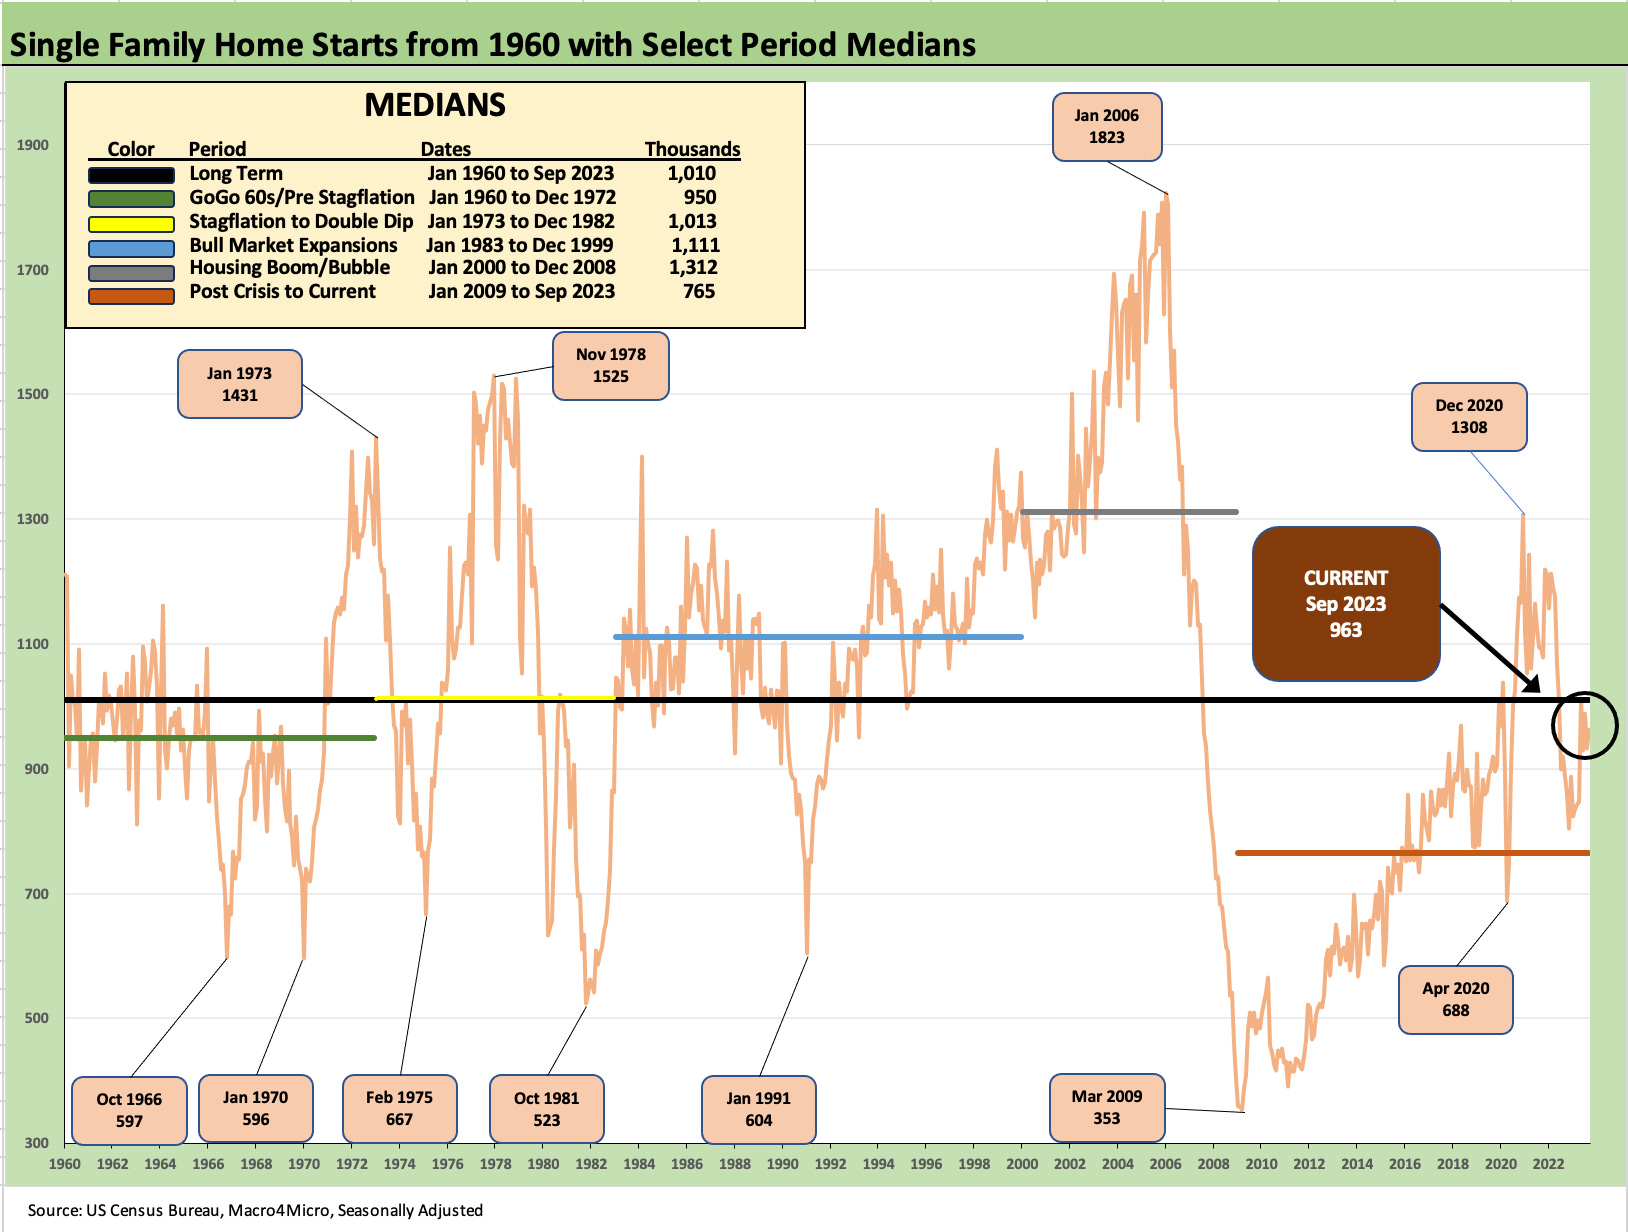
The above chart plots the long-term timeline for single family starts. We look at multifamily details further below. Single family was positive YoY, but total starts for all housing including single family plus multifamily was down by over 7% YoY after the market saw multifamily decline by over -31%. During 2022, multifamily was cranked up. That is a separate story that gets into the optimism of supply bringing down shelter inflation.
If we had to pick one benchmark to watch it is this one since it is the core of what makes the homebuilders that we follow tick. For some other housing related names (e.g., Anywhere/HOUS), existing home sales are the main event. The homebuilders – whether in single family or multifamily - bring the key multiplier effects all along the chain across suppliers (materials to equipment to freight and logistics providers), subcontractors (i.e., payroll counts), and a longer tail of related services industries (brokers, mortgages finance, insurance, state and local fees and taxes, etc.).
The various subsectors of the housing markets are of course all intertwined, and it is a tough market in context. The record payroll counts and growing population in the US is still putting up single family starts numbers below the long-term median as noted. The current level is below most of the time period medians we note in the chart, and it is more in line with the 1960s. The post credit crisis median is well below current rates.
The brutal affordability shift in such a short time frame off such a low UST curve of the post-crisis years has allowed builders to pick up share while crippling the existing home sales volumes. That has kept prices firm and home equity values resilient. For the homeowner not interested in selling, that might be more about confidence. For the home seller who wants to sell but faces the golden handcuffs of a current low mortgage, that is a separate theme. For the main names in the market that we watch in the homebuilders, the net effects promise financial stability since the builders control the swing factor of working capital management and confident cash flow planning.
Housing starts in some ways constitute the votes from the builders on how they see their current inventory (completed or under construction) balancing out with their inventory and community count plan. The sequential trend for monthly single-family starts was favorable at +3.2%, and the increase YoY also help provide reassurance at +8.6%. Demographics and supply-demand imbalances for housing remain a very firm underpinning.
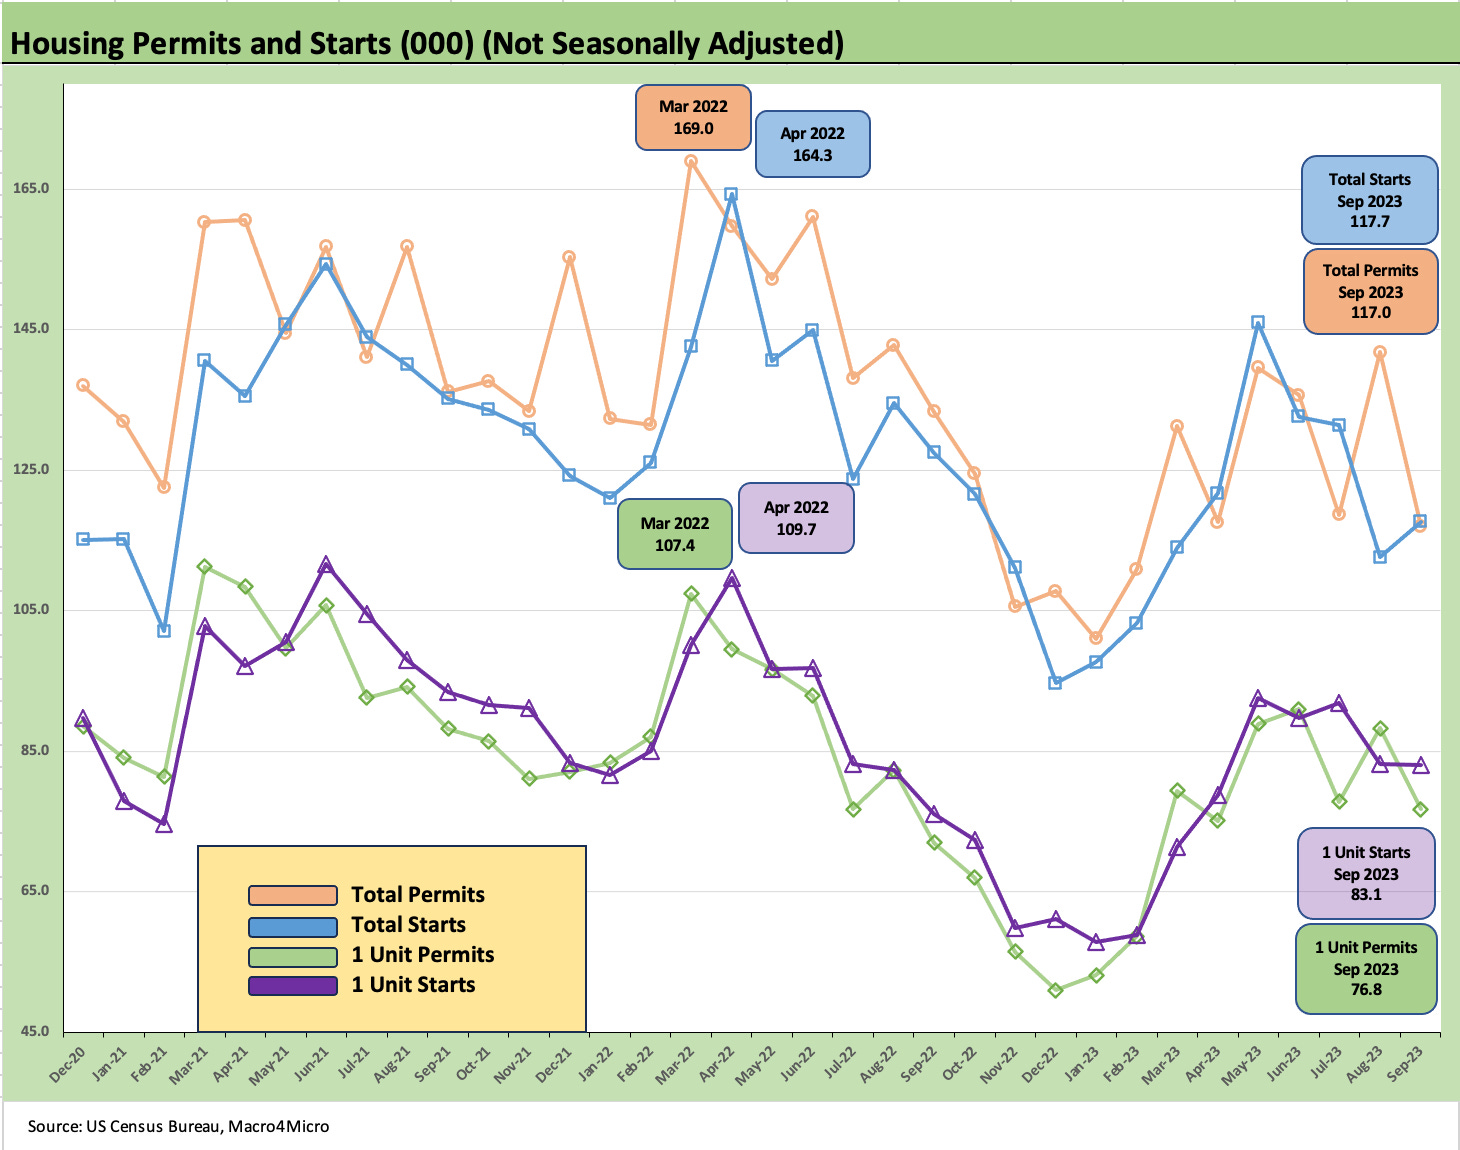
The above chart plots the trend line in total starts and single family starts on a “not seasonally adjusted basis” to reflect the activity on the ground.
For single family, “not seasonally adjusted” shows permits are down sequentially while the SAAR versions show the permits higher sequentially. On a YoY basis, single family permits were modestly higher “not seasonally adjusted” and higher on a SAAR basis also.
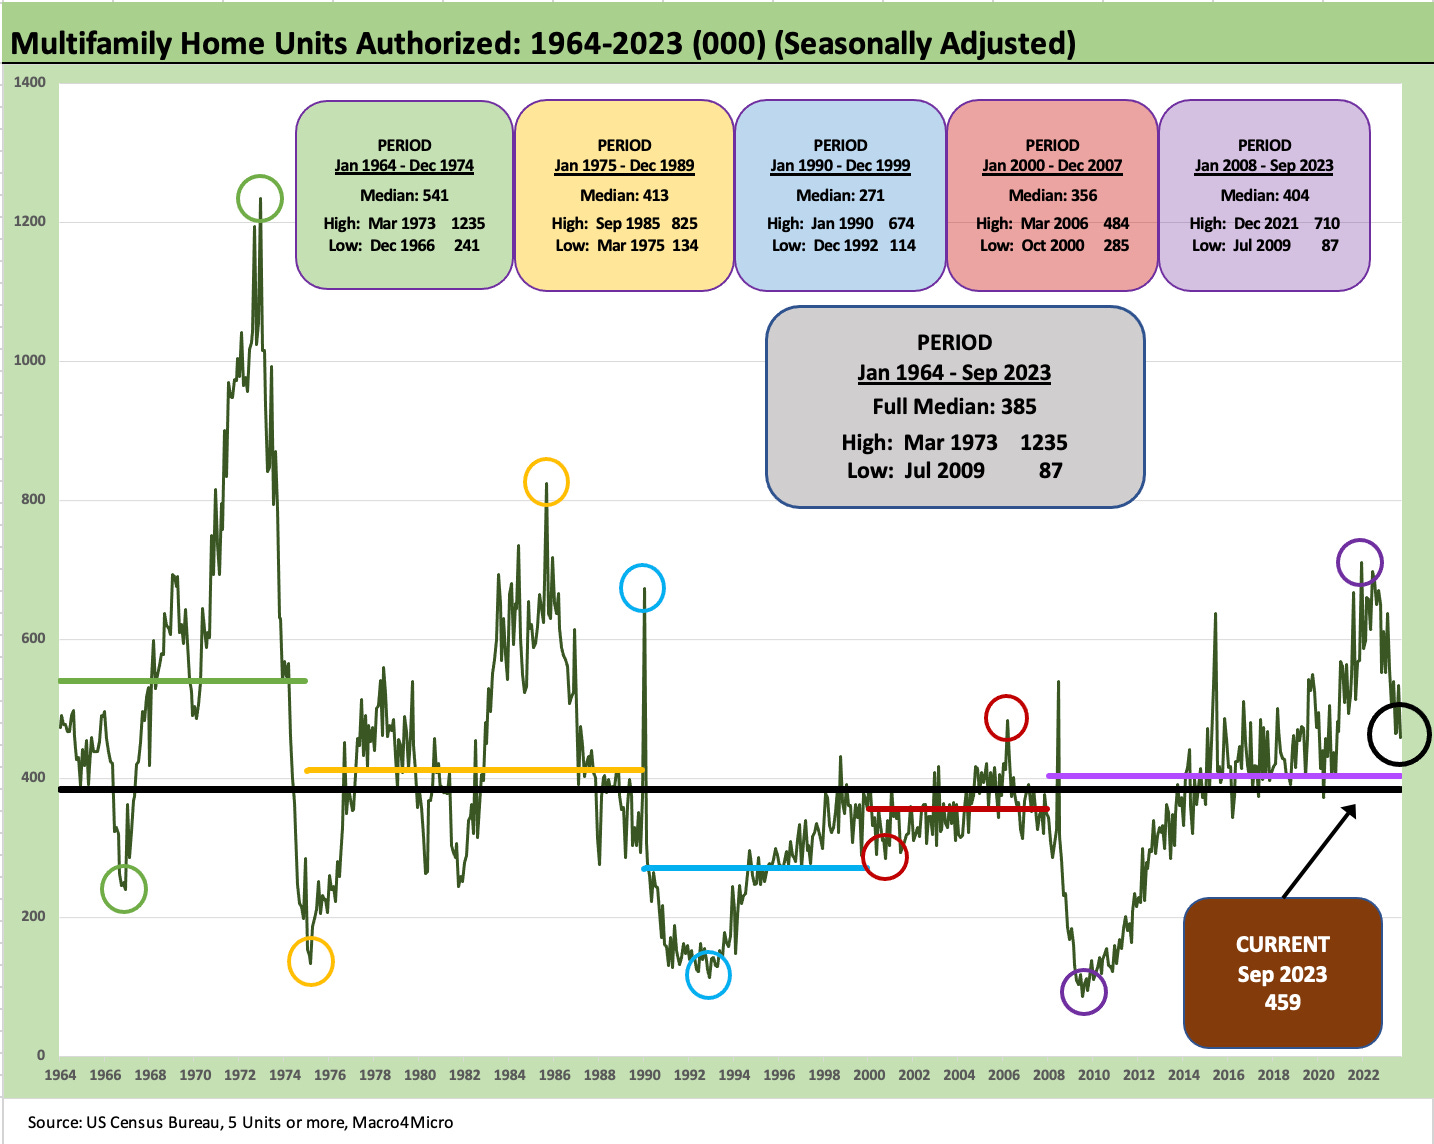
Multifamily 5+ units are showing a sharp contraction after a heavy base of investment and construction activity not seen in decades across 2022-2023. On a SAAR basis, 5+ units were down -14.0% sequentially and down -31.6% YoY. 5+ units also decline sharply sequentially and YoY.
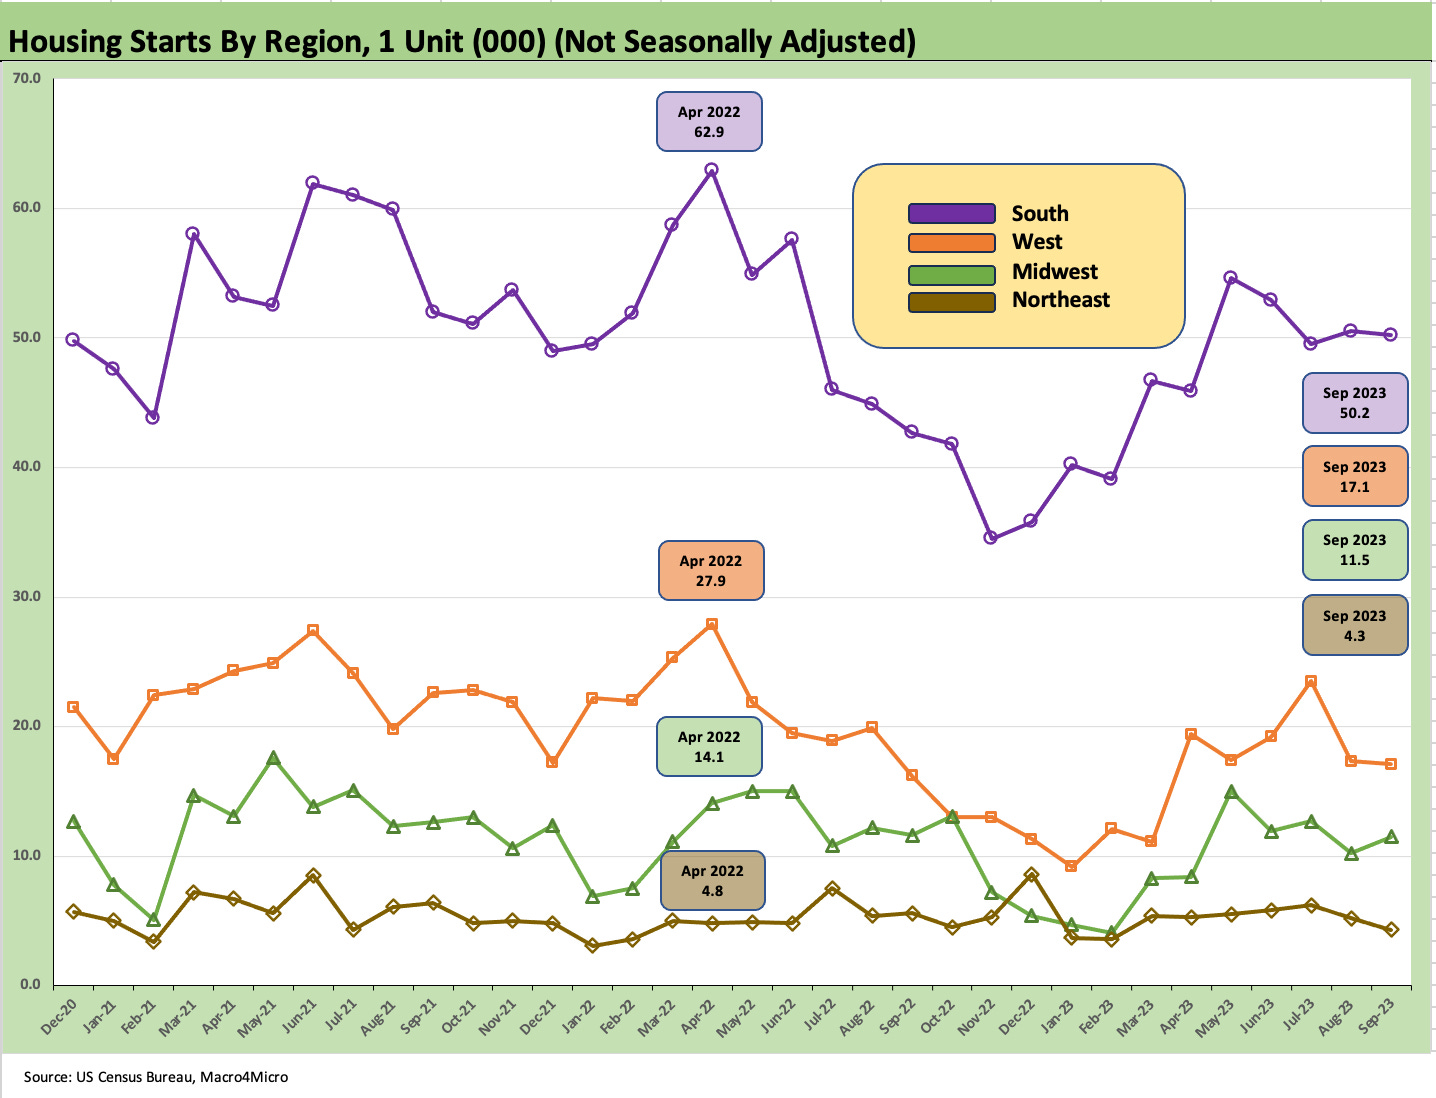
The above chart plots the single family starts by region on a “not seasonally adjusted” basis (again, to reflect the activity on the ground). The important South region as the #1 market (with the two massive markets of Texas and Florida) held in well sequentially as did the West, the #2 market. The Midwest ticked higher and the small Northeast market faded from August.

The above chart details multifamily starts and the chart below shows multifamily permits activity.
We have been discussing the multifamily dynamics in earlier monthly reports, and the recent markets are showing the pullback in permits (-31.6% YoY 5+ unit permits) and starts (-31.5% YoY starts) with a +15% increase in completions on 5+ units YoY and +10.9% increase in units under construction. Essentially, the multifamily sector is still very busy.
Recent Research:
August New Homes Sales: Feeling the Burn Yet? 9-26-23
August Existing Homes Sales: Same as It Ever Was 9-21-23
Housing: Sequential Starts Ease, Permits/Completions Mixed 9-19-23
You are a fast writer
Glenn how do I contact you directly
Question to ask?
Thx