
Trade Flows: Deficits, Tariffs, and China Risk
We update the state of affairs in trade flows and revisit China import/export risk.

We update the recent trade flow and import/export relationships of the US with major trade partners with some extra focus on the China relationship.
We update key Goods trade metrics (imports, exports, deficits) and detail the largest product categories of China trade since the China relationship will be the one the markets will worry most about in 2024.
The market got a dry run on what major supplier chain disruptions mean during COVID and the aftermath, so the threat of major disruptions in US-China trade (whether tied to Taiwan or a mix of other geopolitical stress points) will remain one of the leading macro risk factors along with inflation, the UST curve, the consumer cycle, and the likely escalation of conflict in the Middle East.

The above chart and others herein hammer home a few points. At the top of the list is that tariffs don’t reduce trade deficits. If the Trump team had reducing trade deficits as a priority, they demonstrably failed. The Goods trade deficit eclipsed pre-Trump records (which were under Bush in 2006-2008) in 3 of his 4 years and rose from the prior year in 3 of 4 years.
The reality is that when the US economy gets stronger, the deficit rises as consumption rises because so many of the imports that flow into the US are consumer based. When Paul Ryan and crew recommended a 20% Border Adjustment Tax (quickly killed by the GOP Senate and not even considered), I recall some retailers getting on TV to say such a plan would assure bankruptcy. Imports fill the shelves and racks.
The relationship of trade deficits to US cyclical trends was evident in the trade deficit increase off the 2009 lows. There were many other factors of course such as widespread decisions by US companies to find low-cost sourcing for their needs. We see that pattern again in 2019, which showed a lower trade deficit. That deficit decline was about more than the China tariffs. The economy was slowing in 2019, and the Fed moved to ease as a result (Trump tends to forget that part of the story in his pronouncements on the “greatest economy ever.”) The year 2019 was the only year in his term that the Goods trade deficit declined. The post-shutdown, post-vaccine 2020 Goods demand spike then pushed the deficit higher to a new record in 2020 and the same in 2021 under Biden.
Biden’s tariff policy is much like that of Trump in broad strokes though with some rebadging of the Section 232 tariffs (National Security) to other names (quotas, trade agreements, etc.). In contrast to Trump, Biden figured out that calling a nation (Canada) that is second in command at NORAD a “national security risk” was not a stroke of genius. The same could be said of NATO allies. That said, Biden has kept a tariff and protectionist strategy in place and even added some. Protectionism ruled under both.
Under Biden, the substance of the “trade deficit fixation” seen under Trump gave way to the political expediency of “not taking away what has been given” to a domestic constituency. The labor alliances also encouraged tariffs. The outcome with Biden is thus pretty similar to Trump’s policies with record trade deficits in Goods during both 2021 and 2022 despite tariffs.
The spike in crude oil can distort some of the trade deficit numbers on a trend basis for some nations such as Canada, where Canadian heavy crude oil is much desired by US refineries (notably in the Gulf of Mexico). The 2022 oil price spike drove a much higher Goods deficit with Canada in 2022 vs. 2021.
We will look at the NAFTA (we don’t like the USMCA label) product flows in a separate commentary. Ex-crude, the US has traditionally maintained a trade surplus with Canada. This is a highly reliable ally, a Democratic nation, and a NAFTA trade partner. That might become a bigger issue after this past weekend’s events.
Overall, Biden kept the Trump policies and has had the same results.
Why do we watch trade flows?

We always like to watch the trade flows for a range of reasons including how it reflects the overall level of economic activity. At a more basic level, incremental deltas in trade deficits will add or deduct from GDP. Swings in deficits and inventories can be the difference between positive or negative GDP growth given how low UST growth has generally been in the new millennium.
The timelines above on imports and exports tell a useful story. The easy visual is that the import growth continues to run well ahead of export growth. On a positive note, economic activity has over time been rising steadily and much of that incoming import flow drives a lot of multiplier effects in the US economy. Higher rates of growth in the world are not a bad thing (someone has to buy our growing UST supply).
The increased level of activity on both sides of the US border cuts across services (freight and logistics, including warehousing, real estate, finance, retail, etc.) and manufacturing (low-cost sourcing of suppliers from materials to components). As discussed herein, when looking at both imports and exports, the numbers can get wagged by the price of oil and by disruptions in such major export line items as aircraft (deliveries and production disruptions).
The EU as a linchpin in US global trade…
The importance of the EU and its economic health in the bigger picture in trade is captured in the chart below. Europe is both the #1 export market for the US and the #1 importer into the US, where there are extensive operations (autos, trucking, chemicals, equipment, etc.) owned by European companies in the US.
As a microcosm of that relationship, the extensive investment in the US by European automotive and commercial truck makers brought the expansion of jobs, dealer networks, related financial and credit services, and all the multiplier effects across supporting economic interests and regional economies that come with such expansion programs. BMW and Mercedes are big auto exporters. BMW certainly wags a lot of port activity in South Carolina.
In other words, US interests are served by the health of Europe in multiple ways. The significance of Ukraine is thus no small matter in how Europe can prosper if Putin continues down the “Stalin Part Deux” path. The embrace of Putin and animosity to Ukraine in some pockets of the US thus is rooted more in political axes and old grudges than common sense on how important a strong EU economy is to the US.

Trade data can frame how well we compete in some major product groups and in major industries such as aerospace. The supplier chain anxieties that were driven home by COVID and China disruptions will make trade monitoring a more regular activity again. We saw the effects in 2018-2020 when Trump got very aggressive with tariffs, trade threats, and used more than a little brinkmanship in trade negotiations. Farmers took a beating, and the trade deficit needle was not a winner.

Monitoring trade flows can also signal how well the US, Mexico, and Canada are operating under NAFTA. Trade flows with China can be a barometer of how much systemic risk we have in trade with China. We spend more time on China in the second part of this commentary. We will revisit trade data for the EU and Europe broadly in a separate commentary.
The above chart used YTD (not LTM) data and updated the profile of the Top 15 trade partners. We break out Europe and the EU and Euro area separately. The Top 15 comprise almost 75% of US trade. If we include the EU at #1 as a single bloc, the Big 3 comprises almost 50% of US trade (55% with all of Europe as opposed to EU only). The NAFTA partners are at #2 and #3. If we drop in China for a Big 4 with total Europe, the trade share is over 66%. An important distinction for the NAFTA partners is that a lot of the two-way flow is owned by US entities.
Oil and gas trade flows as a growing product segment leader…
As we look ahead at any combination of oil/gas product imports and exports (crude, refined products, natural gas, LNG), those trends can tell a story. Through the summer, “Petroleum Refinery Products” and “Crude Oil” ranked as 2 of the Top 3 exports LTM with Aerospace and ahead of Pharmaceuticals and Natural Gas in the Top 5. The two energy categories were #1 and #2 in 2022.
The GOP debate hosts should ask about that hydrocarbon export ranking in the GOP debates as they rage about the lack of Energy independence. Biden won’t bring it up since he will get yelled at by his Climate voters.
The US will see its energy exports to the EU grow and that is already in evidence. That flow of hydrocarbons might have just gotten more important over the weekend given how events such as wars tend to get out of control. Russia-Ukraine fallout had already driven many US energy projects much higher on the strategic list of priorities.
The US election year of 2024 will keep energy independence on the front burner as a hot topic in the US that could get hotter if the OPEC+ group takes exception to the justified responses of Israel to the latest tragic events. The GOP will really be pushing the energy growth narrative against Biden with a goal (in part) of making his life difficult with the pro-Climate (some refer to it as anti-carbon) crowd.
The GOP keeps the lack of energy independence high on its topic list to attack Biden. Someone should show them a map of Canada (apparently little hockey interest in the GOP candidate lineup…maybe Trump can annex Alberta with his Sharpie pen).
Much of the energy independence discussion is false and misleading (the US will have record oil production this year and next year per EIA and already has record natural gas production). Most political theme-spinning abuses or stretches facts to convey a message. Biden clearly does not want to counter with the point of record highs since he needs a pocket of his voters to think otherwise on upstream expansion. To be clear, Biden did not encourage record production; market forces and the industry determined that.

The above chart breaks out the highest LTM trade deficits by trade partner. We use the EU as a trade partner and then break out the leading nations. The rise of Vietnam to the #4 trade deficit (#3 nation ex-EU) is a reminder that hitting China with tariffs does not necessarily bring business back to the US. Cheap labor sources can simply relocate (Trump was going to hit Vietnam with high tariffs on currency manipulation, but he had a bone spur flashback. Plus, he ran out of time with the election).
As covered earlier, wider trade deficits can be traced to the superior US GDP growth in recent years vs. the 2019 slowdown and early 2020 shutdowns. The rebound in demand in 2021 on the post-COVID rebound sent deficits wider for a “good reason” – a US recovery. The concept is simple enough: strong economy, strong demand, and then a lot of goods come flowing in from where they can be bought at the lowest cost all-in even with tariffs.
The existence of purchasing managers/departments in many companies and the creation of entire industries (“MROs” or Maintenance, Repair and Operations services providers) happened for a reason. Low-cost supplier chains are a fact of life. Policy goals to unwind them is up to Congress and the White House. Just don’t pretend that there is not a price and expense effect that borders on being a Newtonian law.
Those structural realities cannot be unwound with lofty speeches from a pulpit or repeating the word “fair trade” over and over. The throw-a-tantrum, slap-a-tariff-on strategy led to higher prices or lower margins depending on the existence of substitutes. They are intrinsically inflationary. China reductions in imports helped make Vietnam a Top 10 trade partner.
There is also the issue of where US-owned, low-cost operations might exist or where contractual relationships are in place. Those are not advanced econometrics or especially lofty concepts. They just seemed to escape Navarro, who spent much of his time attacking allies and not just China (His PhD advisor was my favorite Professor in Economics. He must be whirling in his grave). That was a “Green Bay Sweep” of misapplied economic principles.
Protectionism is here to stay…and will get worse.
We got busy drilling down in the US trade picture back when Trump took the helm in 2017 since he was very focused on the liberal use of tariffs despite advice from his Goldman gang and various experts. He was using the trade conflict as a vehicle to raise his visibility. While he liked to show he could throw his weight around, his goal was to reduce what he viewed as the ultimate US weakness – the trade deficit.
We will not revisit the depth of his conceptual framework on the topic (“thin” does not capture it). The “good trade deficit” vs. “bad trade deficit” checklist for the largest consuming nation in the world is for another day (or in an intro macro cliff note pamphlet he failed to read).
The US has the largest consumer economy and consumer credit appetite in the world (borderline ravenous). When times are decent (or even mediocre), the US consumer spends. Where those goods come from is seldom their main focus. The “cost of sales line” is a focus for the seller, however.
The overriding tariff question that they don’t ask in the debates…
This is a question we bring up (probably too often). One question that someone might ask Trump or Biden or any other candidate in 2024 goes like this:
Who pays the tariff? The selling country or the US buyer? (hint: the buyer).
We will keep asking that question until someone asks the question in a political debate or someone asks Trump how he collected “billions and billions from China” (and where is all that cash?). I would assume someone like DeSantis or Ramaswamy can answer it. Then again, maybe not.
The other reason we dug back into trade topics back in 2017-2019 was that period marked the reworking of NAFTA (into USMCA), as well as a tweaking of Japan and South Korea trade deals. There were more than a few clashes of the Trump team with the EU that devolved into a tit-for-tat exchange that achieved very little. We looked at some of these issues in detail in an earlier piece (see Midyear Trade Flows: That Other Deficit 8-9-23).
The China clash is the most threatening trade scenario for both sides. We saw very costly retaliation to the tariffs that Trump slapped on China with immediate retaliation against the US agricultural sector. The ag sector was crushed and then taxpayers bailed them out. That was an economic loss on bad (and dishonest) trade policy underwritten by taxpayers.
Numerous econ wonks have debated the cost of various bailouts (net of money repaid and securities monetized), and the ag sector bailout comes out as very costly and materially higher than loans and equity investments to the major banks in the crisis of 2008-2009. The same is true for the auto bailout comparison. The bailout of the ag sector was justified. However, an honest reassessment of the viability or economics of the tariff programs was not likely by policy makers then or now (with so many tariffs carried over).

The above chart breaks out the leading import trade partners. The EU is now by far #1 and Mexico has moved ahead of China also. We highlight more of the product mix and details on China trade narrowly further below in this piece.
China is in many ways a systemically important trade partner, and that cuts both ways. China’s product mix in the trade flows runs the gamut from critical tech and manufacturing supply chains to medicine to low end consumer goods. As the rise of Vietnam to the #7 importing nation underscores, China is not the only low-cost player to tap.
The usual election year macho hardball will be on display this year on who is the toughest guy in the debate on China. The plan to threaten China on trade should probably not be accompanied by a plan to lob missiles into Mexico to fight drugs. Those two are closing in on 1/3 of the supplier chain.
Mexico is still seeing more close ties with the US auto sector including in EVs. Low-cost assembly is still the reality of the advantage for Mexico that the UAW is trying to counter with tougher plant closing strike recourse and more product commitments. The same is true with Unifor (formerly Canadian Auto Workers).
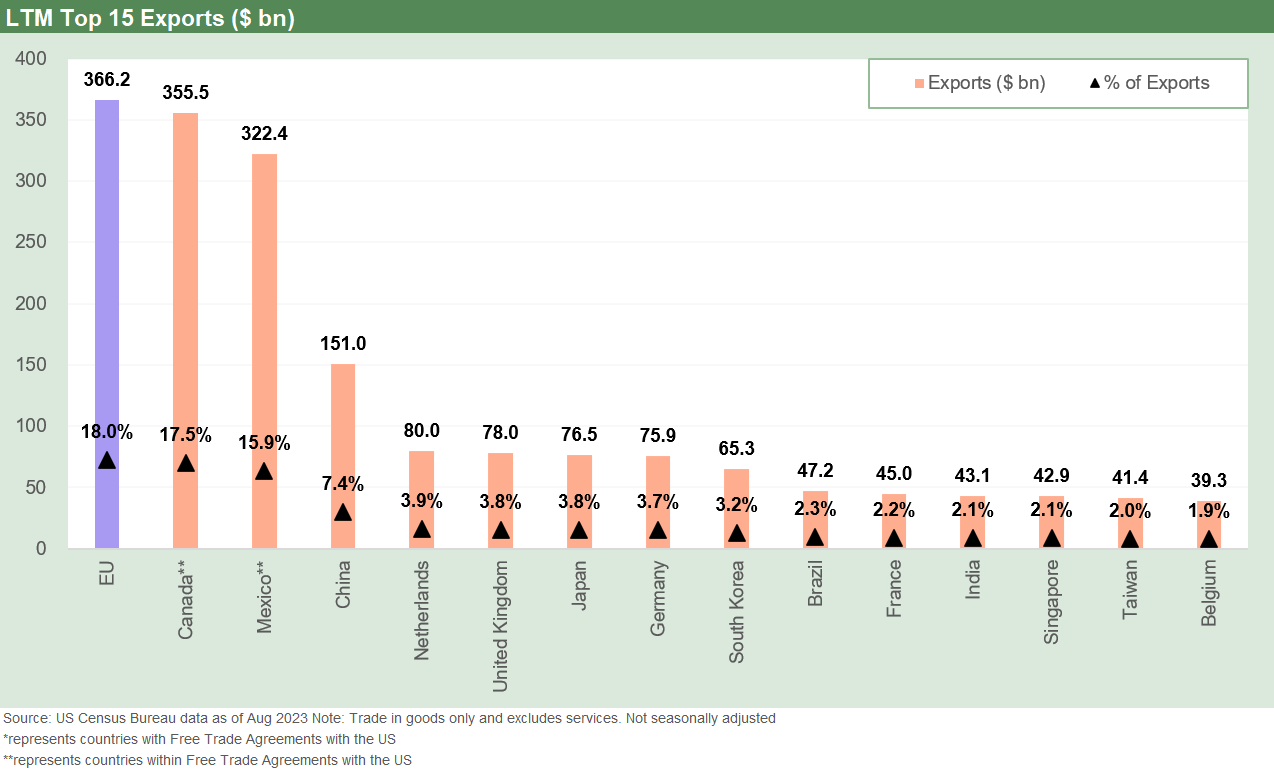
The above chart lays out the Top 15 export markets with the EU and NAFTA partners ruling the mix. We then list the other individual countries including the single European nations. We did not find the approach to German trade deficits as fair or particularly astute under Trump. He had threatened Germany with auto tariffs since the Germans were not buying more GM and Ford cars.
The reality was that GM and Ford had been Big 6 players for years in Europe and simply got beaten (badly) on the competitive playing field. Germany did not buy the GM and Ford cars made there – let alone the ones made here in the US. That in turn led to massive downsizing and sales of operations (Opel, etc.)
We have looked at each major nation in Europe and their trade positions with the US, and we will revisit those in later commentaries. The US is very strong with many countries in some key product groupings, but autos would not be one of them. Aerospace (Airbus) has been very impressive across the decades and picked up material market share against the 737. The US is now a major exporter of oil and natural gas into Europe and that will grow meaningfully in coming years as more LNG projects come on line.
Europe is very competitive across a wide range of high value-added products and has a material edge in the US on autos with their luxury models. The UST trade deficits in autos include components that feed into European transplants and passenger vehicles. In the US recovery in export markets, it is no coincidence that Germany is very strong in the US export market.
The China systemic trade fears…
When we get the question now and in the past on what the biggest worries are in terms of shock risks, we have occasionally said “something in the C family”:
China: Since there are so many things that could go wrong geopolitically from Taiwan to trade wars. China certainly has major structural risks across a massive economy that has not had its modern capital markets era bank systemic crisis – yet. The US has had several with 2008 being the worst since the Great Depression. Many see the China bank system as a black hole of mismarked loans. That is likely true since the same was true in the US in the 1980s (think marked LDC loans for much of the decade). China is certainly one where “hard landing” fears have been a common refrain every cycle.
Currency: Layers of whiteboard crises can be crafted including another C risk, “currencies.” In the narrow case of China, the underdeveloped controlled nature of China capital flows has been highlighted as a risk in a throwback to the 1992 European currency crisis. Among the few constants in life…dollar bears predicting a currency crash never go away. Someone always has something to write about.
Counterparty risk: This one could be framed as “connectedness risk” after the systemic bank system crisis of late 2008, but it is really more about “bank interconnectedness risk” (I am cheating on the “C” list). The domino risks of cascading counterparty collapses when market risk and hedges become credit risk is now well recognized as something more than a war game. Asia had one major crisis already outside China in the meltdowns of 1997-1998, but China has very successfully navigated the cycles since.
Credit contraction: Credit contraction from the banks or market risk aversion is also an old one at this point. The time-honored relationship is “Credit expansion drives economic growth, too much credit creates bubbles, credit tightening drives recessions, and severe credit contraction and shutdowns drive depressions or at least asset value collapse and high unemployment.” The theory in China is high unemployment and contraction would mean social anarchy (the US can create social anarchy in an expansion, but that’s another story).
Consumers: The consumer sector drives the risk of recession and potential for a soft landing. PCE is over 2/3 of GDP, so that one is obvious. Betting against the US consumer has seldom been a good wager. It takes a lot to shake them. A US consumer contraction would also fall hard on China exports which are already under pressure.
Capex: The fixed asset investment profiles of the economy are the swing factor below the PCE line in the GDP accounts. The US market has seen a material rebound in construction markets that have helped support growth (see Construction: Project Economics Drive Nonresidential 10-2-23). The capex cycle had faded on Trump in 2019, but the lag effect of the infrastructure bill, CHIPS, and the EV and LNG incentives have elongated the expansion and capex cycles. The US has a policy priority of encouraging companies to pull back their China JV interests into US supply chain investment.
As we gear up for 2024, we rate China at #1 for shock risk but the US bank connectedness risk is rising again as well after what the market experienced in March. We thought about adding “Congress” as a “C threat” but we put that more in the D family (dopes? dummies? And whatever else comes to mind).

The above chart plots the time series for China imports and exports, and the systemic nature of the relationship is clear. There is a mutual dependence there that is hard to reconcile with ever-growing animosity. It is like a sumo wrestling match on a high dive (empty pool!). Both might go over the edge, but one is unlikely to have the strength to throw the other one off.
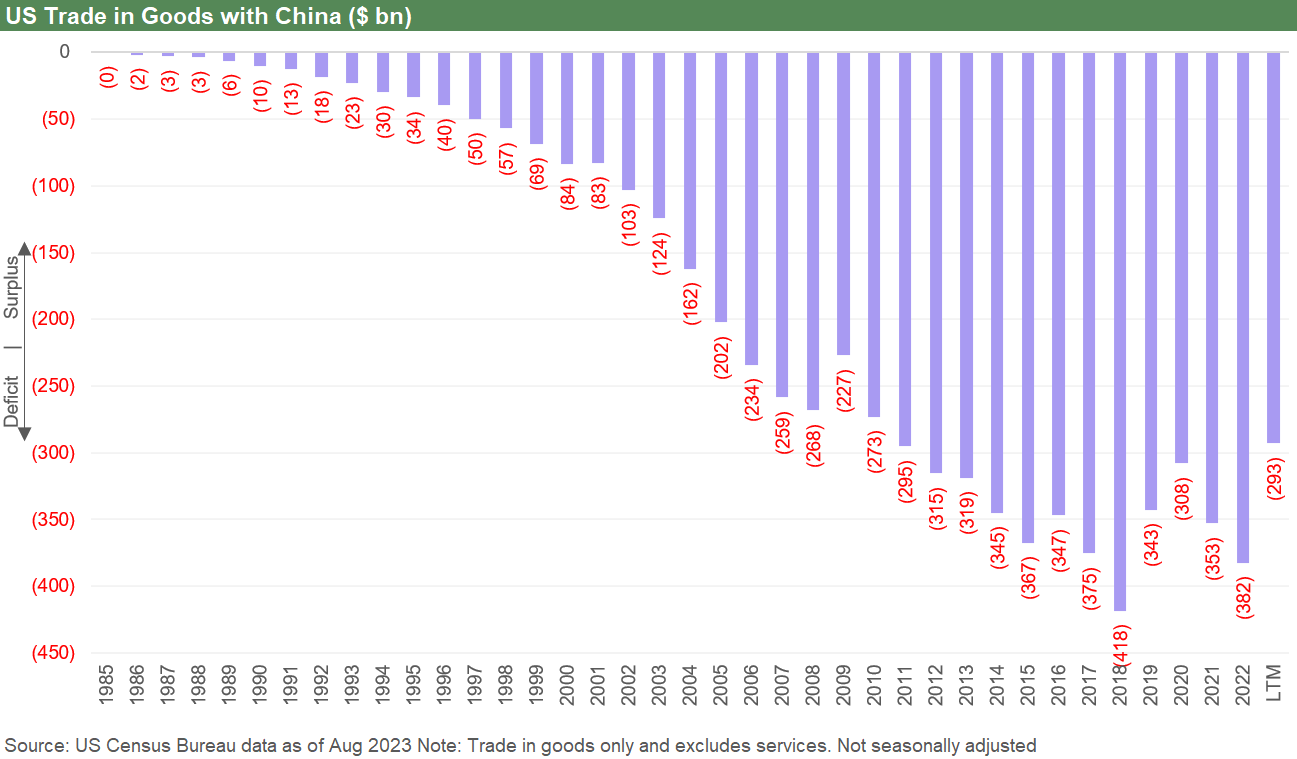
The above chart updates the narrow trade deficit of US China, and we see the numbers whipped around in recent years after a 2018 peak. That volatility in the China numbers show the LTM period at a multiyear low, which in turn is not doing anything positive for China.

The above chart breaks out the major product category for the Top 30 line items to give some flavor and catalysts for thought. The imports run the gamut from the high end to the low end, but there is no mistaking the ability of China to have a favorable impact on inflation over the years as a low-cost producer of so many different products. The tech and component systems for the manufacturing chain are well known and the ability of China to undermine the pharma and medicine chain in the US gets a lot of focus.

The above chart details the top US exports to China, and there are not a lot of bragging rights in the mix. The US is growing its crude and natural gas exports, and there is ample reason to believe those could find new homes in other markets if the Russia/Ukraine situation stays ugly and events in the Middle East go south. The strong base of US production and Canadian potential make for a very different backdrop than the 1970s.
Energy policies tie into who can call the shots in Congress and the White house on carbon and climate policies and infrastructure approval. As a rule, the smart solutions tend to be found in the creative middle ground, but the powers in Washington have outlawed creative solutions and banned the middle.
One industry that gets a lot of attention in the context of China is Aerospace since China is the leading buyer of new commercial aircraft by far in the world and will remain so for the foreseeable future. Boeing has clear dependence on a strong China book while China needs aircraft to support economic development. A breakdown in China-US relations could complicate that relationship to the detriment of China and more narrowly to Boeing and the aerospace supplier chain.
Obviously, there are a lot of moving parts in trade. Trade economics and law are massive disciplines unto themselves, but it is important to keep an eye on where those can play a role in global and regional cycles.
See also:
Midyear Trade Flows: That Other Deficit 8-9-23
State of Trade: The Big Picture Flows 12-18-22
Contributors:
Glenn Reynolds, CFA - glenn@macro4micro.com
Kevin Chun, CFA - kevin@macro4micro.com