
September CPI: Big 5 Buckets and Add-Ons
We look at the moving parts of a fairly balanced and constructive CPI report.


Headline CPI at 3.7% and Core at +4.1% was constructive, but the mix of inputs on CPI still presents a mixed picture for those looking for the needle to move lower more quickly.
Some key “ex-” metrics for CPI tell a more nuanced and better story including, “All Items Less Shelter” at 2.0% in a CPI report that overall did not break either way for bulls or bears and did not change the odds in a market that is favoring “no hikes” despite the last dot plot.
The Shelter index with all its much-discussed limitations saw total Shelter (34.7% of CPI index) at +7.2%, Owners’ Equivalent Rent (25.6% of the CPI index) at +7.1%, and Rent of Primary Residence at +7.4%.
The main challenge remains the sticky Services Sector with total Services at +5.2% YoY, Services ex-Energy at +5.7% but with Services less Rent of Shelter at +2.8%.
With a wide range of potential outcomes in the Middle East, the complexity of the FOMC decisions looking ahead just got more difficult in terms of the risk variables they see in the markets. The UST curve had edged down this past week after events in Israel, and there will be some handicapping around how that might flow into the subjective elements of FOMC decision making.
There is still no Speaker in a divided House and a divided GOP (Scalise vs. Jordan was very close). The Middle East is on a war footing that could escalate, and the presence of a US carrier strike force is serious business. Further, there is uncertainty around how the US would react to any excess of Hezbollah actions in the north as an Iranian proxy. The other side of any rational budget with Ukraine and Israel will mean more UST borrowing and not less. Any attempt to block Ukraine funding will make the House process uglier and a resolution more uncertain.
Anyone who has watched the Fed over the years knows they can tie global events back into their dual mandate with relative ease (“I can name that link to the Fed mandates in one note”). That was especially the case with Greenspan whether it was post-9/11 easing or reactions to global market turmoil in 1998 after Russia and EM meltdowns. That means the Israel-Hamas military actions and risks of what could unfold under some scenarios with Iran would promote caution by the Fed. They can rationalize anything with intellectual flair and simply frame the UST real rate rise in 2023 as doing the job on inflation and keeping financial conditions tight.
The direct Fed support for regional bank depositors was a different set of challenges this year outside monetary policy and inflation, but it will be interesting to watch how the regional bank interest margins and unrealized loss exposure in UST holdings could influence the UST curve as that all plays out with 3Q23 earnings season. The market will be closely watching the risks, and outsized market reactions to unrealized (or realized) UST losses would in theory add to the short-term downward pressure on the UST curve. We saw that in March until it later reversed.
The Big 5 CPI Buckets
Below we update our breakdown of the major CPI buckets across Food, Energy, Shelter, Automotive, and Medical CPI that comprises around 75% of the CPI Index. We then look at some other line items that disproportionately impact households in budgets and the general consumer psyche.
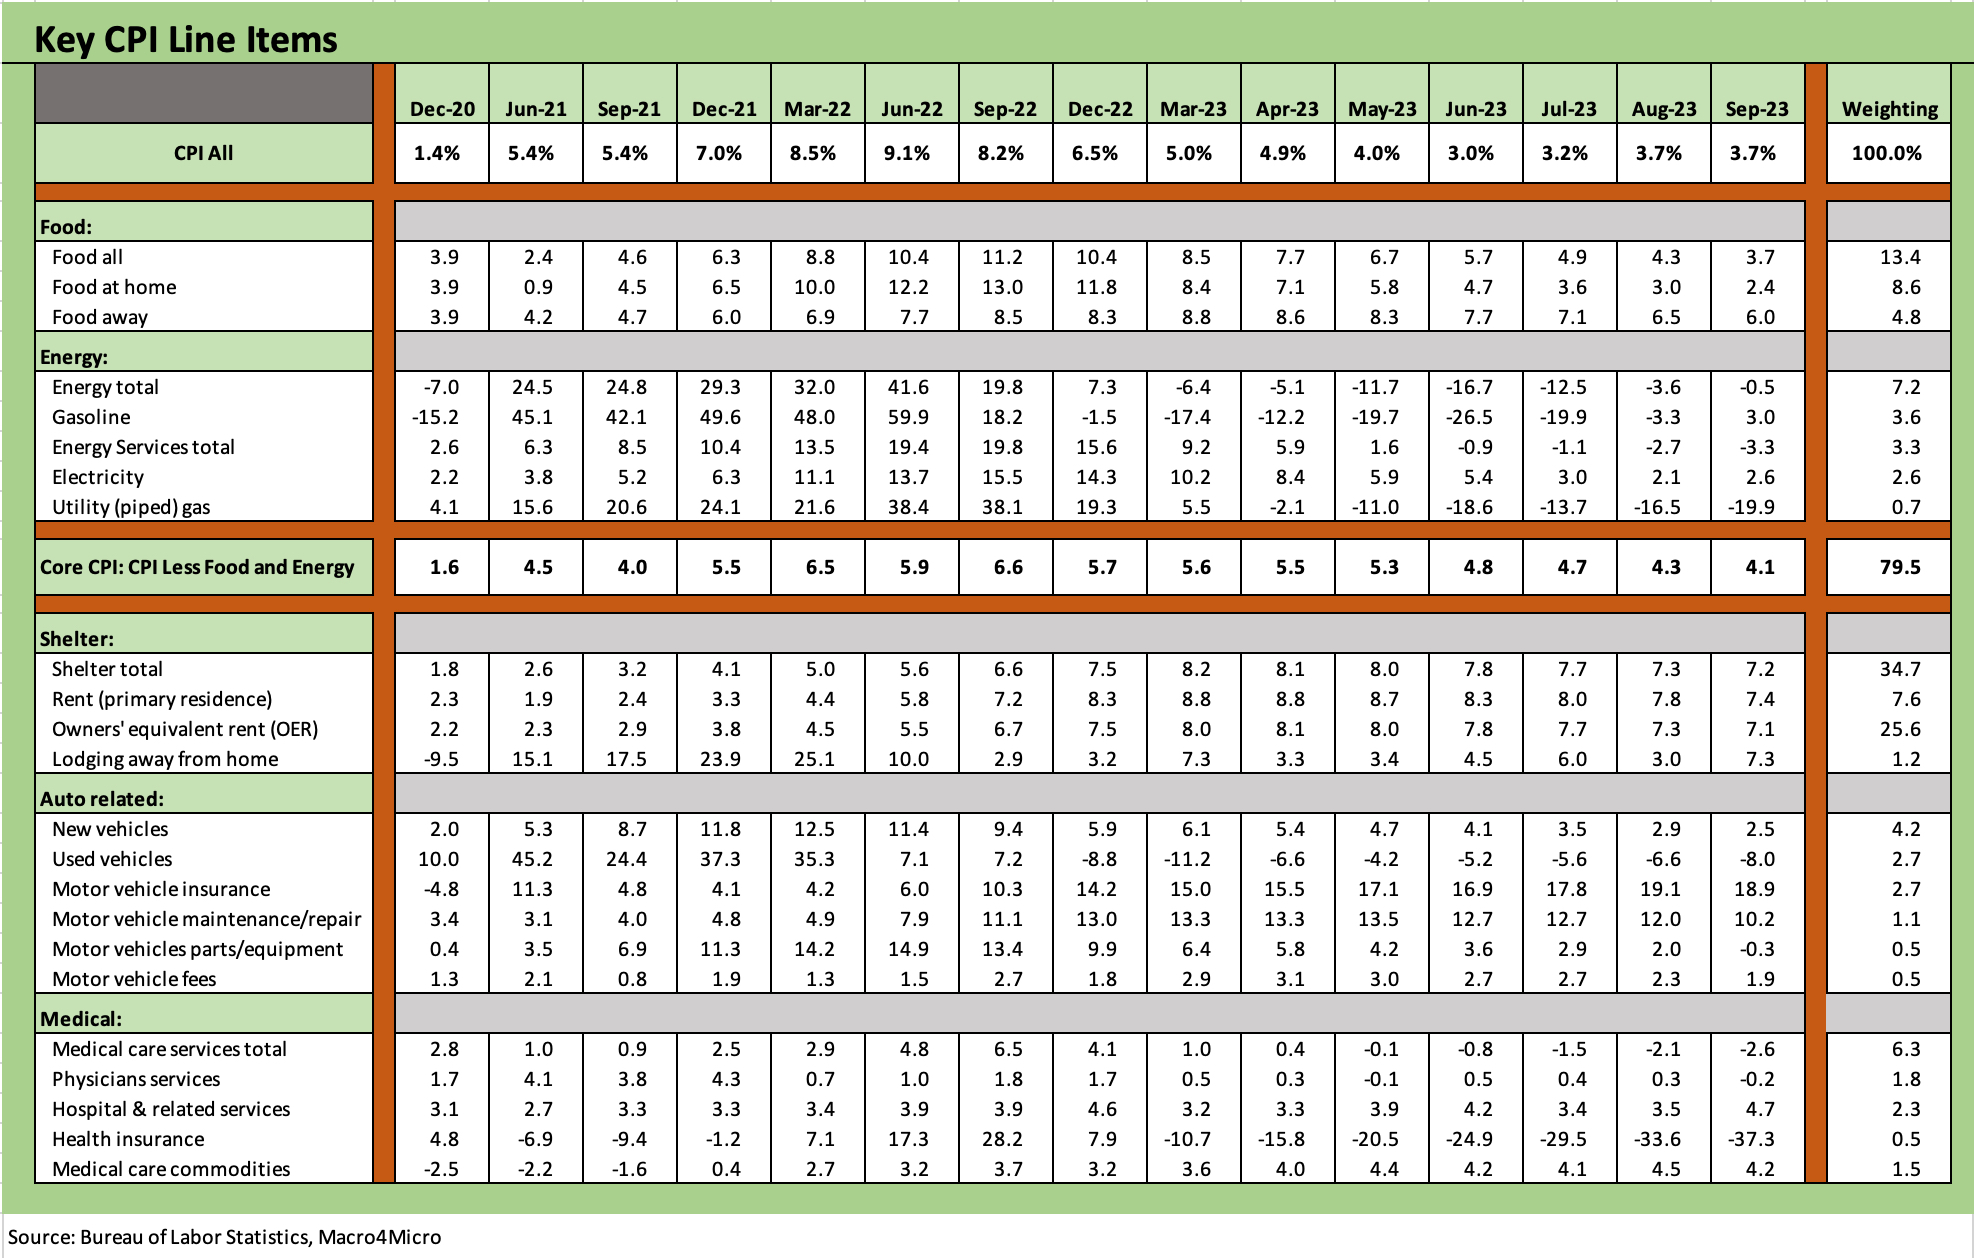
The Big 5 is something we started using a while back to capture the critical drivers of the headline CPI Index numbers. Below we recap the layers of the incremental YoY CPI moves by line item. The headline number has struggled to move lower with tougher YoY comps, but Core CPI at least ticked down.
Food: The repricing of food is like a regressive tax by the markets on those who live paycheck to paycheck. The result is strained household cash flow and budget allocations that at the very least impacts the “mix” decisions in the grocery store. That can be a psychological factor and notably in a toxic election year. The +3.7% for YoY for Food All was favorable vs the summer. Food at Home was +2.4% in a positive trend and eased MoM in September vs. the summer. Food Away from Home was +6.0% YoY. That was favorable for the YoY trend but ticked higher sequentially MoM as wage pressures likely influenced the latter giving the cost of doing business in a tight labor market.
Energy: Energy YoY saw deflation YoY but less than earlier months but was inflating again sequentially MoM in September in what remains a volatile market into October. Energy was -0.5% YoY but +0.6% MoM unadjusted. On a SAAR basis, Energy CPI was high in August and positive again at +1.5% in September. Crude oil is down in early October 2023 from the low $90 range last seen at the end of September before the sharp drop last week. The market peaked at $93 handle on WTI on Sept 27. The $84 handle area is vulnerable to material swings and will get wagged by OPEC+ decisions as well as what direction escalation heads.
The potential for tightened sanctions and a pullback on the much-debated, “not quite unlocked” Iranian funds has the oil markets in a potential state of flux. All bets are off if Iran sticks its head up too far on current developments directly or through its proxies in Lebanon.
Shelter: Anyone who has read our past work on the topic knows we place more than a few asterisks on the Shelter CPI index due to the dominant role of Owners’ Equivalent Rent (OER). The theoretical and very soft derived implied shelter inflation metric has very little to do with the sea level reality of a homeowner. That is especially the case for so many homeowners with a low coupon mortgage locked in and a house that is appreciating in value.
For Renters, the rental inflation number intrinsically lags on leases. The Rent of Primary Residence CPI at +7.4% bears little resemblance to what is seen from numerous real time data sources in the market. As we have looked at in past commentaries on CPI and our Housing work, the growing supply of rentals in the multifamily sector also promises to be favorable for rent inflation.
Automotive: The Automotive bucket we carved out covers more than new and used car prices and drops in such line items as Insurance, Repairs and Maintenance, Parts, and Fees. Owning a car is a big recurring cost for households even if you pay cash for the vehicle. We added in more line items as a reminder. For Sept 2023, new car CPI ticked slightly higher from near record prices in the industry while used cars deflated at -8.0% YoY and -2.5% MoM. The strike backdrop could tighten that used car supply and take used car prices higher depending on duration and how quickly the dealers run down inventory. The dealers entered the fall with healthy inventory balances, so the range of outcomes there can widen.
Auto Insurance has approached +20% with Maintenance and Repair in double digits. The other side of the UAW strike could mean higher prices for new cars, used cars near term, and parts as well. The inventory threat to parts from the strikes at the distribution centers increases the potential for supply-demand imbalances and higher prices to consumers. The EV transition process will add to the complexity of employment needs and could drive dealer services and maintenance prices higher with wage demands to attract qualified personnel. That has already been a factor given the higher diagnostic needs of car repair with new technologies in auto software (regardless of EVs).
Medical: The CPI lines in Medical Care have stayed in check by these metrics with medical care services in the negative zone and medical care commodities holding in the +4% handle area and a small sequential decline. The treatment of medical care costs is a layered, complex analysis that various measures treat differently and overlap with the topic of insurance and related premiums/deductibles. That is a bigger topic for another day. Health Care is typically an astounding 18% to 19% of GDP and gets swept up in the Congressional wars and state battles of Medicare and Medicaid. In the narrow world of CPI, the numbers are restrained. Just don’t ask a neighbor whether their family health care costs are lower and in deflation mode.
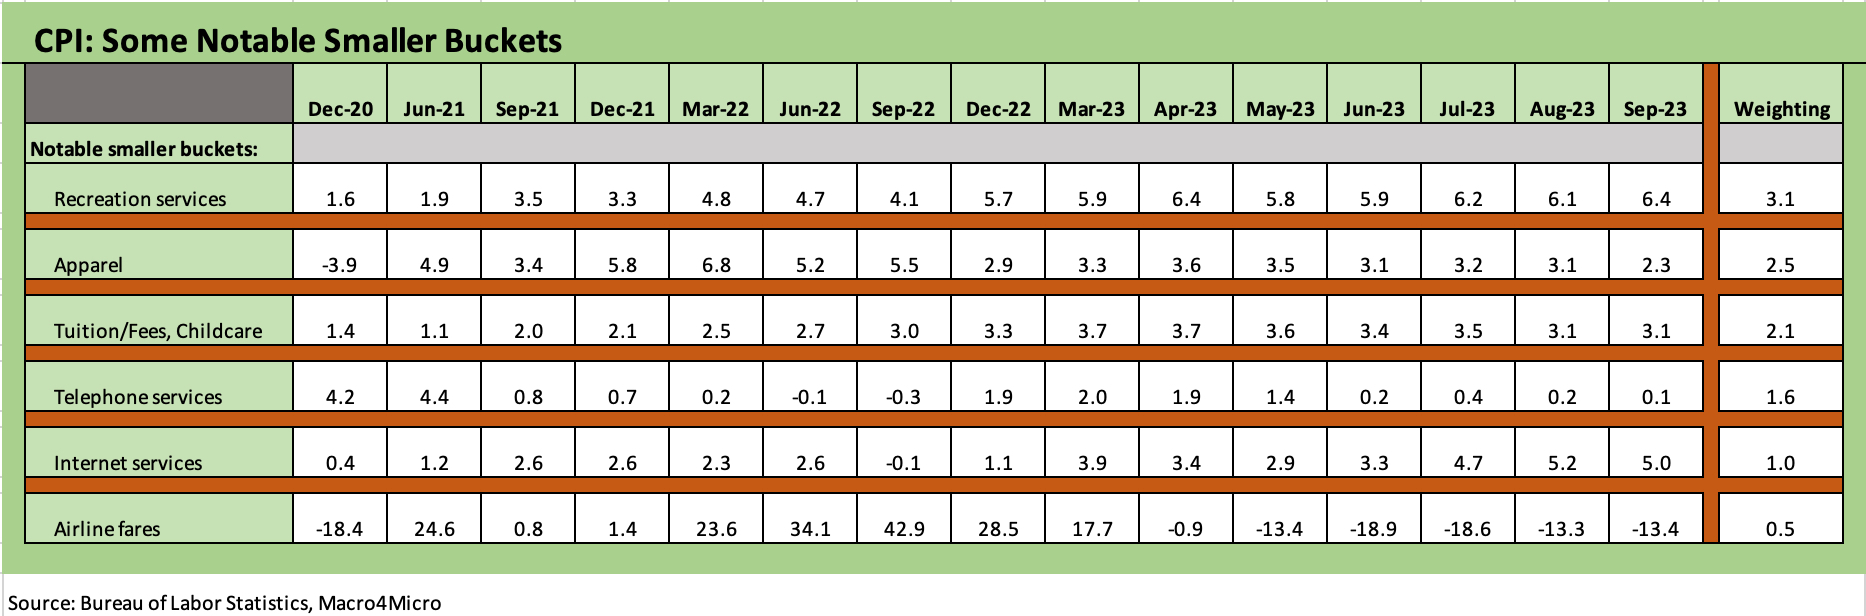
The above chart details some high-profile line items that add almost 11% more to the mix and brings the total CPI index share of the Big 5 and “Add-Ons” to around 86% of the index. We see 4 of the 6 lower (1 flat) with Recreation Services higher in the 6% bracket on strong leisure and recreation activities that has also flowed into hiring and booming travel.
The “back to school” retail season is already in the credit card bills or out of pocket at this point, and the steady price rise of all goods has set a new bar in household budgets that sting. That is true even with lower CPI run rates than seen in 2022. The pricing backdrop is the proverbial “new menu” for the consumer with each household having its own distinct baskets based on their needs.
The direction of fuel prices into the next stretch of risks will be high on the list of the Fed monitoring since goods need to be delivered (fuel surcharge risk, cost of goods, etc.) and it all adds up into the price expectations of the seller. Services also feel energy price moves since they need to heat their buildings during the winter, and that gets into the pricing chain for many. Sequential natural gas prices get swept up in weather near term as winter approaches. Higher energy cost would mean higher operating costs that need to be “eaten” or passed on. There is always a cost or price impact somewhere.
As we discussed in the Energy section of the Big 5 above, the response has been mild so far on oil. This has not been a fall 1990-style reaction to the Middle East. The actions of the US and Europe to any Iran link will be a headline to watch for obvious reasons beyond the price of oil. This is not late 1990 in terms of consumer vulnerability and cyclical risk, but a new energy spike would certainly flow in many directions for the US and Europe.
See also:
Footnotes & Flashbacks: State of Yields 10-7-23
PCE: It Takes Two to Ease 9-29-23