
Footnotes & Flashbacks: Asset Returns 10-22-23
Another bad week of returns in debt and equities with the UST curve at the helm on both.


We look at the mix of asset returns in a week where the UST curve steepened sharply even in the face of geopolitical risk as bullish numbers (e.g., Retail Sales) and constructive metrics (e.g., Industrial Production) keep the heat on.
The flight to quality effect from geopolitics has not weighed in much yet to counter the UST steepening while US politics and budget insanity have limited the discussion of a potential UST supply deluge that overlaps with the geopolitical wildcard and a likely defense funding spike.
If equities remain linked to UST, then there are a few big uncertainties ahead that run from Washington (the House) to Gaza.
The recent Financial Stability Report from the Fed highlighted geopolitics as a threat on numerous fronts to financial stability, but the impact has a wider band of outcomes that are hard to price with earnings season guidance and the UST curve still the main events for now.
The trends for the debt and equity benchmarks continue to struggle as we move further into the fall, and the UST curve, geopolitics, and domestic politics continue to widen the range of potential outcomes. The past week kept the bad numbers streak going with major equity indexes down and debt feeling the adverse moves of the UST curve in another week like the last one – only worse (see Footnotes & Flashbacks: Asset Returns 10-15-23).
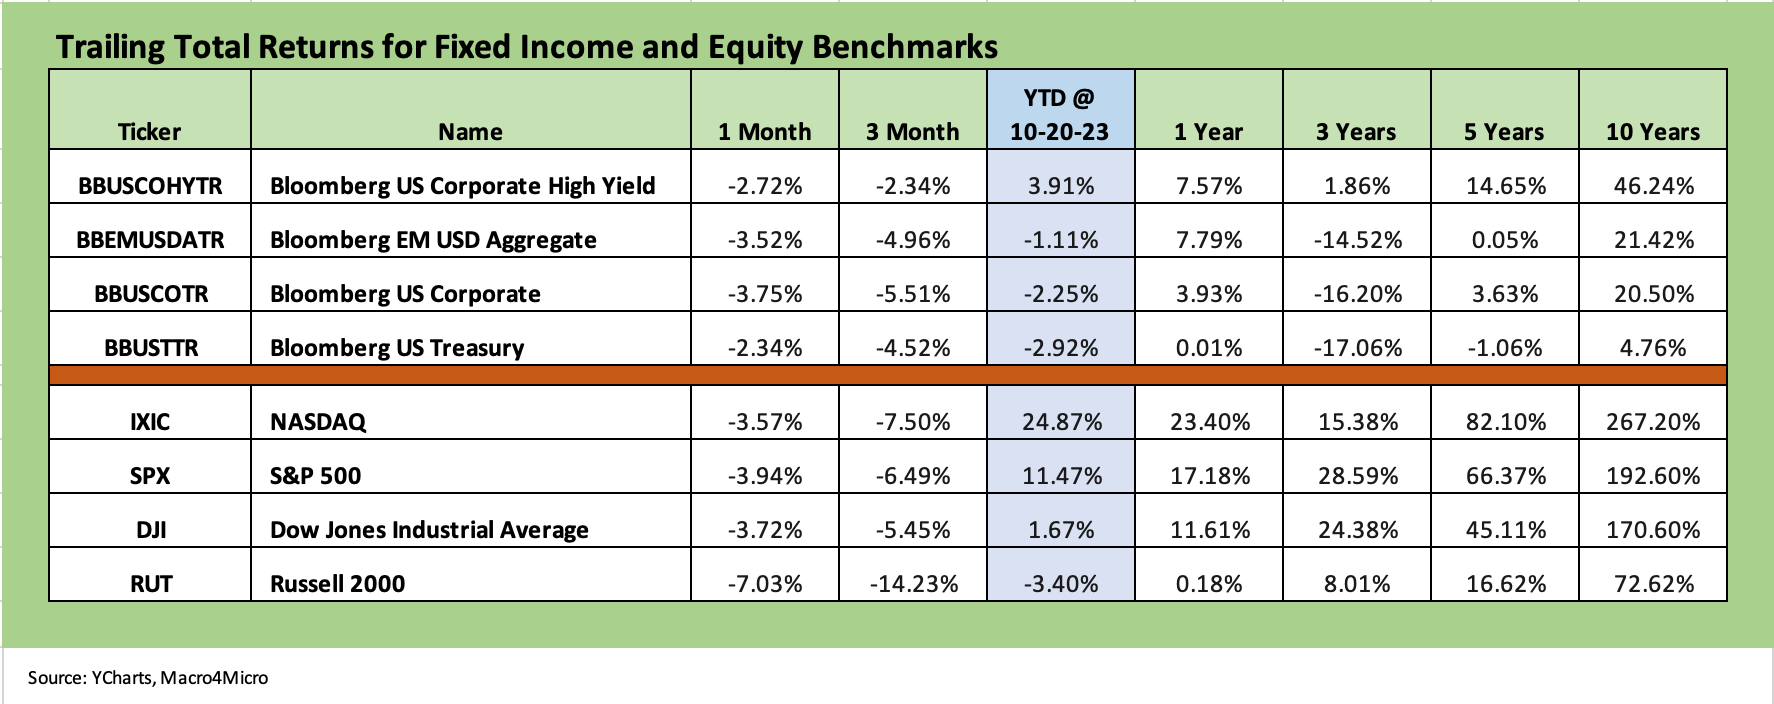
In the debt markets, we now see 3 of the 4 benchmarks that we track in the negative zone YTD with EM dipping below zero. The market saw more return points shaved off US HY on wider spreads and adverse UST moves. We look at the yield trends and UST curve steepener effects in a separate Footnotes publication (see Footnotes & Flashbacks: State of Yields 10-21-23). Excess return factors and total return are both now heading in the wrong direction, but with US HY feeling less impact from the curve in total returns on shorter duration.
The trailing 1-month and 3-month returns for both debt and equities are negative across the board for the above benchmarks and indexes in both debt and equities. The YTD equity returns still reflect the poor breadth in the markets as we highlight in the ETF sector comments on market weighted vs. equal weighted ETFs. Tech equities and the Magnificent 7 still distort the broad market benchmarks.
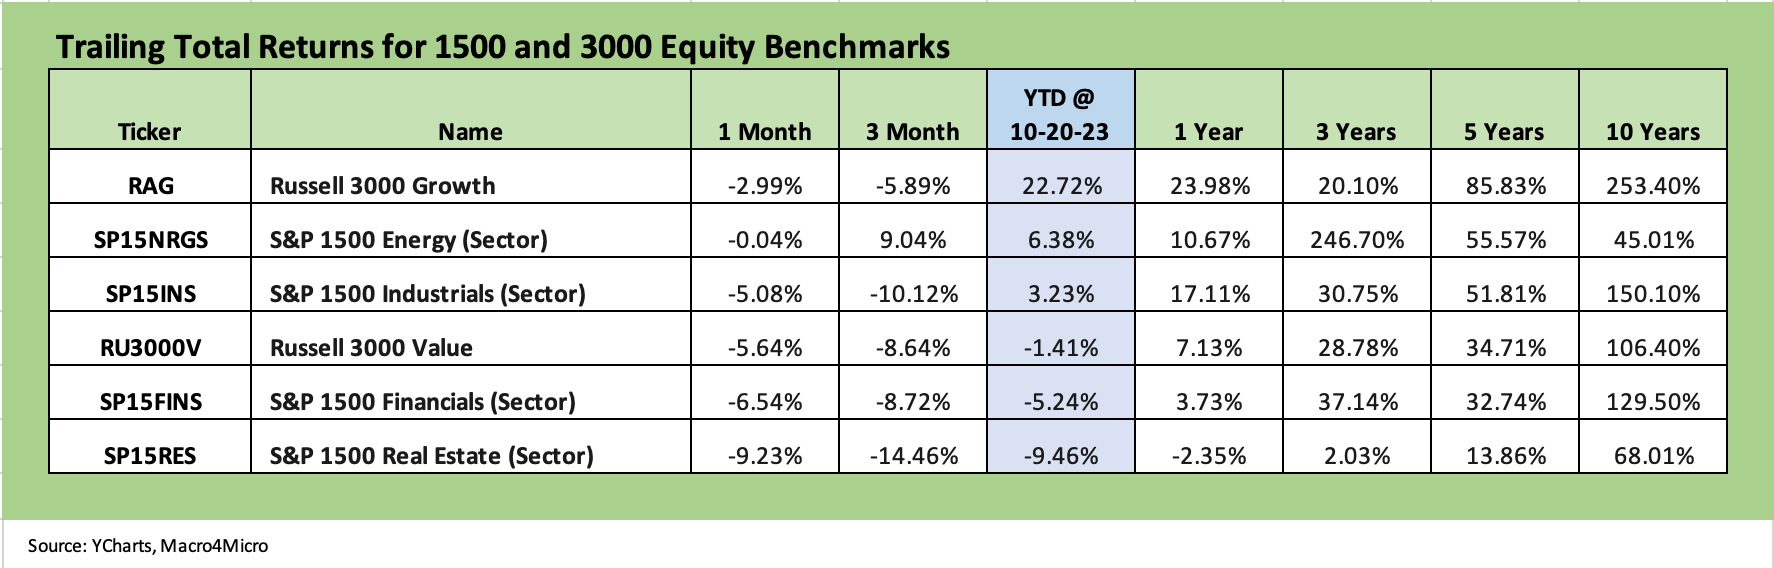
The above chart updates the 1500 and 3000 series. We line them up in descending order of returns YTD. The results hammer home the ugly recent run across most markets except Energy. The 1-month period was a shutout for positive returns for those we track. The 3-month timeline reflects strength in Energy, but Real Estate continues to fall further behind. Since interest rates shorten the real estate cycle, the current trends have moved beyond shortening of the cycle in a downright contraction for asset valuation in the space.
The legacy asset setbacks in real estate come despite the strong base of economic activity wrapped around the current project economics in nonresidential construction (see Construction: Project Economics Drive Nonresidential 10-2-23). The problems are in established funded assets with operating struggles in many (not all) commercial real estate categories (see Construction Spending: Demystifying Nonresidential Mix 5-9-23).
ETF and Benchmark Returns
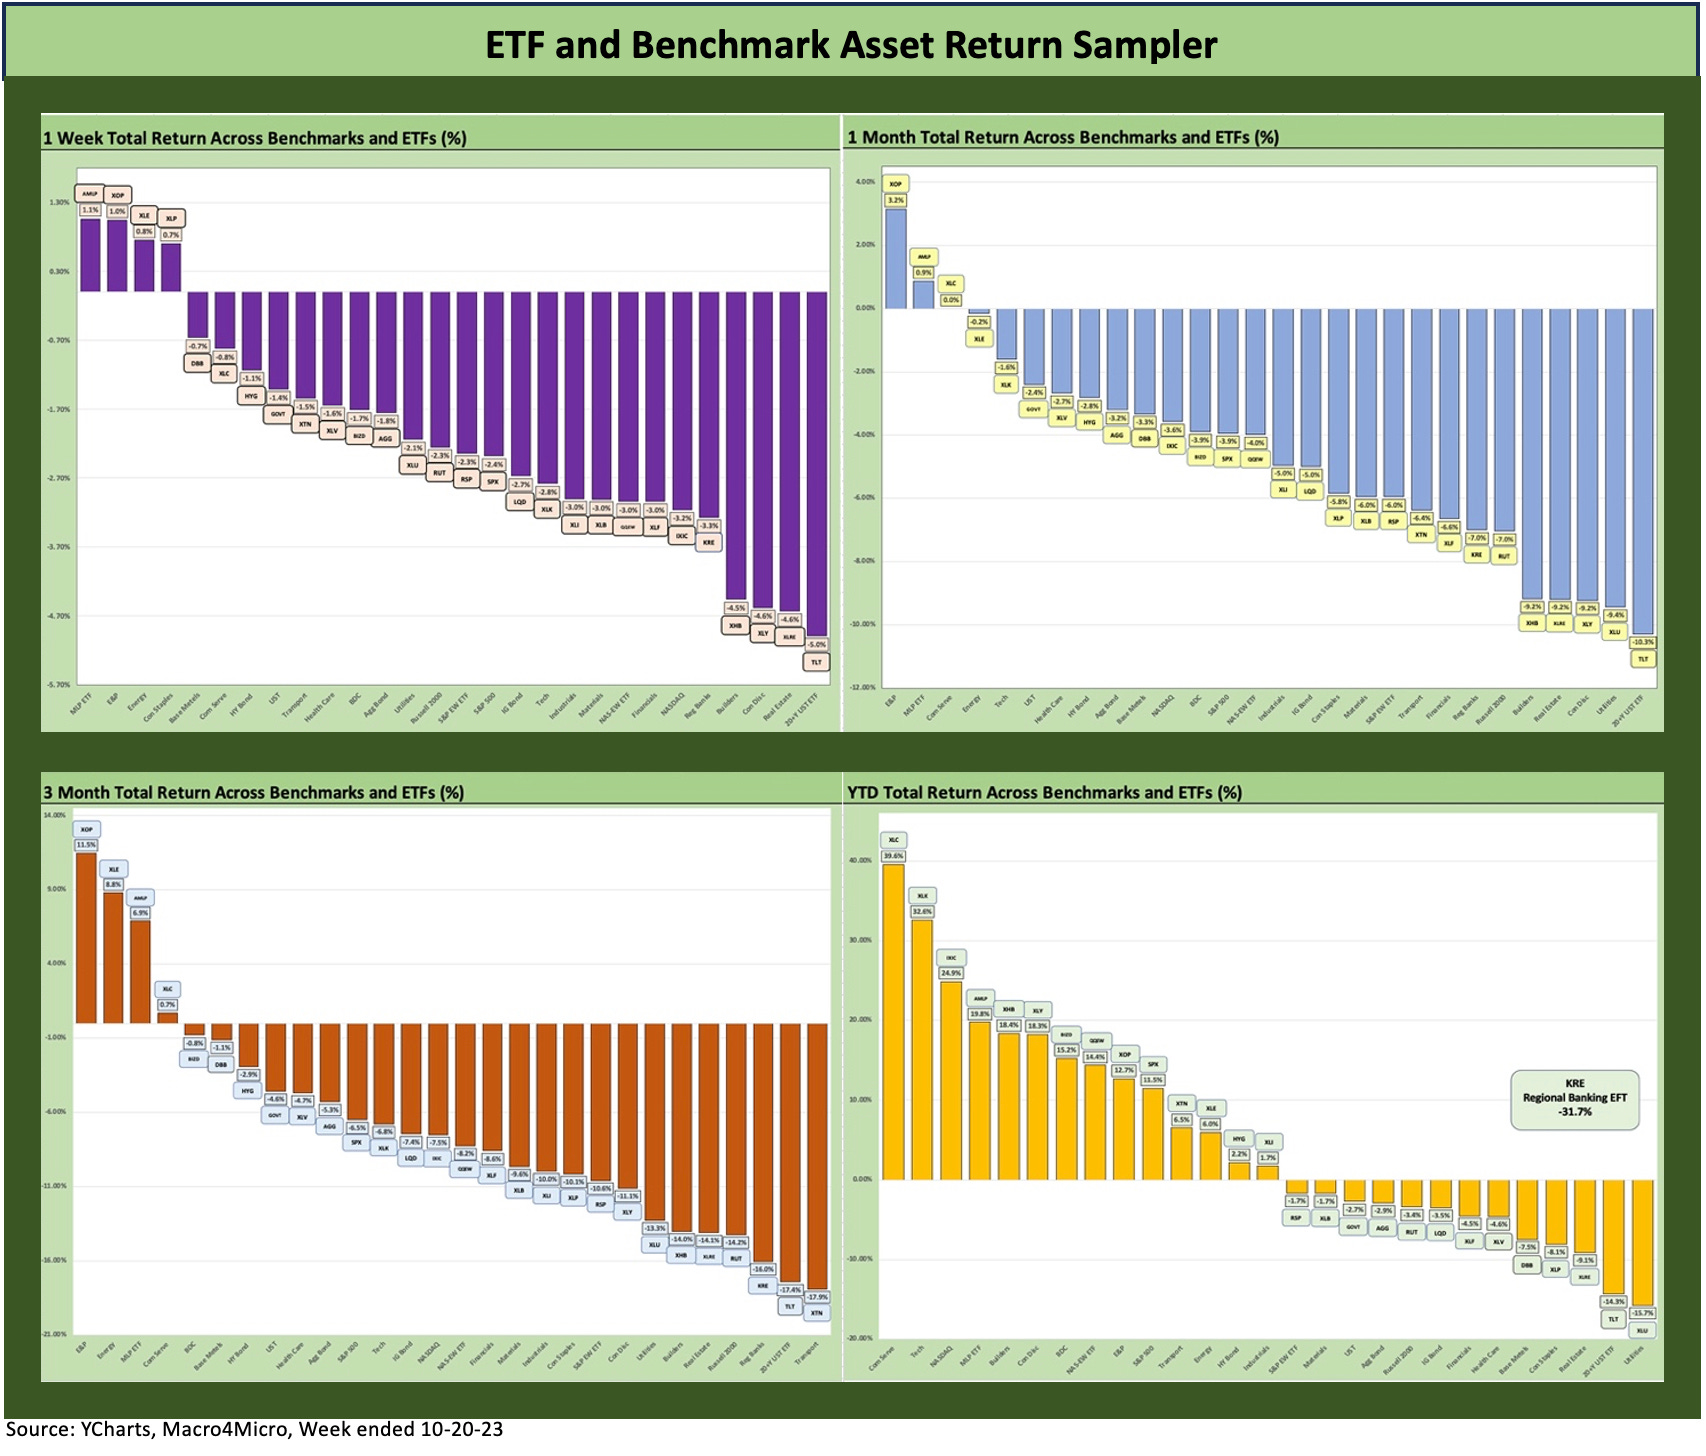
In the next section, we update our usual asset class subsector returns through a mix of ETFs and benchmarks. We added the chart below for a quick visual on the relative symmetry of returns before we get into the weeds in the section further below.
The visual makes a clear statement that the 1-week, 1-month, and 3-month time horizons are fairly grim as asset classes have struggled across equities and debt and across industry valuations. On YTD basis, the balance of positive and negative is even.
Time Horizon Returns
In our next four asset return charts, we cover 1-week, 1-month, 3-month, and YTD time horizons for a range of ETF and benchmark returns. We look at 28 different benchmarks and ETFs that cut across a wide expanse of the economy.
We recently added the YTD version as we are now in the 4Q23 period. The usual question of “What kind of year was 2023?” is starting to look for a general description. The next 6 weeks or so will determine that. The year is shaping up as a bad one for fixed income and decidedly mixed for equities in terms of large cap breadth and for small caps.
As detailed further below, at least there are a lot of subsectors and industry ETFs well in the black YTD. We have seen materially worse years than this even during cyclical expansions. For a year where cash came in at #1 in returns vs. debt and equities, the year 2018 immediately leaps to mind. That was also a year with minimal returns on cash unlike 2023.
It is no coincidence that 2018 was the end of a mini-tightening attempt (more like a stab at normalization) ahead of some 2019 easing on economic weakness that year. The year ended on a terrible note in 2018 and brutal December in HY. That occurred in what was still an expansion year for the cycle. Then COVID came shortly after. A 2018-style limp to the finish line is still a risk in 2023.
We recently added equal-weighed ETFs for the S&P 500 (RSP) and NASDAQ 100 (QQEW) given the market cap weighted distortions in the total returns for those benchmarks that had been driven for much of the year by the mega-names. The YTD return profile for market cap weighted ETFs vs. Equal Weighted ETFs offer a clear reminder of what an unusually imbalanced year 2023 was to this point. The SPX returned +11.5% YTD as of this past week while the S&P 500 equal-weighted ETF (RSP) weighed in at -1.7%.
We also recently added two more ETFs to the mix with the addition of the iShares 20+ Year Treasury Bond ETF (Ticker TLT). We see TLT as a good proxy to add to the collection for a more concentrated look at how duration is performing each week. We have LQD, GOVT, and AGG already in the high-quality fixed income mix, but TLT adds some extra price volatility tied to the steepening vs. flattening scenarios. The greater sensitivity to moves in the UST curve than what we see in the GOVT ETF will heighten the effects for a useful visual. TLT has been slaughtered looking back across the tightening cycle at -38.0% since March 1, 2022, the month ZIRP ended. TLT posted up a -5.0% number this past week.
We also added a base metals ETF recently with Invesco DB Base Metals Fund ETF (Ticker DBB) for some additional flavor on how base metals have been trending. Base Metals (heavy in Copper, Aluminum, and Zinc) can be a useful indicator on any combination of sentiment in global manufacturing cycles or where China economic activity is headed. We thought that would add something to the portfolio color we lacked in the prior mix even though we had a range of industrials. DBB has been a very poor performer with China weakness and plenty of global cyclical question marks.
When looking across some of the bellwether industry/subsector ETFs, it is good to keep in mind which narrow ETFs (vs. broad market benchmarks) get wagged more by the “Magnificent 7” including Consumer Discretionary (XLY) with Amazon and Tesla, Tech (XLK) with Microsoft, Apple, and NVIDIA, and Communications Services (XLC) with Alphabet and Meta.
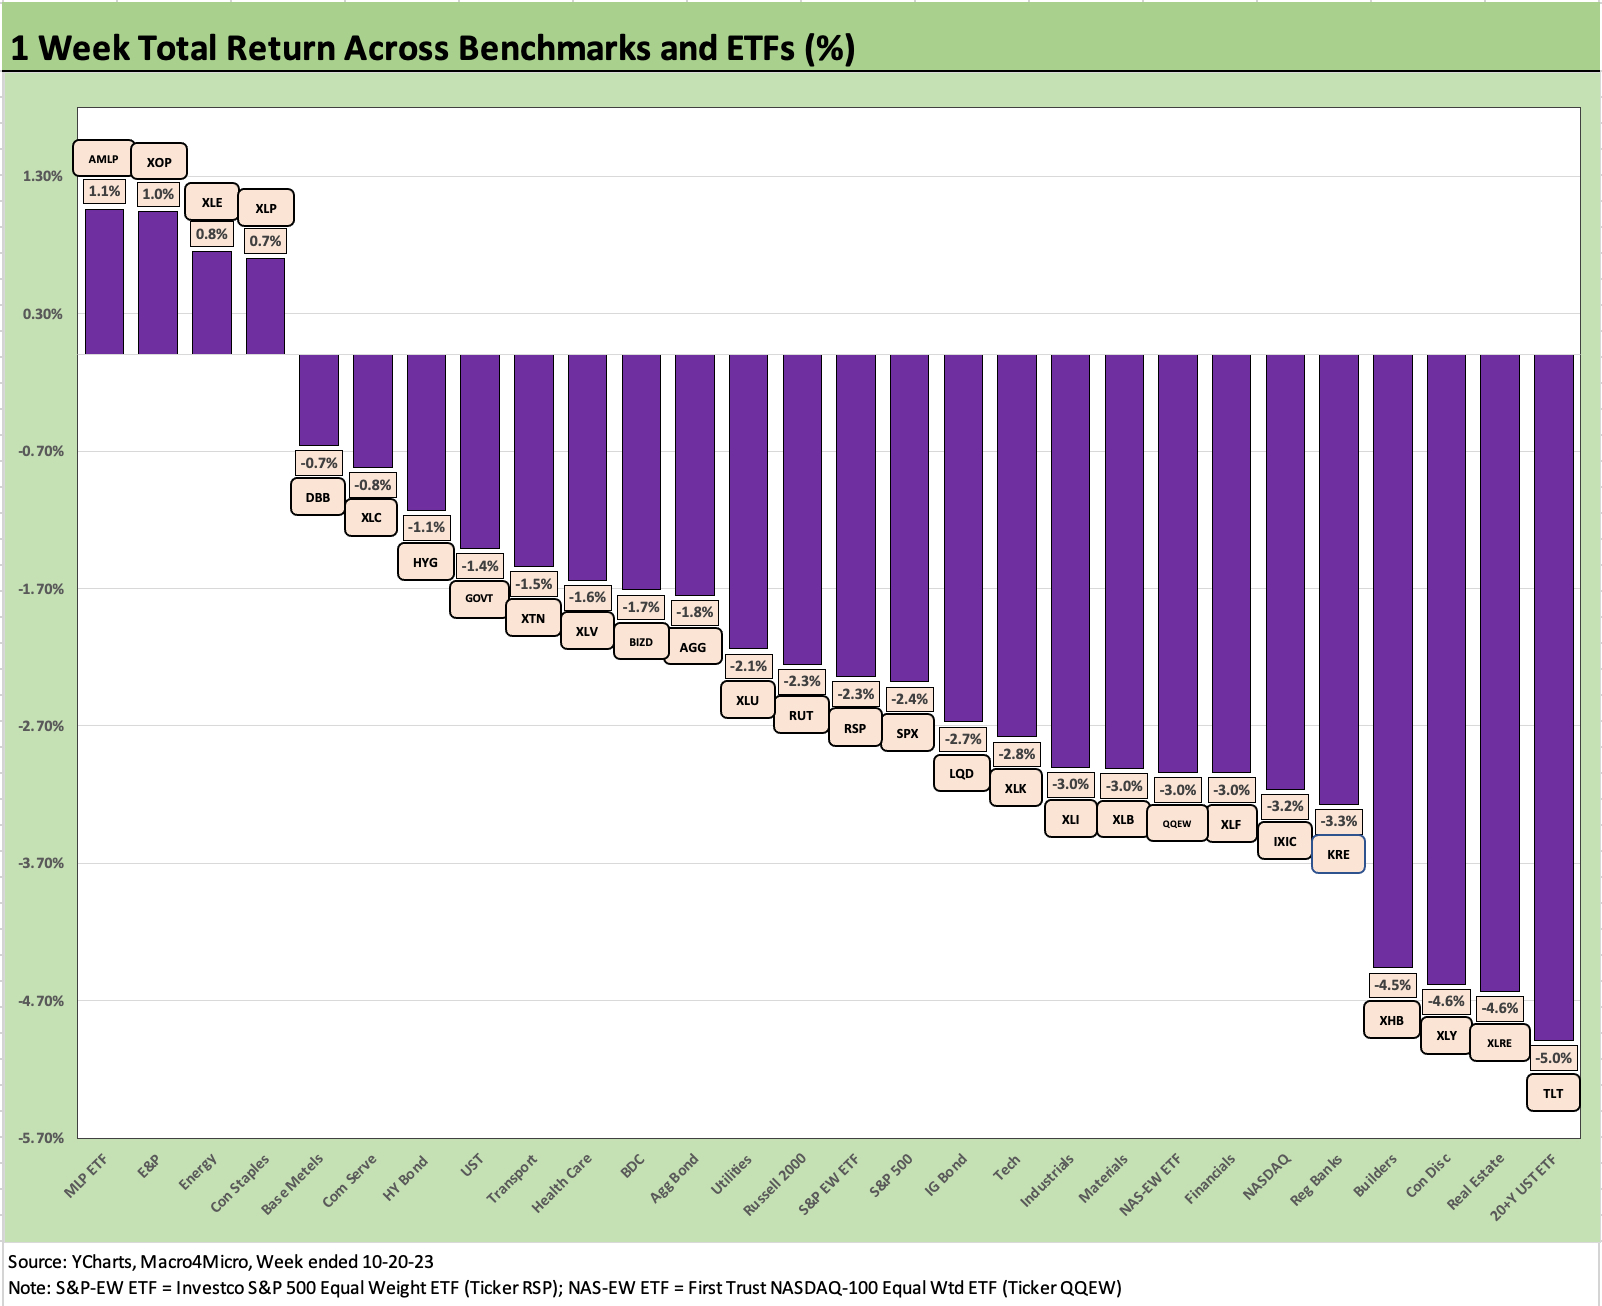
The past week has been a rough ride obviously with only 4 of the 28 in the positive return range and 3 of those 4 in the energy sectors. We see Midstream Energy (AMLP) at #1, E&P (XOP) at #2, and Energy (XLE) at #3 with Staples (XLP) managing a positive week for an industry ETF that is in the bottom ranks YTD.
None of the Magnificent 7 heavy ETFs cited above posted positive returns for the week. We see the equal weighted S&P 500 ETF (RSP) right next to the market cap weighted benchmark. Meanwhile, the NASDAQ and Equal Weighted NASDAQ ETF (QQEW) are only separated by Financials (XLF) for the week.
In the fixed income ETF mix, we see 20+ year UST ETF (TLT) sitting on the bottom at -5.0% in a pure measure of long duration asset class pain. The longer duration IG Corporate ETF (LQD) is in the third quartile with UST ETF (GOVT) in the upper end of the second quartile just behind the HY ETF (HYG), which edged into the bottom of the first quartile, while the AG Bond ETF (AGG) is near the lower end of the second quartile. It is notable that the first quartile included 3 of 7 with negative returns.
We are seeing some YTD strong performers taking more heat with Builders (XHB) in the bottom 5 for the week at -4.5%. The 8% mortgage headlines and slow move into the offseason for builders has housing-related investors on edge after a good run YTD even if these companies are well positioned financially and they have the ability to adjust working capital to meet demand. The starts numbers for the past week were reasonable (see Housing: Starts, Completions Firm Sequentially, Permits Down 10-18-23).
Consumer Discretionary (XLY) is a top quartile YTD performer but had a rough week in a rough month. TSLA had a very bad week while Amazon had a negative week and month. TSLA is the #2 holding in XLY and was hammered this week on earnings, margin expectations, the potential struggles of its vaunted Cybertruck, and EV anxiety and demand and EV price pressure worries generally.
The EV nerves are hitting all autos with TSLA the most cost efficient and thus easily able to make life tough for the others via price. EV strategies and capex levels seem to be getting second-guessed in the auto trade rags and industry commentary on the Detroit 3. Price competition will still come out of TSLA margins even when they win vs. the onslaught of volumes and launches ahead in 2024. In the meantime, the Detroit 3 are watching their anticipated costs rise materially for EV unit costs with the UAW concessions.

The above chart highlights a bad 1-month performance with few themes to lean on other than the fact that the UST curve has been driving the bus. We see only 3 in the positive return range of the 28. E&P (XOP) and Midstream Energy (AMLP) turned in positive numbers with Communications Services (XLC) just across the line into the positive side of zero.
The 20+ Year UST ETF (TLT) is dead last at a nasty -10.3% with other interest rate sensitive sector ETFs such as Utilities (XLU), Real Estate (XLRE), and Homebuilders/Suppliers (XHB) also in the bottom 5. The setbacks at Tesla and Amazon drove the poor performance of Consumer Discretionary (XLY) in the bottom 5.

The 3-month returns are like the 1-month and 1-week in relative mix with only 4 in the positive zone. The Energy sector leads the way again at 3 of the 4 in the black with E&P (XOP) at +11.5%, Energy (XLE) at +8.8%, and Midstream (AMLP) at +6.9%. Communications Services (XLC) just edges into the positive range below the 1.0% return line. XLC was able to ride strong numbers from its #1 holding, Google (Alphabet).
Over on the right with the bottom dwellers we see Transports (XTN), long UST duration (TLT), Regional Banks (KRE), small caps (RUT) and Real Estate (XLRE) with double digit negative returns. Small caps continue to send cyclical warning signs for the more US-centric small caps while the unfavorable UST curve moves hit Builders (XHB) and Utilities (XLU) for the rolling 3 months.
We see 11 of the 28 subsectors, ETFs, and benchmarks with negative double-digit returns. That is a very rough stretch of performance.
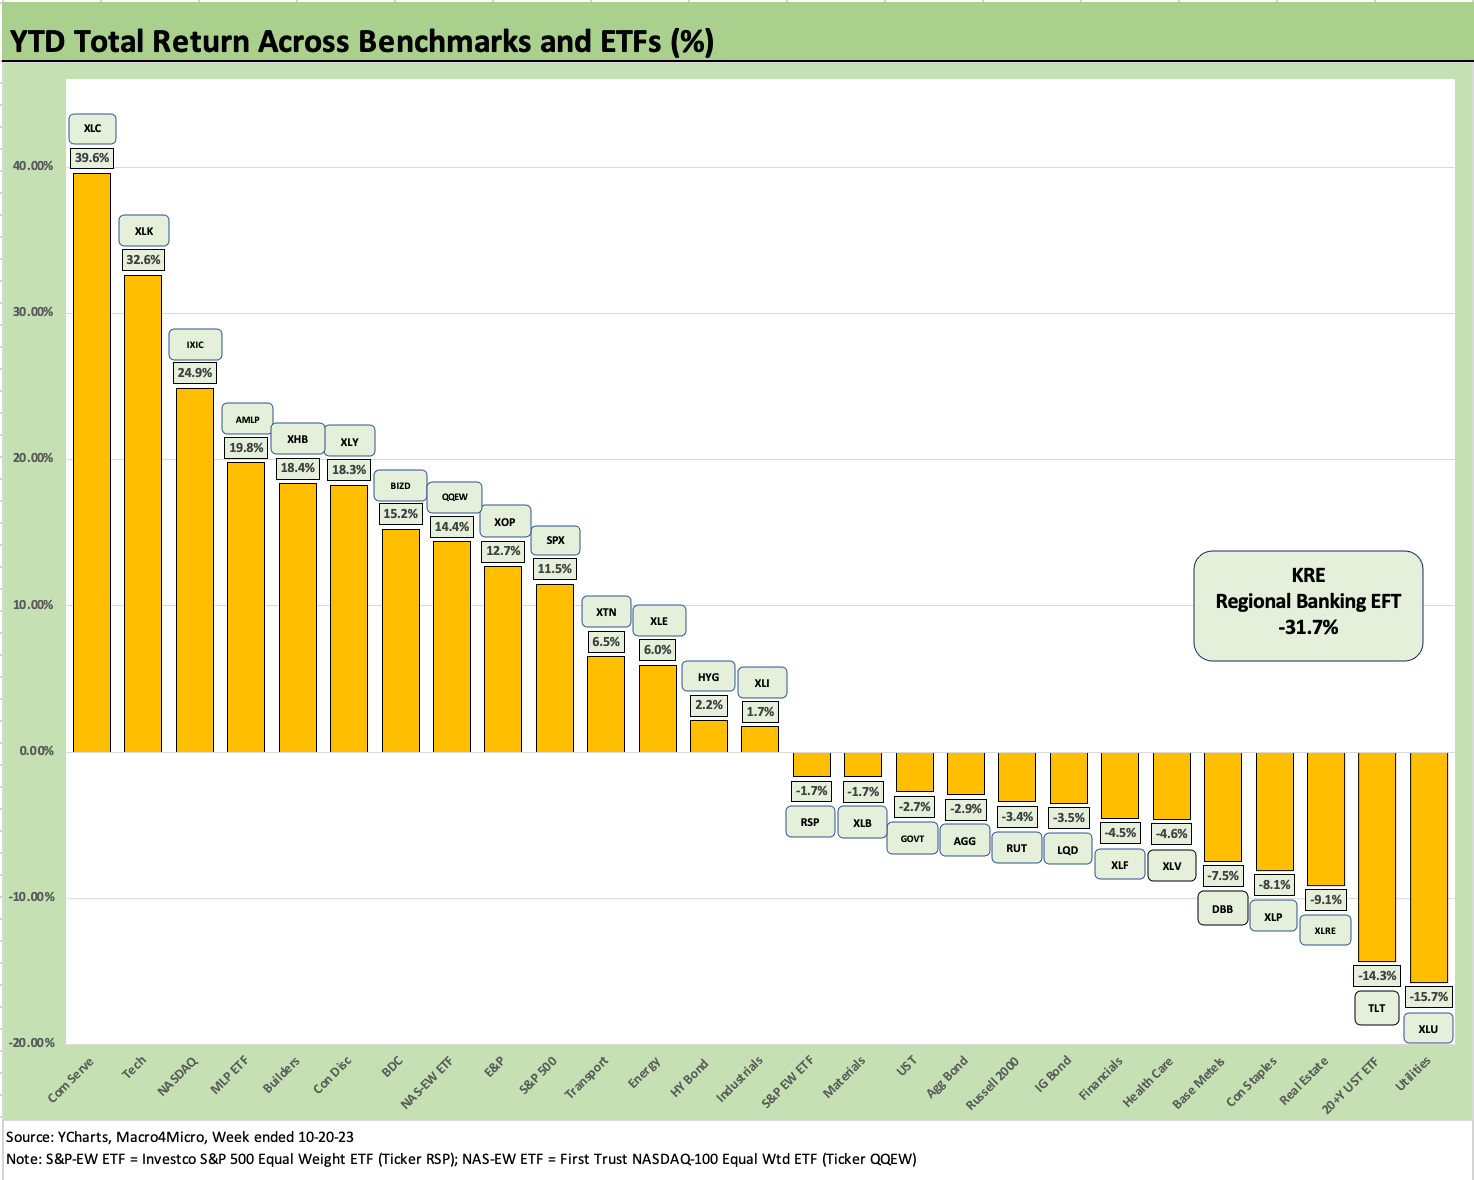
The YTD split of positive vs. negative returns is tied at 14-14 with a Hi-Lo range of over 71 points with Communications Services (XLC) at #1 and Regional Banks (KRE) at a distant last place at -31.7% in its own box. The #1 and last place ETFs are two large cap sectors in aggregate, so that is quite a gap. If we throw out the Hi and Lo ETFs as outliers, the gap is still over 48 points with Tech (XLK) vs. Utilities (XLU). Regional Banks (KRE) will be remembered as the outlier sector at over 27 points below Financials (XLF) even with some overlap in regional holdings.
Among notable top quartile that either tech-centric or Magnificent 7 heavy, we see Midstream Energy (AMLP), Builders (XHB), and BDCs (BIZD). Energy (XLE) and E&P (XOP) have come on strong later in the year but are second-quartile YTD performers so far. Middle East developments could change that in the home stretch and push them materially higher if some parties misbehave and escalate. AMLP and the underlying has the advantage of lower volatility in revenue and cash flows and very high dividend yields.
The BDC Buzz…
The BDC ETF (BIZD) in the top quartile is notable with its +15.2% YTD return. As some who have read our work since we started last October might know, we have been fans of the BDC vehicle for numerous reasons tied to the asset mix and actions taken in liability management prior to the tightening cycle and upward UST migration.
As I noted along the way, a recurring disclosure item is that I own a number of BDC equities in my retirement portfolio (I am 65, so that is sort of now). The combination of very high dividend yields vs. the market, the floating rate asset feature and secured-debt-heavy mix, and the fact that so many locked in low coupon unsecured debt all factor into my portfolio weighting (no single name over 2% of portfolio).
As a career “credit guy,” the portfolio BDC stakes were my way to take higher risk credit exposure while playing the yield curve and monetary cycle. HY bonds would be on the receiving end of the UST migration and dividend payouts were low on HY ETFs. The liquidity of the BDC stocks are also a plus.
The BDC managers are among the best in the business and have the brand names to go with it. It is nice to have them on your side (I resist saying “for once.” OK I said it.). The BDC investors (stocks and bonds) are sharing the managers’ interests in using BDCs as a highly visible window into their private credit capabilities to reel in more AUM. You can get pushback on that shared interest theory, but that is my view despite 4+ decades in the credit business that encourage the Conan the Barbarian Trust Rule.
A BDC investor can also use the selection process to bias their BDC exposure to broader categories that investors may favor (Healthcare, Tech, Services, etc.). The presentations and 10-Ks can get pretty hefty, and disclosure is rigorous. We plan to get more published on BDCs since we see that asset class generally as a major expansion area in the market, and that always brings some divergence of results across credit cycle downturns after a lot of growth. Then the market can figure out who was chasing vs. who was selecting.