


The Oil Anschluss demands 65 billion barrels you say?!
The Warsh speech carried the week, but inflation stayed stubborn as the UST curve rolled into a bear flattener with FOMC tightening odds quickly moving higher over the course of a week for a Sept hike and for 2 hikes by the Dec 2026 FOMC meeting (see Market Commentary: The Curve 8-30-26).
For the week, the PCE inflation numbers were unfriendly and remain well above target. That pressure continues to hold back bond returns and undermine confidence in interest rate sensitive assets. Housing also posted more weak numbers (see PCE July 2026: Mixed Consumption, Stubborn Inflation 8-26-26, 2Q26 GDP: 2nd Estimate 8-26-26, New Home Sales July 2026 8-25-26).
The week saw low returns across benchmarks and subsector ETFs in a compressed Hi-Lo range. Muted numbers were posted by the tech highfliers even with NVIDIA posting spectacular earnings. The software sector sustained its slow and steady recovery while the AI ecosystem saw a “pause” for the week in a fast-forward year.
We get payrolls this week after a barrage of data last week that includes PCE inflation (income and outlays) and 2Q26 GDP updates that also showed materially unfavorable inflation trends in 2Q26. That came along with a soft headline number of 1.5% that includes supportive PCE growth and fixed investment numbers in the moving parts that were more reassuring than the headline growth number would suggest.
The Venezuela deal was a headline grabbing anomaly as the theme of annexations and trade extortion has colored US economic policy and geopolitics. In the Venezuela case, private ownership structures scream corruption risk and future political turmoil. Based on what we have seen, even the Pentagon is getting their “piece of the action” as the private and public sector lines get very blurry.
The value maximization equation for US interests in Venezuelan oil could easily clash with the concept of free and fair elections in Venezuela. The US is essentially seizing oil assets by cutting a deal without an election. It will be written up in the future for what it is – military-based expropriation with cash and prizes for the Pentagon and corporate allies of the White House.
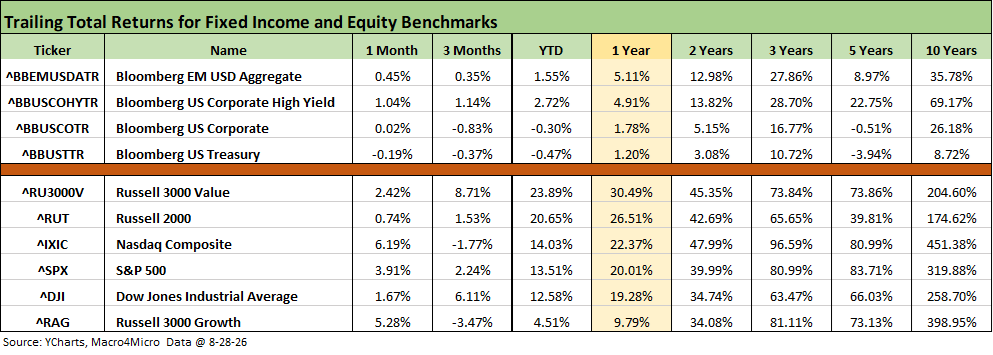
The above table details the time horizon returns for the debt and equity benchmarks we monitor. It continues the pattern of solid equity performance and soft fixed income numbers we have been seeing with the Russell 2000 stalling the past month. Tech remains a story with major swings week to week.
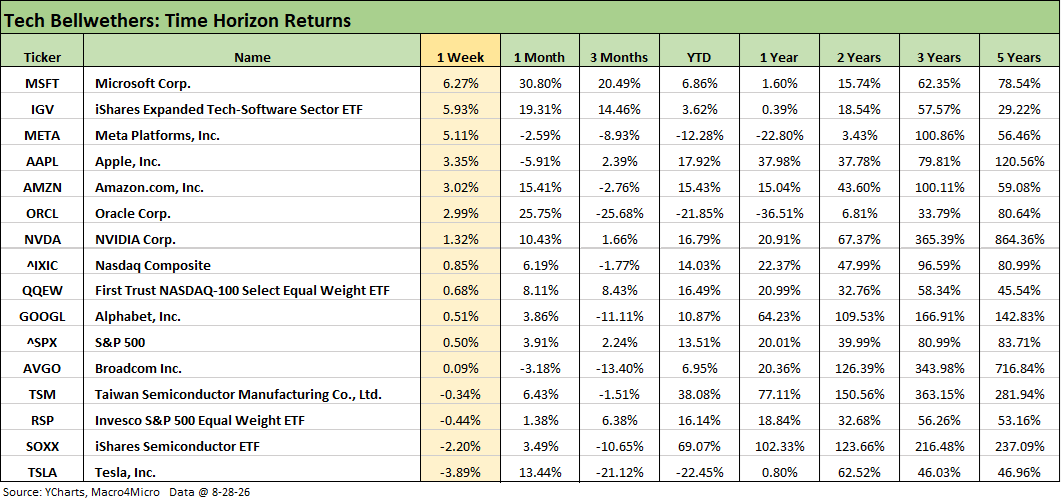
The tech bellwethers had a solid week led by software and SaaS names with only a few major names in the red with Tesla (TSLA) still volatile and negative YTD. The Semiconductor ETF (SOXX) was one of 3 tech-heavy lines in the red with TSLA and Taiwan Semi (TSM). We see 6 of the Mag 7 in positive range. The Software ETF (IGV) was ranked #2 in this group at +5.93% with SOXX near the bottom.
We get Dell (DELL) and Broadcom (AVGO) earnings this week for another pulse check on Semi and AI ecosystem names. After the 1% handle return on NVIDIA (NVDA) this week and in the face of an amazing quarterly earnings report, the AVGO reaction will be illuminating about market sentiment. SOXX is now -10.65% over 3 months vs. +69.1% YTD.
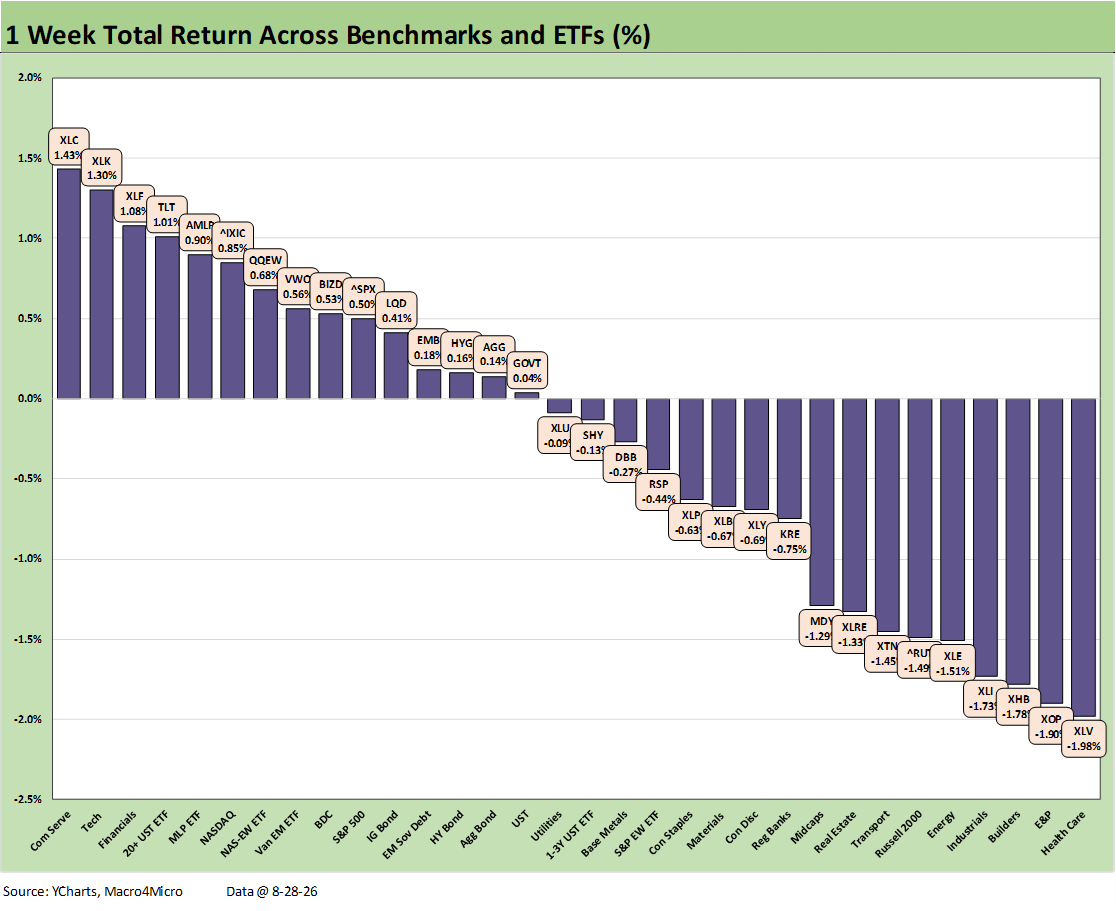
The chart updates the weekly total returns for the 32 benchmarks and ETFs we monitor, and we see a balanced score of positive vs. negative at 15-17. The absolute total returns on the leaderboard are extremely low in the context of recent weeks and months.
We see a +1.43% return earning the #1 ranking with Communications Services (XLC) and the weekly return dropping below 1.0% in the top quartile at #5 (Midstream ETF AMLP). The Hi-Lo range for the 32 asset lines was only 3.41%.
The same sub-2% profile holds true on the bottom with last place Health Care ETF (XLV) at only -1.98% with E&P in 2nd to last at -1.90%. Considering the headline intensity, the returns were muted. We had Warsh at Jackson Hole, NVIDIA earnings, the PCE inflation release, updated 2Q26 GDP and related PCE inflation for the quarter, and oil dropping from an $87 handle to $83 handle. One might have expected more action.
With the exception of the long duration UST 20+ ETF (TLT) in the top quartile at the #4 ranking with +1.01%, the remaining 6 bond ETF returns were clustered near the 0% return line. The IG Corporate ETF (LQD) was in the 2nd quartile and was the #2 performer among bond ETFs at only +0.41%. We see GOVT at #5 among bond ETFs with +0.04% with the lowest returns of the 7 bond ETFs posted by the short UST 1-3Y ETF (SHY) at -0.13%.
The short end of the UST curve saw the worst UST deltas coming off the Warsh meeting on Friday while the 30Y hung in much better despite debates around the Bessent UST curve liability management gambit. We cover the UST deltas and Bessent actions in other posts (see Market Commentary: The Curve 8-30-26 ).
For all the excitement around the dazzling NVIDIA (NVDA) earnings report, the tech needle did not move much on the week with NVDA at a +1.32% price return for the Tech ETF (XLK) at only +1.3% holding down the #2 ranking here. NASDAQ made the top quartile with only +0.85% and the Equal Weight NASDAQ 100 (QQEW) made the top tier with only +0.68%.
The broad market S&P 500 was down in the 2nd quartile with 7 of 11 sectors in the red but edging into positive on a good week for Tech, Financials, and Communications Services among 3 of the largest sectors in the benchmark. The Russell 2000 dropped into the red and the bottom quartile with Midcaps (MDY) sitting at the bottom of the 3rd quartile.
The losing side includes Energy names (XOP, XLE) with the oil price drop and odds shifting for some resolution in the Strait. That just hit a speed bump by Monday with fresh clash and new exchanges of fire. There was some pressure on interest rate sensitive sectors such as Homebuilders (XHB) and Real Estate (XLRE). Homebuilders also reported a major drop in new home sales. Health Care (XLV) had a bad week and a mediocre month but is still #1 over 3 months and near the middle of the pack YTD.
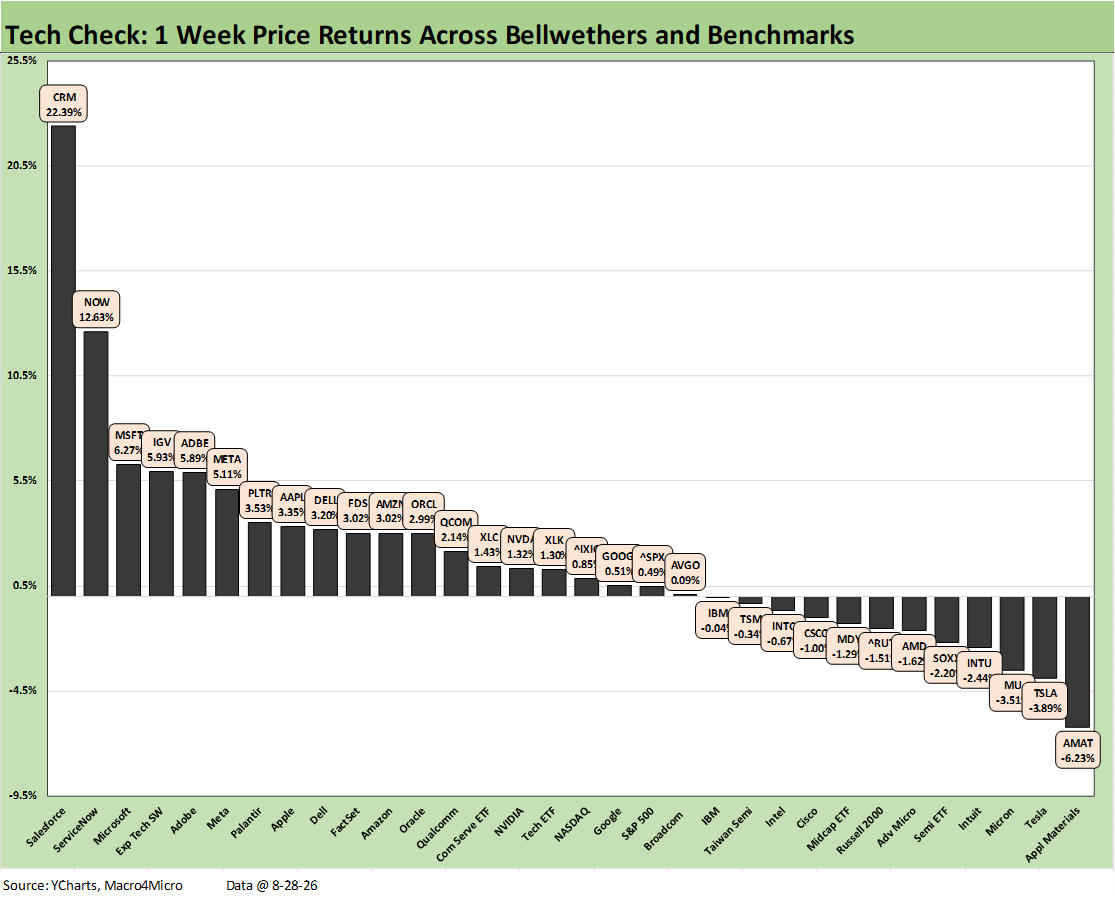
The tech check mix we monitor had a solid week with a 20-12 score led by a rally in the software and SaaS names that comprised 6 of the 8 top quartile names including Microsoft of the Mag 7. Those were joined in the top tier this week by two other Mag 7 names in Meta (META) and Apple (AAPL). We see the Software ETF (IGV) ranked #4 on the week at +5.93% well ahead of the Semiconductor ETF (SOXX) in the bottom quartile at -2.20%.
Salesforce (CRM) was the outlier on the week at #1 with +22.4% with ServiceNow (NOW) a distant #2 at +12.6%, which was well ahead of #3 Microsoft (MSFT) at 6.3%. Adobe (ADBE) and Palantir (PLTR) also made the top tier. CRM, NOW, and ADBE remain in negative return range on a YTD basis while PLTR is slightly positive YTD at +4.8%. The long road back is steady and is getting attention from value seekers for what many consider an early overreaction.
CRM reported a very strong quarter and cited growth plans in its agentic AI business. As a CRM competitor, NOW hitched a ride on the CRM numbers.
This week continued the slow and erratic rebound for those software and SaaS-based services names that were battered in the “SaaS-pocalyse” that was tied to a massive disruption of business models and “AI replacement theory.” Market watchers highlighted how the fears around such enterprise software names had grown neurotic and overdone.
The semiconductor and AI ecosystem names were beat up in relative terms this week with Applied Materials (AMAT) in the bottom quartile and 4 of the 8 bottom tier names tied into semis. We also see the Russell 2000 and Midcaps (MDY) in the bottom tier with Cisco (CSCO), Intel (INTC), and Taiwan Semi (TSM) in negative return range just across the line in the bottom of the 3rd quartile.
This week has Dell (DELL) and Broadcom (AVGO) scheduled for earnings for a fresh gut check on volume and pricing trends tied into the data center end markets and overall “AI trade.” DELL was steady this week while AVGO was barely positive even with the stunning earnings growth posted by NVIDIA (NVDA). NVDA only posted a +1.32% week even with the impressive numbers.
The tech-heavy NASDAQ (+0.85%) and S&P 500 (+0.49%) were both positive this week but with minimal returns in the 3rd quartile. The Mag 7 names were spread out again but with 3 in the top tier (MSFT, MET, AAPL) this time, 2 in the 2nd quartile (AMZN, NVDA), 1 in the 3rd quartile with Alphabet (GOOGL), and Tesla (TSLA) 2nd to last near the bottom at -3.89%, just ahead of Applied Materials (AMAT) in last place.
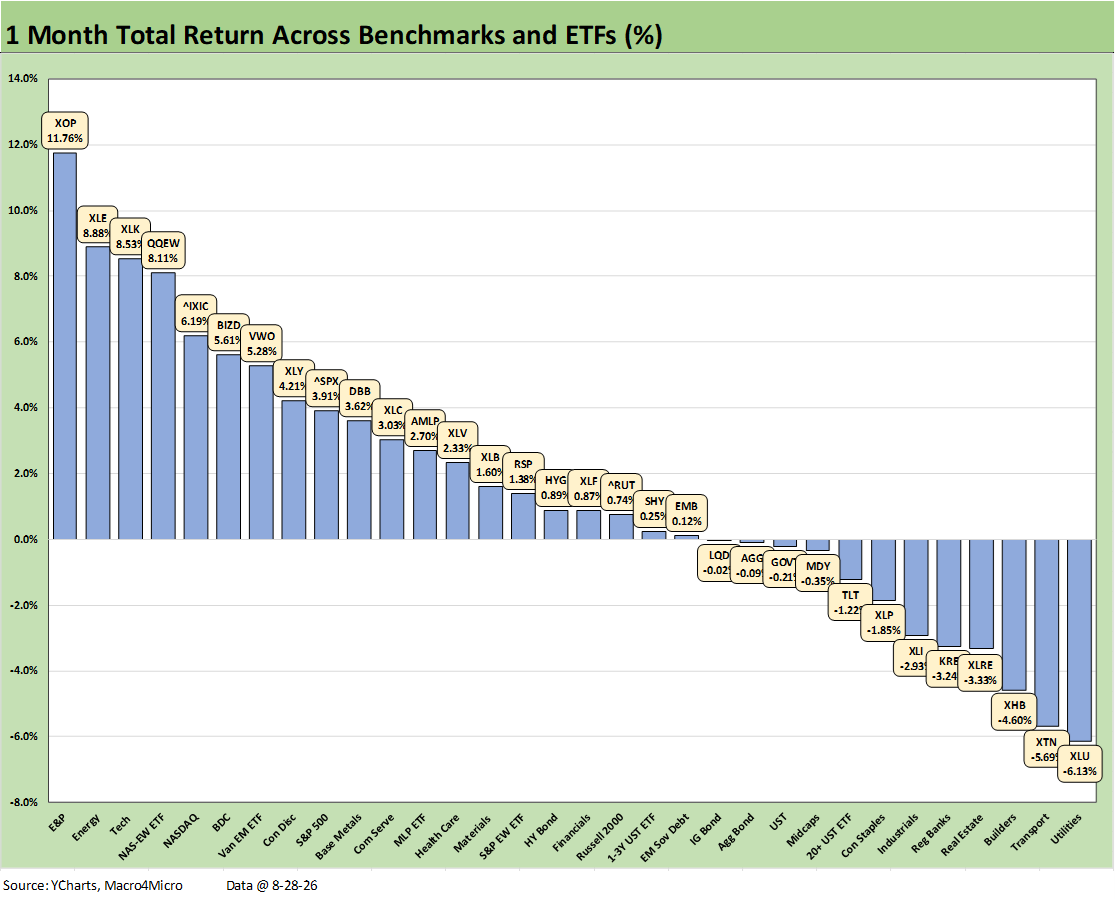
The 1-month returns for the broader group of 32 asset lines posted a score of 20-12. The E&P ETF (XOP) and Energy ETF (XLE) topped the leaderboard as upstream equities get wagged by Iran deals/non-deals and Trumpian jawboning on expectations. The monthly oil prices stacked up favorably vs. the measurement dates for the month with this latest week showing a decline.
With shooting underway again over the last 24 hours and hostilities not going anywhere anytime soon, we got a fresh oil price rise today to just under $86 from Friday’s $83. This latest flareup included comments on “mines” so that makes it more serious than just firing at ships in terms of what it means for Iran’s strategy from here. We work under the assumption that Trump has no set plan while Iran likely does.
Oil worries flow right into Warsh and FOMC handicapping as well as for investors framing UST curve steepening risk and what that means for fixed income allocations. For the trailing 1-month, bond ETFs saw 4 of the 7 we track in negative return range with the other 3 under +1.0% including 1 with a return of +0.25% (SHY, 1-3Y UST) and 1 with a return of +0.12% (EMB, EM Sovereigns).
The top quartile had some tech-heavy concentrations with the Tech ETF (XLK) at #3, the Equal Weight NASDAQ 100 (QQEW) at #4, and NASDAQ at #5. A top tier performer for the month that might surprise was the BDC ETF (BIZD) at #6 as earning season brought news that was negative but not as negative as the pricing appeared to anticipate.
The flip side of the bad bond performance was the concentration of interest rate sensitive asset lines in the bottom tier as dividend heavy names were hit with Utilities (XLU) and Consumer Staples (XLP) along with Real Estate (XLRE). Housing has been getting hit with a streak of bad news with Homebuilders (XHB) also sitting in the bottom tier (see New Home Sales July 2026 8-25-26, Housing Starts July 2026: Grim Numbers 8-18-26).
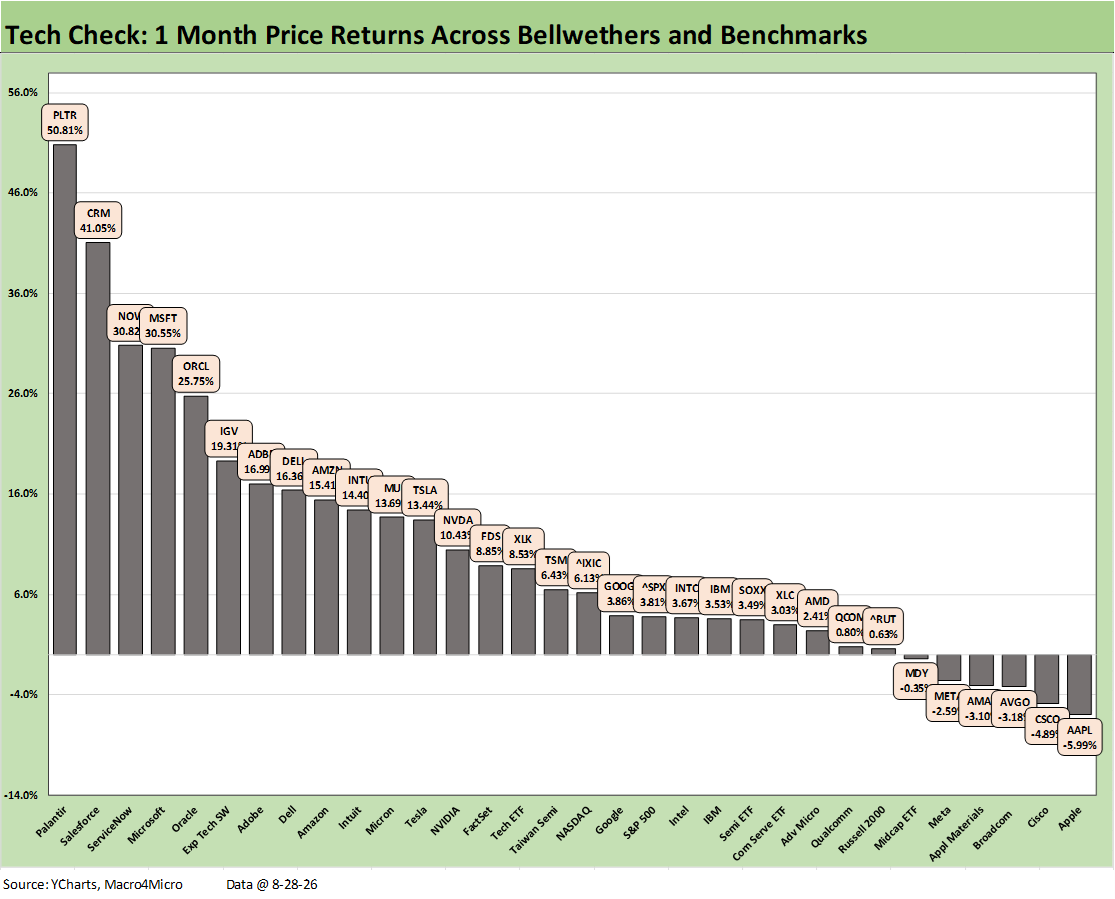
The tech check mix had a good 1-month period at 26-6 with a few notable exceptions. We see the software names come roaring back as discussed along the way in our weeklies. For the 1-month stretch, we see 7 of the 8 software related names with DELL making it into the 8th slot in the top quartile. The Software ETF (IGV) posted +19.31% for the month vs. +3.59% generated by the Semiconductor ETF (SOXX) over the same time period.
The semiconductor and AI ecosystem bellwethers were generally on the weaker side of the monthly median with negative returns for Cisco (CSCO), Broadcom (AVGO), and Applied Materials (AMAT) in the red.
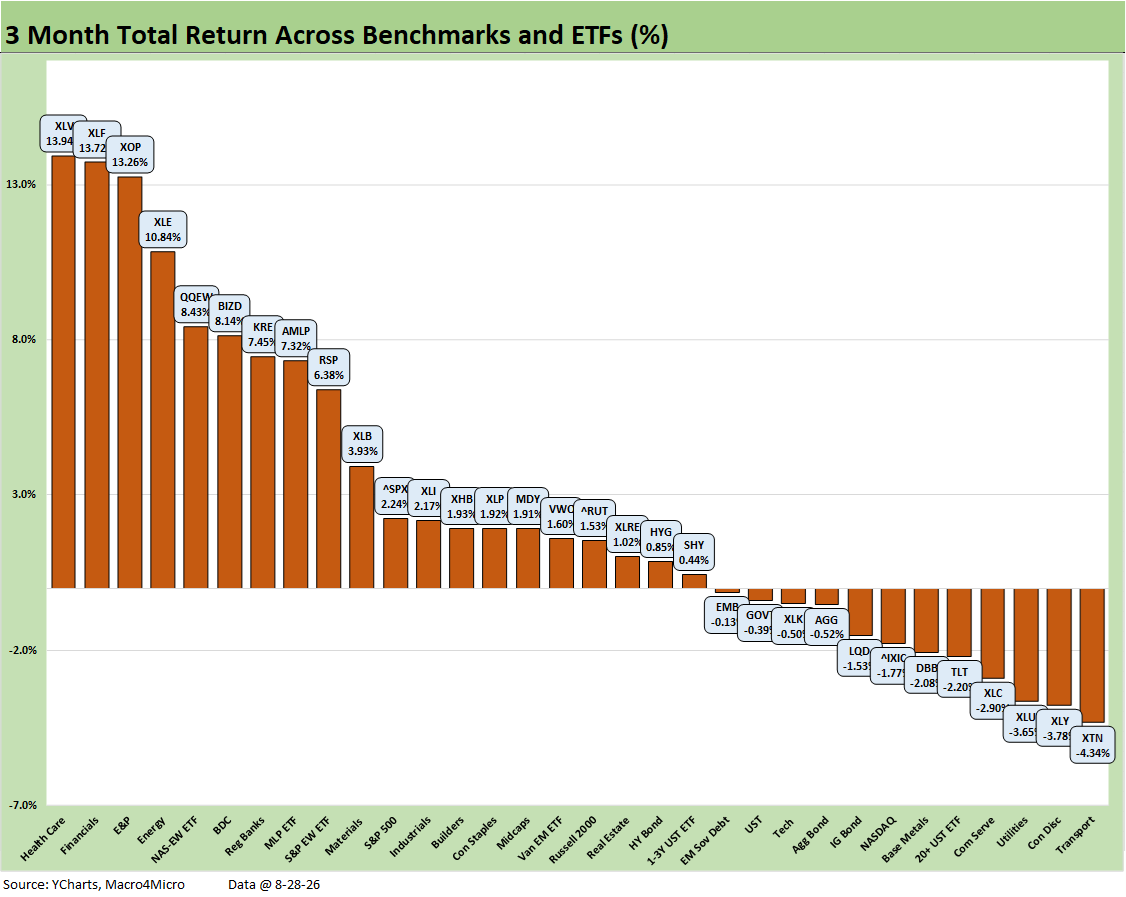
The 3-month scoresheet for the broader group of 32 asset lines posted 20-12 with a diverse base of subsector ETFs in the top quartile that included Health Care (XLV) at #1 and Financials (XLF) at #2 with Regional Banks (KRE) also making the top tier. A supportive view of asset quality and cyclical dynamics are evident in the BDC ETF (BIZD) making the top tier.
Interestingly, the Tech ETF (XLK) was down in the lower end of the 3rd quartile with some of the highflier retrenchments during that measurement period. That same effect sent the NASDAQ down into the bottom quartile. An exception was the Equal Weight NASDAQ 100 ETF (QQEW) which made the top quartile with less issuer concentration.
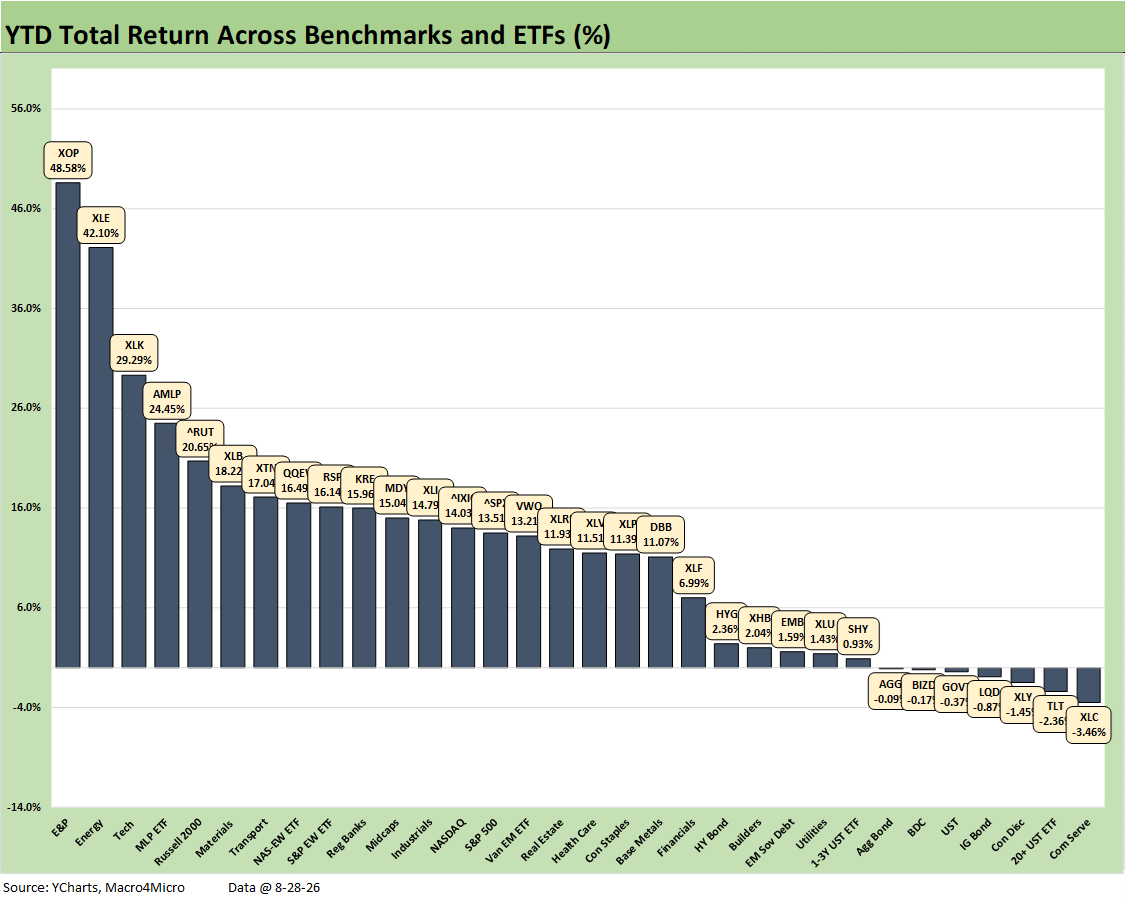
The YTD return table for the broad group of 32 posted 25-7 in what is a very good year for equities by any standard. When you consider that 4 of the 7 negative returns are bond ETFs and 5 of the 8 in the bottom quartile, the fixed income allocation has been a challenge from a short-term time horizon perspective. Duration lost and dividends saw value erode, and valuations in tech can face pressure if that trend stays in place.
Where we go from here in bonds as usual is about “expansion vs. recession” and about “inflation vs. price stability.” Across history (and for those of us who came of working age during the stagflation days), the dagger for bonds can be oil prices. That includes downside risk for the consumer sector and less favorable project economics that come with the natural pressure on long rates. The secular capex boom for the AI ecosystem might save the project economics, but it also can keep fueling demand and inflation.
The trick for economic policy leadership is not being stupid enough to start a war in the Middle East or attacking Iran. Middle East disturbances have been know to bring risks like stagflation such as the Arab Oil Embargo fallout (4Q73 to 1Q75), the post-Iran crisis 1979 fallout in the 1980-1982 double dip, and the brief 1990 recession onset. Team Trump did not get the memo.
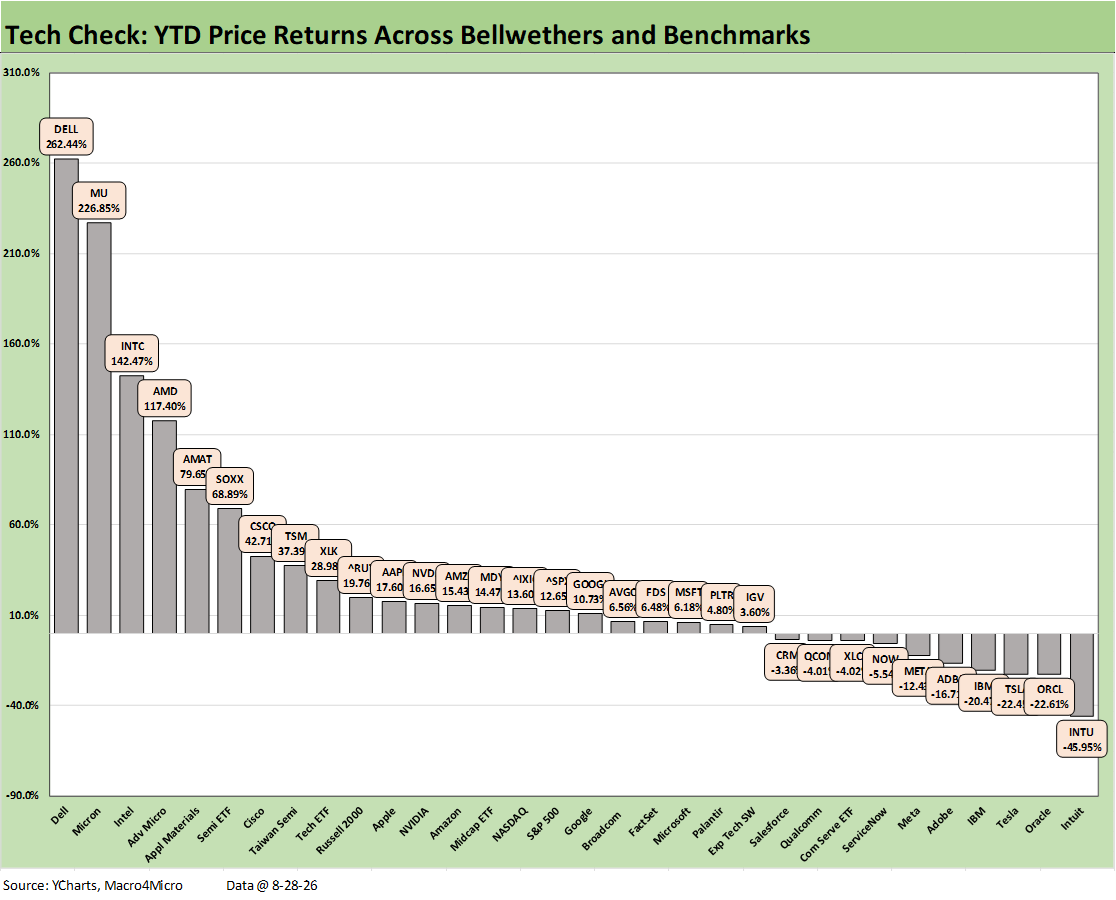
The YTD tech check mix posted a YTD score of 22-10 with the AI ecosystem ruling the top quartile and software and SaaS-based service operators dominating the bottom quartile. The 10 negative returns run from Salesforce (CRM) at -3.36% down to Intuit (INTU) at -45.95%. We see 6 of 8 names in the top quartile tied into semiconductors (MU, INTC, AMD, AMAT, SOXX, TSM) with broader AI ecosystem names such as DELL and CSCO rounding out the top 10.
Even with recent setbacks, the chart highlights the off-the-chart numbers on the leaderboard. The top quartile runs from Dell (DELL) at +262.4% to earn its #1 ranking down to Taiwan Semi (TSM) at the bottom of the top quartile with +27.39%.
The wild run for tech in this cycle is led by much healthier companies than the halfway house of origination ahead of the 1999 NASDAQ boom year (+86% return that year for NASDAQ). Valuations back in 1999 were dependent on forward valuation assumptions that would not come close to being realized.
When some people cite “tech bubble” of the late 1990s, they mean internet stocks. For those living more in the credit world, they are referring to capex-intensive media and telecom names that were borrowing to plug the gaping hole in cash flow that was tied to betting the ranch on tech rollouts (e.g. wireless broadband, etc.) or capital spending on cable/fiber and M&A.
In the current cycle, this time the “after capex bleeders” are much larger and healthier credits – even if they are getting less healthy in credit very quickly with financial debt or lease adjusted debt. The numbers are radically larger as the headlines have been covering. That is, to the point that IG mega-borrowers are rattling the UST supply-demand balance.
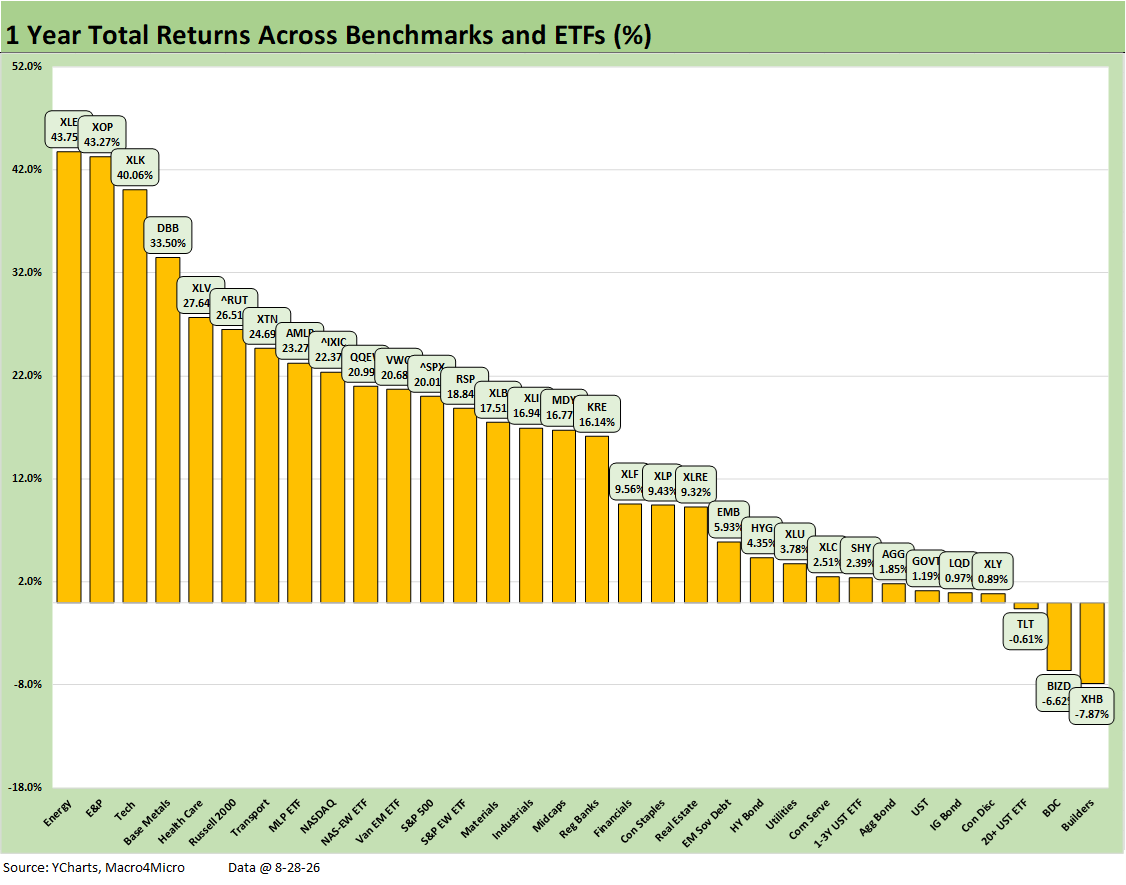
The LTM score of 29-3 includes only Homebuilders (XHB), BDCs (BIZD) and the long duration UST 20+Y ETF (TLT) in negative return range.
The top quartile includes 3 from energy subsectors (XOP, XLE, AMLP) with Tech ETF (XLK) and Base Metals (DBB) also in the mix of commodity supply-demand imbalances of all types flowing into products such as base metals (aluminum, copper).
It is reassuring to see Health Care (XLV), the small cap Russell 2000, and Transports (XTN) in the mix for some semblance of breadth. This is one chart where “one investor’s win is another investor’s losses” given how energy and commodity costs are undermining costs and price stability.
See also:
Market Commentary: The Curve 8-30-26
PCE July 2026: Mixed Consumption, Stubborn Inflation 8-26-26
2Q26 GDP: 2nd Estimate 8-26-26
New Home Sales July 2026 8-25-26
Market Commentary: The Curve 8-24-26
US-Canada: Benches Ready to Clear 8-22-26