
Footnotes & Flashbacks: State of Yields 12-3-23
We look at the material UST move of the past week as a shapeshifting is again underway.


We look at the latest in a series of sharp UST moves that reflect any combination of high confidence in declining inflation, low confidence in economic and employment growth rates, and perhaps some cockiness around the ability to predict Fed behavior.
The revised 3Q23 GDP numbers were very strong with fixed investment seeing major revisions, the PCE release was supportive of optimistic inflation themes and expectation of a more controlled consumer, and that all added up to a good week for UST and capped off a great month for equities.
The employment numbers this coming week with JOLTS and Payroll will get a lot more attention than usual (if that is possible in this volatile UST market) with curve bulls looking for some weakness and equity bulls looking for some explainable balance.
We update some UST slopes with a look at 3M to 5Y, 2Y to 10Y, and 5Y to 30Y for a fresh round of inverted vs. flat vs. steepening ponderings.
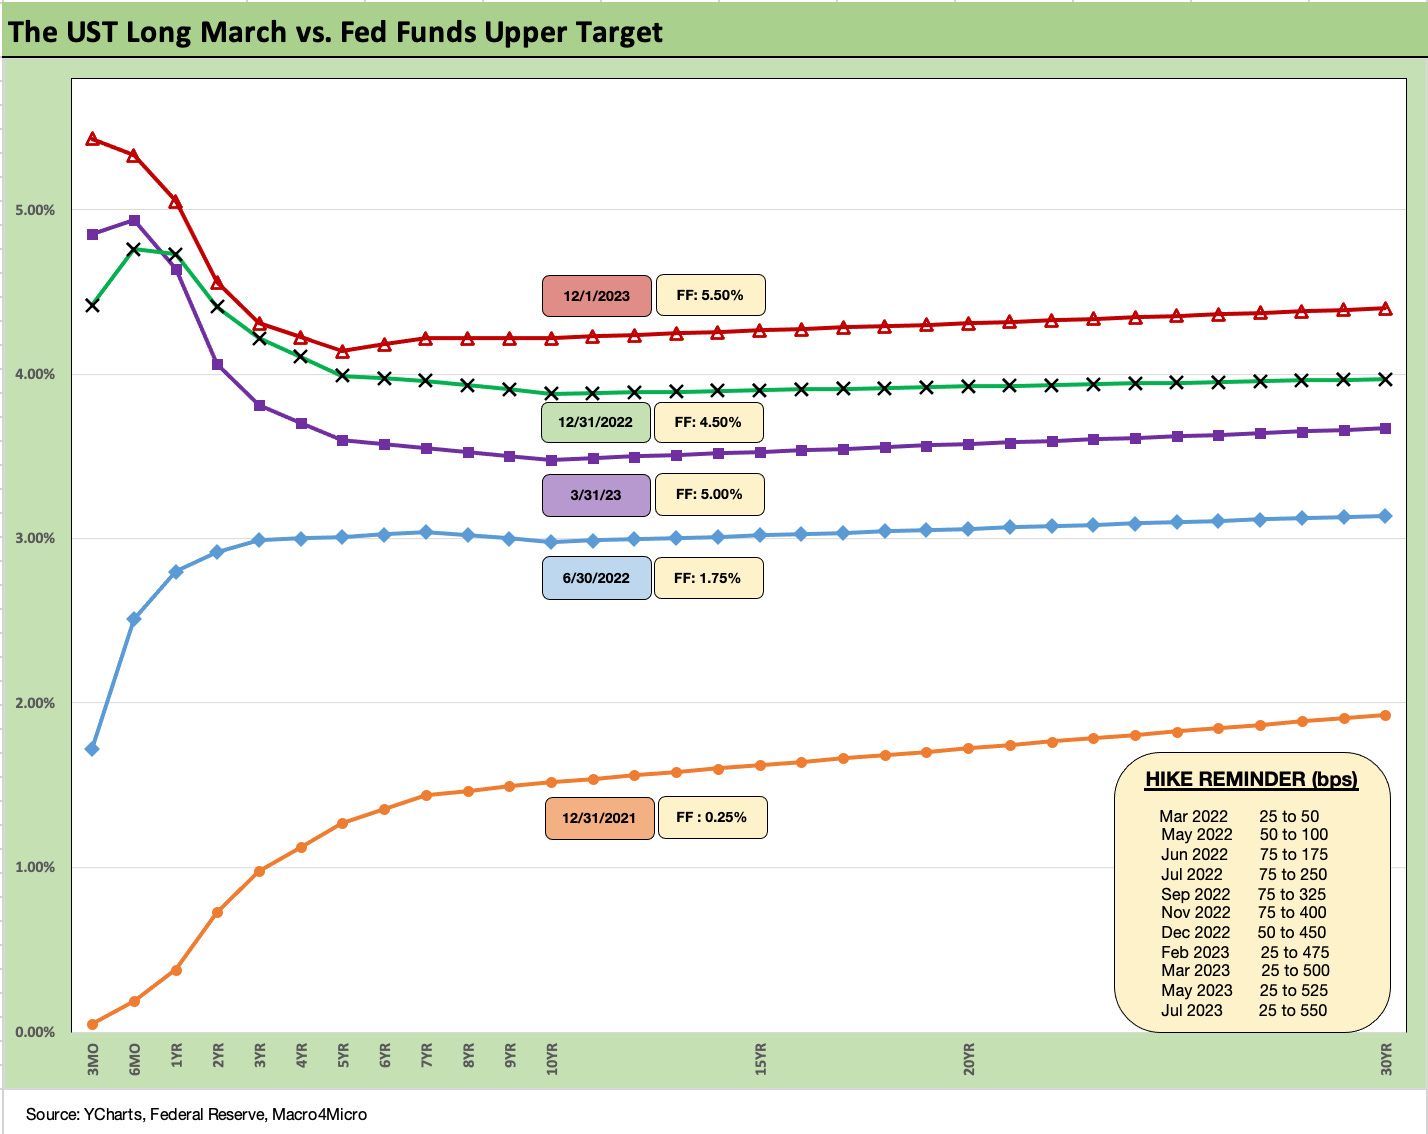
The above is our usual kickoff chart in the weekly Footnotes piece on yields, and it is easy to see a more notable inversion again on the front end. The timeline shows the upward migration from the ZIRP period to end 2021 across a bear flattening into a bear inversion as the UST shift accelerated after Mar 2022. The year 2023 started out with a downshift and bull inversion as the Fed kept hiking and the UST market screamed recession. Now we are seeing the UST curve throw the gears into reverse and shift down again.
The market is embracing the school of thought that Goldilocks is a witch who can power higher earnings, balance trends in employment, PCE, and economic growth, and send the UST into a downward shift from here with a bull steepener sustained from the front end and not a bear steepener. Goldi sees a market that can absorb UST supply that will border on biblical. Apparently, Goldi also has the power to sway Powell et al to take some risk in easing rather than be defensive about getting thrown into the Hall of Shame with Fed leaders Burns and Miller from the 1970s.
UST curve brings risky asset rally time…
We look at asset returns in a separate Footnotes weekly publication, but the overall effects of the UST curve rally with the balanced fundamental indicators and constructive 3Q23 guidance has sent credit spreads into a powerful OAS compression mode across all the credit tiers from IG into HY. Regional bank equities soared this week and this past month, the 2Y to 5Y shifted down with a vengeance, in turn supporting credit conditions.
At this point, we are looking at June 2014 or early October 2018 moments for spread comps. It is also worth remembering that June 2014 and Oct 2018 multiyear tights in HY spreads ran into a juggernaut of trouble not long after. There is the chance that the mix of factors still favor yield chasing with the demand for higher all-in yields being simply unshakeable with a tangible trigger event still hard to find even if it is easy to make the list.
The UST and spread rally seems over the top given the mix of drivers across record deficits, record UST supply, mixed economic trends, record payroll, rising wages, budget dysfunction in Washington with a ticking shutdown, and geopolitical tension galore.
In the end, the scoreboard says it all with HY OAS -60 bps tighter over the trailing 1-month period (ICE), IG and HY now past a coupon annual return (easily in HY), equities back to a high for 2023, and the UST index and GOVT ETF back to positive YTD.
The IG tier is running materially tighter now, narrowing by -22 bps over 1 month with IG spreads at +111 bps. The market is having one of those wild rallies we see from time to time that seems to overshoot the moving parts. We look at some histories in the IG and HY yield section further below.
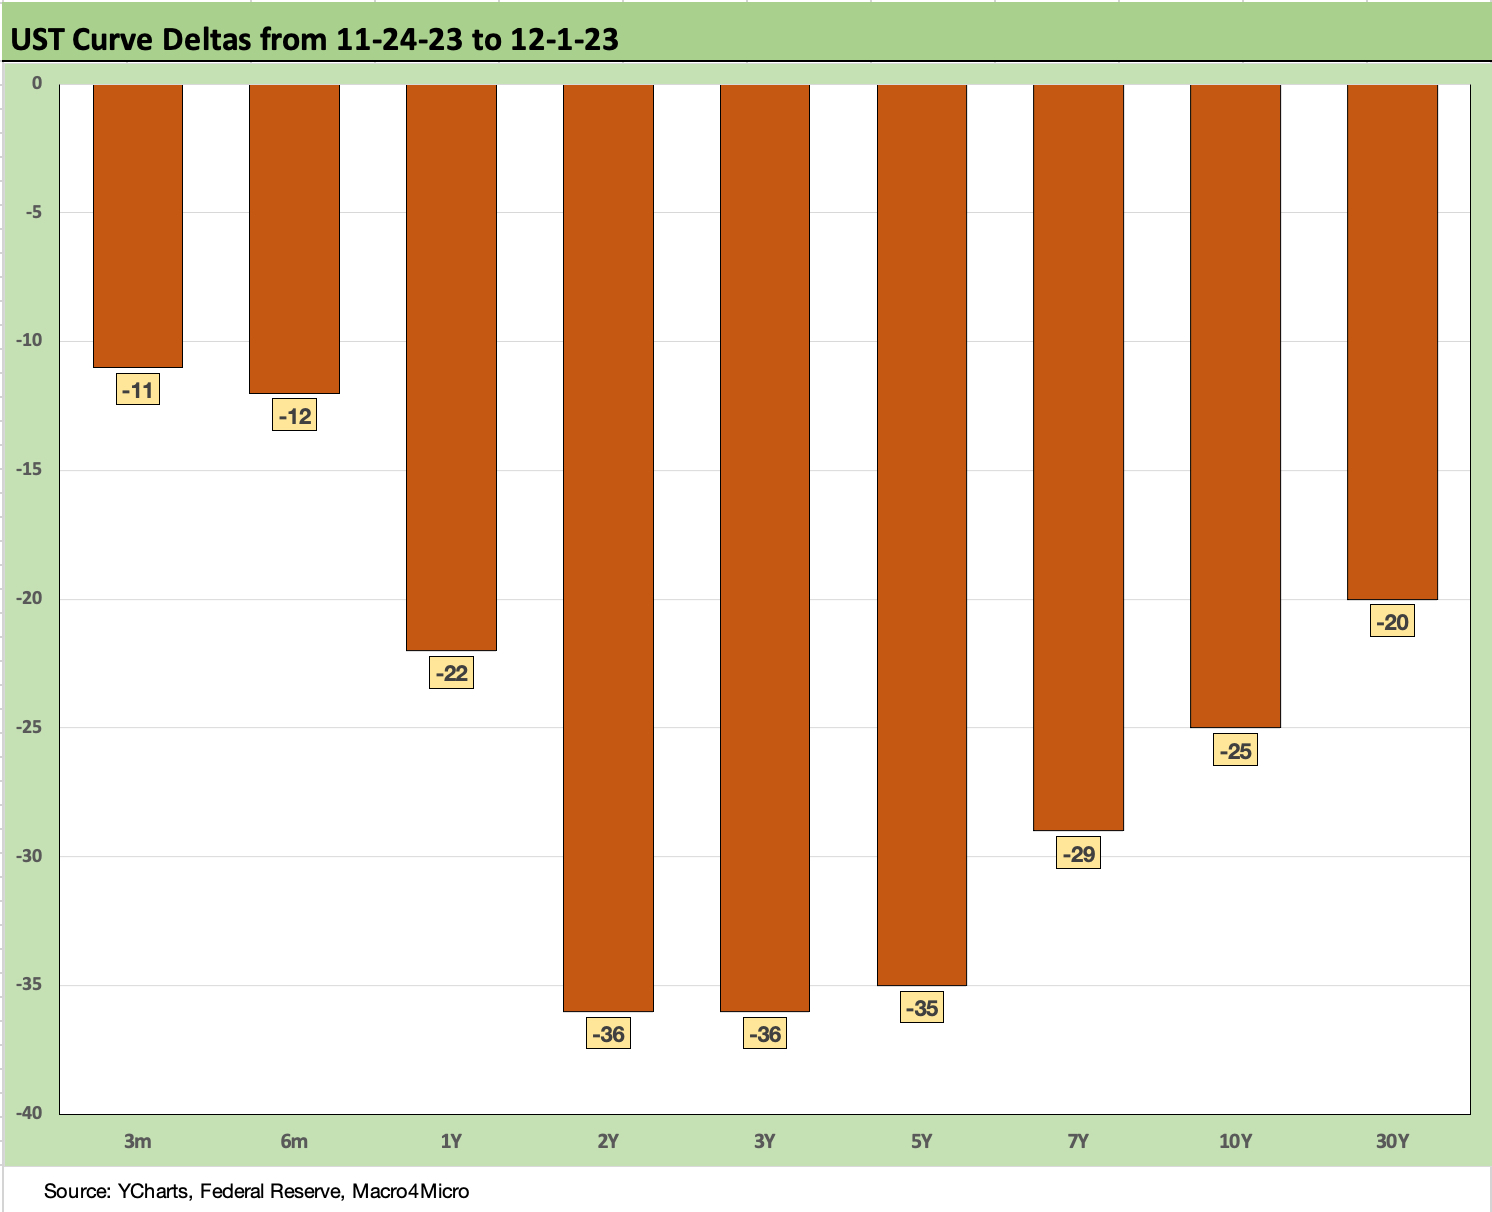
The above chart frames the UST deltas for the week, with 2Y to 5Y moving sharply lower in what is a bull steepening. You don’t see those every day running alongside a 5% handle GDP release (see 3Q23 GDP: Fab Five 11-29-23) and record high payroll numbers. The PCE release helped this past week (see PCE Prices, Consumption, Savings: Good News is Less News 11-30-23) as it signaled less voracious (but still eating well) consumer sector and a downtick in PCE price indexes.
The construction numbers this week offered a reminder that a lot is going right on the fixed investment front (see Construction Spending: Timing is Everything 12-1-23), and that has multiplier effects. Those who want a mixed picture on fundamentals got some more negative signals from ISM, which remains mired in contraction. The ISM has been in contraction mode since last fall, so it has lost some appeal as a near term indicator. Nonetheless, ISM goes in the negative column.
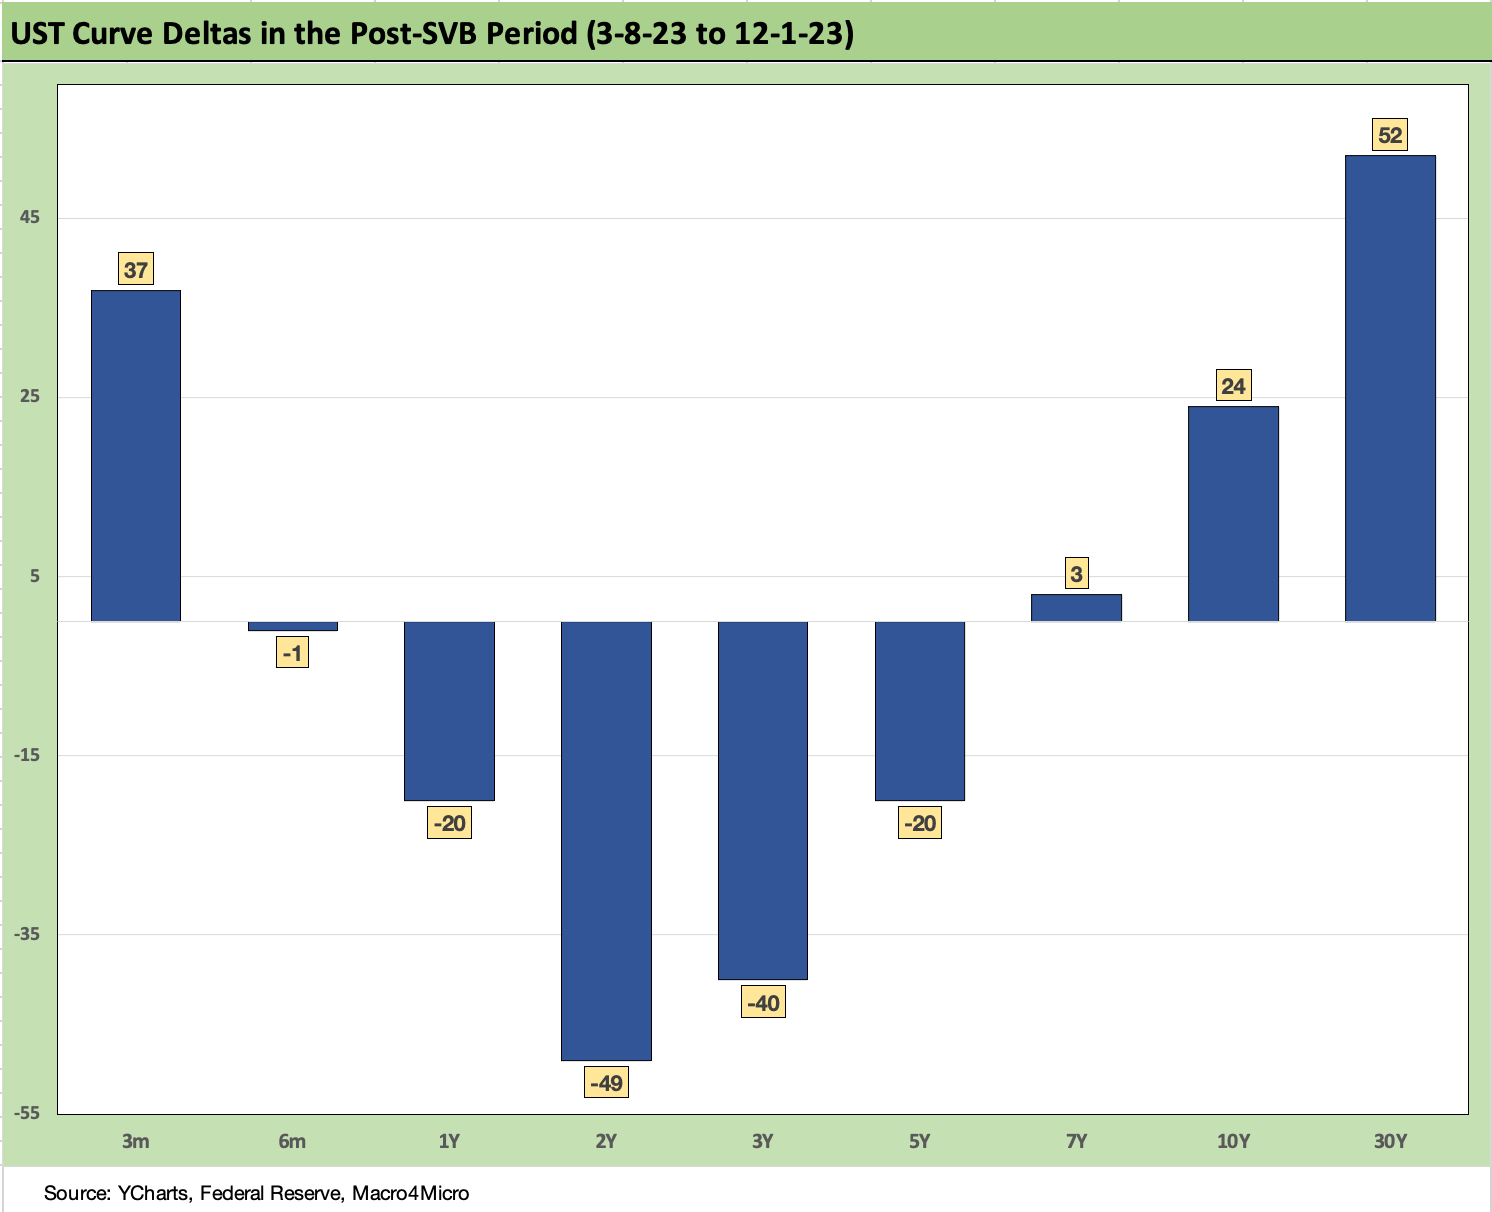
The above chart updates the post-SVB curve moves with the trends migrating in recent weeks from a bear steepening to a more bullish steepener even if the long end remains above the period before the regional bank mini-crisis and ensuing tightening of credit conditions for regional banks who needed to watch their risks and depositor sentiment quite closely (and vocally).
With private credit and direct lending now a hot area, that regional bank defensiveness may not be a problem it would be otherwise for credit contraction risk in the broader economy. In other words, the regionals can go about healing while some emerging credit sources pick up the slack. The “SLOOS” report has a new set of asterisks with more alternatives for borrowers in need.
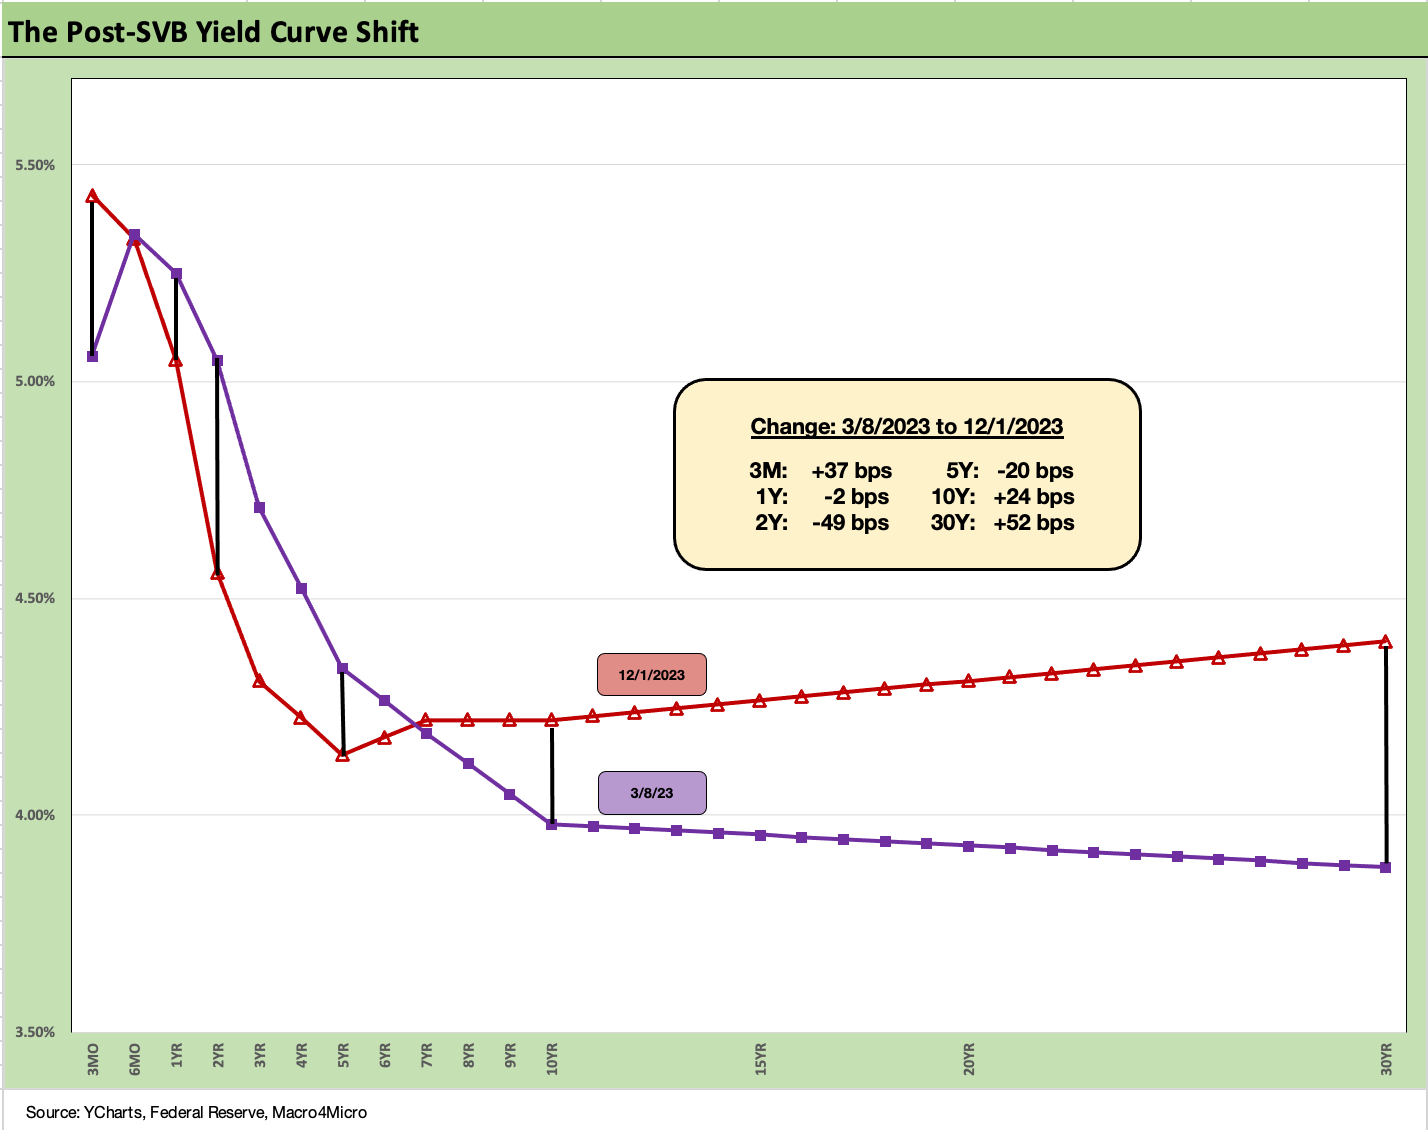
The above chart puts the post-SVB post-regional crisis into yield curve format. The lower levels are more pronounced from 1Y to 5Y. What is notable is the steepening out past 5Y UST, but a steepening at lower absolute levels from the flirtations around 5% only weeks ago. We address the shift in running differentials in the final chart in this note.

This is a chart where we carry over some of the commentary each week since we get new readers on an ongoing basis. The comparison of current mortgage rates to the peak of the housing excess of 2005 and 2006 makes for some interesting input on how to consider what factors can drive activity on new residential construction (“starts”) and existing home sales. We try to update as appropriate and tweak/add where needed.
The bubble lookback years…
With this chart, we drop in the UST curves and the Freddie Mac 30Y mortgage benchmark for two periods from the housing bubble. The Freddie benchmark gets released each Thursday. The Friday quotes away from Freddie were again down to near 3-month lows.
The historical comparison above gives context to how strong demand can be with 6% handle mortgage rates such as in 2005 and 2006. The problem this time around is how much prices soared in 2020-2021 ahead of the Fed tightening cycle. We include the year end 2005 date as the peak homebuilding year and the middle of 2006 when the “liar loan” phenomenon and subprime excess was cresting.
In 2006, subprime was starting to show some cracks but was not yet sending the credit markets into a case of nerves. That would take more quarters to go by. Even then, equities only folded later in the fall of 2007 before the onset of a recession in Dec 2007 (that “official” date for recession was set much later by NBER).
It is notable that the current UST curve is now below the end of 2005 in 10Y UST (it has been running above it as of last week) but well below the intermediate and long end of the UST curve seen in mid-2006. Despite that UST configuration, the 30Y mortgage levels of 2023 are well above both 2005 and 2006. The 30Y mortgage rates were pulling away before this latest UST curve rally and remain almost a point above 2005.
The mortgage vs. UST relationship is a reminder of how mortgage spreads have trended in this cycle vs. the years of overconfidence in the pre-crisis period. That is one reason we see some asset allocation voices growing louder on mortgages as a value in fixed income. I spent too many years around mortgage professionals to weigh in on the mortgage debate (time to invoke the Dirty Harry rule of “Man’s got to know his limitations”), but these relationships above in mortgage rates vs. UST rates present an anomaly.
The latest move on mortgages helps, but 7% is a long way from a housing catalyst…
Any downward moves in UST rates and mortgages make it easier for homebuilders to do even more attractive buydowns and keep their run rates on housing starts solid enough to push back on recession theories. As we show in the returns Footnotes commentary we will post later, the Homebuilder ETF (XHB) YTD is running at #3 of the 31 we track. XHB is only behind the Tech ETF (XLK) and Communications Services ETF (XLC) but is ahead of #4 NASDAQ. That is impressive in a tightening cycle.
For the builders, the trick is targeting mix, regions, and margin hurdle rates on its communities. That said, even a flat 7% or high 6% 30Y mortgage rate delivers an enormous amount of monthly payment pain to homebuyers. With so many potential sellers sitting on 3% handle mortgages (and even lower), the inventory is going to stay tight (see October Existing Home Sales: Searching for Lows 11-21-23 ).
What mortgage rate works?
The signal from the homebuilders on what mortgage rate level works for many buyers in their mortgage rate buydown incentive programs appears to be the high 5% handles. The 7% line will not move enough potential sellers in the existing home sales market, but lower rates give the builders more to work with as a starting point in meeting demand for housing.
As we saw in the recent New Home Sales stats this past week (see October New Home Sales: Low Bar to Clear 11-28-23), homebuilders have won a materially higher share of total sales in this market even if we see the pace topping off right now as we move into the offseason. We looked at a range of homebuilder rankings (Revenues, ASPs, market caps) and stock performance data in a report we recently posted (see Pulte: Relative Value Meets Old School Coupons 11-15-23).
This coming week, the market will get a taste of high price home trends with Top 5 builder Toll Brothers reporting its 4Q23 earnings (Dec 6). We then have #2 builder Lennar reporting 4Q23 earnings on Dec 15. Toll is always an interesting and distinctive operator with its read on the high price segment (see Credit Crib Notes: Toll Brothers (TOL) 9-11-23), but Lennar will offer the more valuable color given its product range, geographic breadth, and some mixed margin and sales price trends (see Credit Crib Note: Lennar 11-22-23).
The beauty of all the rolling fiscal years in homebuilding is that you get fresh updates and market views more frequently on orders and cancellations and incentive policies. The incentives include interesting color on mortgage rate buydowns and working capital management (deliveries vs. starts and new community trends). These translate into indicators of economic activity. Builders keep picking up share and the ability to tailor the home to the buyer with the right package of mortgage offerings is part of how builders have performed so well in the 2023 market. Of course, overwhelming demographic need helps also.
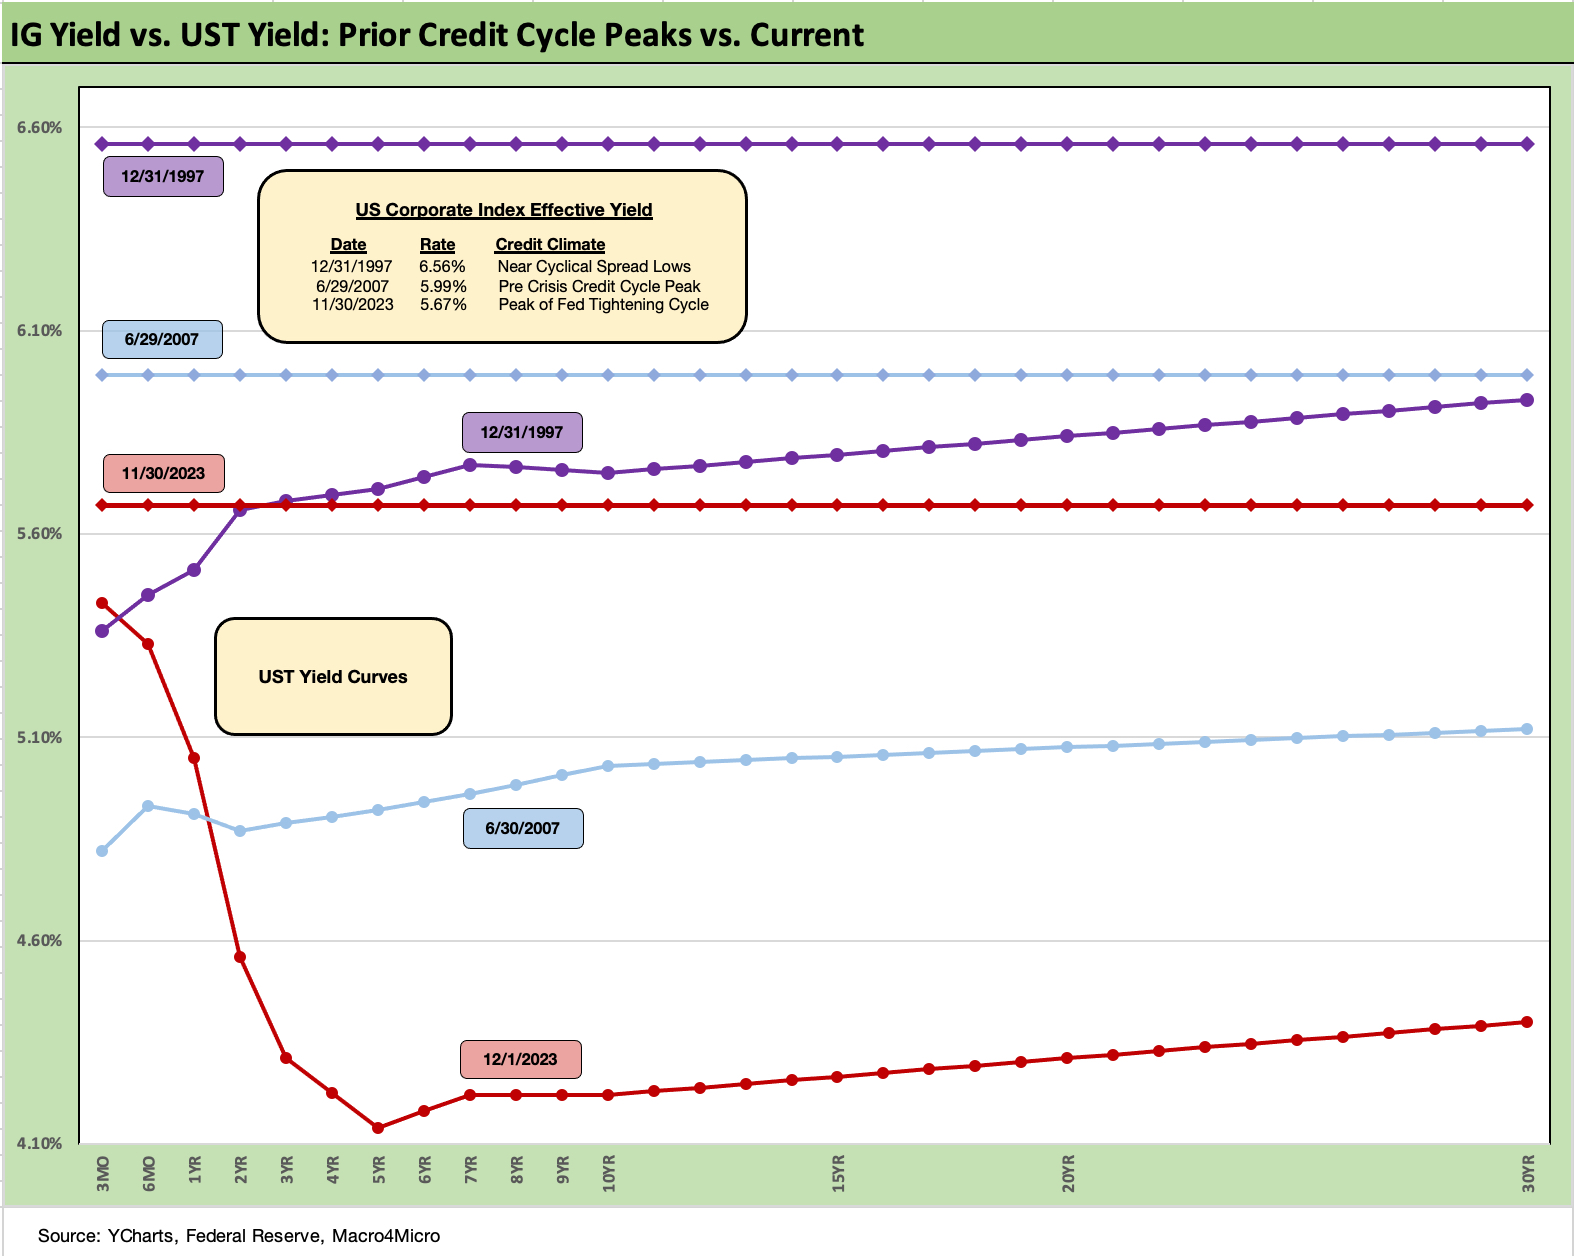
The above chart goes through a similar “then vs. now” exercise for the current UST curve and IG index yield. We compare current days to earlier credit peak periods (1997, 2007) when the IG corporate bond market was at or near credit spread lows. We cover asset returns in detail in a separate Footnotes publication, but the recent moves the past month have been bullish for all buckets of US risky assets across equities, UST, and in both duration and credit spreads in corporate and HY markets.
Spreads were tighter in those peak periods of 1997 and 2007 than in recent periods, but this latest run in IG is closing in on 2007 with the ICE IG index closing last week at +111 bps (12-1-23). For the past week, IG spreads tightened by another -3 bps. That makes -22 bps tighter on the trailing month, which is a very strong performance by IG standards.
The ICE IG index OAS is around -25 bps through the long-term median, so spreads are still not signaling trouble or fears around a material spread wave along the speculative grade divide (see HY Credit Spreads: Migration, Medians, and Misdirection 11-6-23).
As we look back across periods of spread compression near credit cycle peaks, the +70 bps for the IG index at the end of 1997 was much lower (the low was in Oct 1997 at +53 bps) than today. The 1997-1998 average for IG OAS was +95 bps. Those offer some historical context for today’s post-rally levels.
In 2007, as the market was looking questionable by midyear, IG OAS was at +100 bps at 6-30-07 at the credit bubble peak. IG spreads were widening by mid-2007 after the period from 1H04 through 1H07 saw IG OAS averages in double digits at around +93 bps. The lows in 1H07 of +86 bps and IG OAS of +100 bps to end June 2007 were not far from lows in 2H06 at +90 bps and 1H06 at +87 bps.
The takeaways from the 1997 and 2007 periods were that those risk premiums were in stages of the cycles that were on shaky ground given the direction of credit quality. That is where the “What comes next?” questions come in today whether that be around Fed policy, cyclical trends, geopolitics, Washington policy actions, underwriting quality, outflows in less liquid assets, and the list goes on.
As we now know, the market events got very noisy after those 1997 and 2007 periods and dramatically so after June 2007. The 1998-1999 period was a protracted stretch of global credit volatility (Asia, EM, etc.) ahead of the launch of the eurozone credit markets to start 1999. For TMT, it ended badly.
The resilience in the risky asset markets (HY and equity alike) in the late 1990s was remarkable in retrospect given the ability of the US credit markets to decouple from Asia and then the broader EM turmoil that helped send LTCM into a “soft bailout” crisis. The ability to turn away from risky Yankee deals in late 1997 and into 1998 was clear enough, but the tech enthusiasm in the equity markets was hard to shake with the NASDAQ at +86% return in 1999 even with the default rate materially higher by 4Q99.
BBB tier hangs tough in 2023…
It is notable that the BBB tier OAS has not been moving much across these recent rally weeks seen in the UST and equity markets. That started to change with the trailing month now -24 bps tighter in BBBs. On a YTD basis, the BBB tier is -33 bps tighter. That means over $4 trillion of face value ($3.7 trillion of market value) in the medium grade tier is not showing a case of nerves at this point. The BB tier being -68 bps tighter helps.
The BBB tier posts an all-in yield has now dipped below the 6% line with the rally and stands at 5.8%. The BBB tier OAS of +139 bps to end last week has been a winner vs. 2022 when we saw periods with +200 bps handles in the late Sept/Oct period and earlier in July 2022. The same pattern was true for HY OAS. That +200 bps stretch for the BB tier saw a lot of “We are in a recession now!” commentary loose in the market (see Unemployment, Recessions, and the Potter Stewart Rule 10-7-22). That no landing, soft landing, and hard landing debate will remain noisy.
Back in 2022, we did not see a recession in place even if just on the employment numbers and steady positive PCE. Seeing the rates and oil spike pain take a toll was easy enough to speculate on for a recession to roll in at some point even if later in 2023. That was the case even if just a 2001 style recession (mildest postwar contraction despite the ugly credit cycle). The downside risk factors did not play out, however, and notably on the consumer and jobs side. Meanwhile, oil has not reacted in line with the bearish expectations with energy equities now ranking among the worst performing sectors YTD in 2023.
We did not see recession signs by any stretch during 2022 but assumed the burden of interest rates, oil, and consumer pressure would eventually show up. Contraction has been slow to arrive despite the consumer credit quality signals on consumer delinquencies and some slowing of job growth so far. We had our doubts about how credit spreads could hold up against all the rate lag pressures and potential for worsening geopolitics and the re-priced inflation menu.
Since then, inflation came under control faster than we could have hoped for (CPI “All Items Less Shelter” at only 1.5%). The economic reality is that fixed investment has been nothing short of impressive across 2023 and especially relative to expectations. The economy and risky markets have both held up very well and are wrapping the year in style.
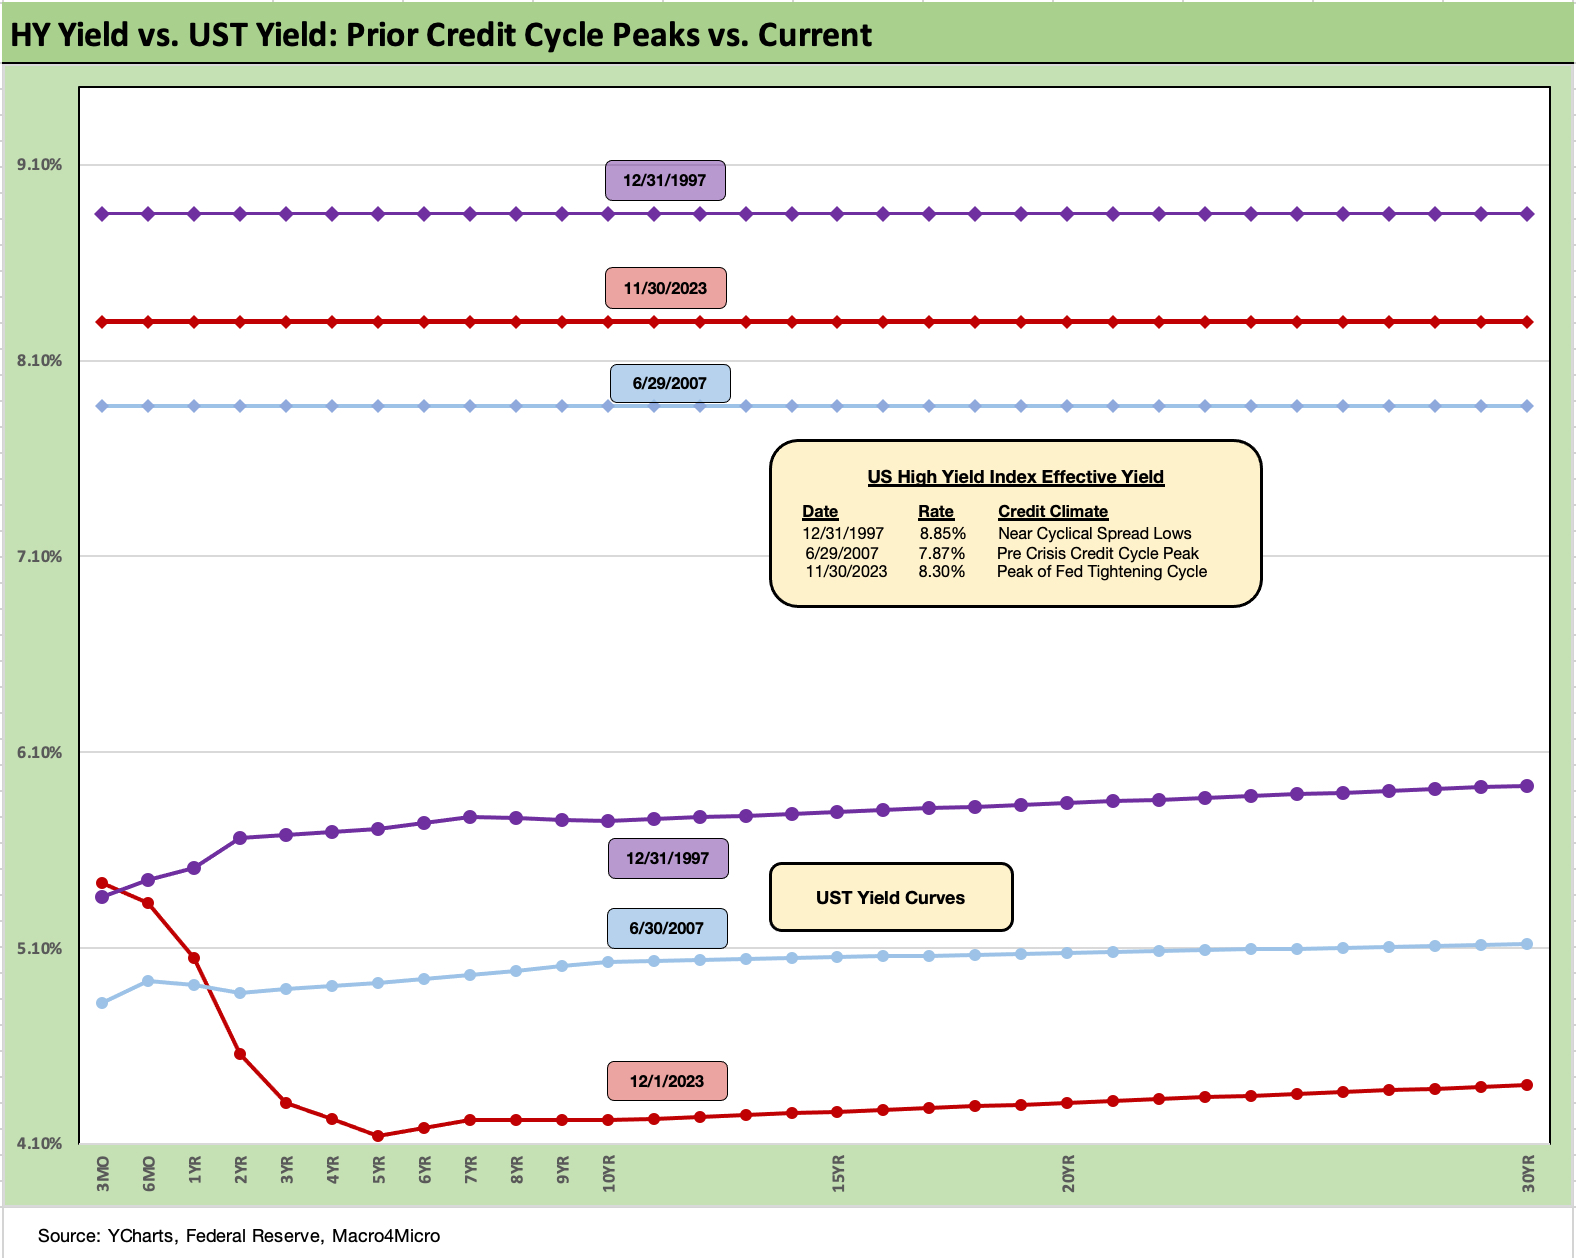
The above chart does the same drill for the US HY market as we did for the IG markets. We use the same dates (1997, 2007) as IG to frame the symmetry of risks today. We saw HY OAS at +296 bps (12-31-97) although HY OAS had been inside +250 bps in Oct 1997 (+244 bps on 10-17-97). The 1997 period saw average spreads of +282 bps in 1H97, +270 bps in 2H97, and +298 bps in 1H98 before the summer storm of Russia and LTCM rolled in from August into the fall.
The peace and quiet of 2007 was very short-lived relative to 1997. HY OAS averaged around +270 bps in 1H07 vs. HY averaging +270 in 2H97, so the two periods have some common features in spreads. During the crazy period of June 2007 as the market fuse was burning down, we saw a HY OAS of +298 bps on 6-30-07 (as tight as +244 on 6-1-07) vs. the +387 bps to close last week (12-1-23).
In terms of this latest compression wave, HY OAS was a dazzling -49 bps tighter during the week of 11-3-23. For the current week, the overall HY move was minimal but that came after a strong prior week (11-24-23), where the move was -14 bps tighter. The BB tier was -52 bps tighter during the big rally week of 11-3-23, the B tier -47 bps tighter, and the CCC tier -24 bps tighter. For the trailing 1-month, the BB tier is -53 bps tighter, the B tier -76 bps tighter, and CCC tier -78 bps tighter.
HY OAS in multicycle context…
The absolute OAS in historical context and relative to the risk free and lower risk alternatives do not stack up well vs. history and medians (see HY Credit Spreads: Migration, Medians, and Misdirection 11-6-23). They have tightened materially across the year from year end 2022 (+481 bps ICE) to the current +387 bps. We had expected HY OAS to get shaken by now from such tights, but it has not happened.
These levels are well below the long-term HY median of around +472 bps, so the risk-reward symmetry is getting shaky. With UST in rally mode, equities hitting new 2023 highs, and institutional flows from such areas as pensions favoring increased allocation to credit and favorable all-in yields (5.7% IG, 8.5% HY), the demand side for risk is driving the bus.
A lookback at 2014 and 2018…
For reference points, we can once again start talking about the June 2014 lows (+335 bps on 6-23-14) and Oct 2018 lows (+316 bps on 10-3-18). Those 2014 lows and 2018 lows are 2 or 3 good months away. Those lows were not like 2007 or 1997, but lower 300 handle lows are rare. It is worth remembering that the periods after the Oct 2018 lows and June 2014 lows did not go well.
The all-in yields are hard to resist for many. On 6-23-14, the HY YTW was 4.85% while 10-3-18 posted YTW 6.24%. Both of those yield backdrops are substantially below the 8.5 % HY index YTW to close on Friday (12-1-23). An asset allocation strategist can be forgiven for chasing yields that high even if the risk premium is too low in historical context vs. lower risk alternatives. Yield bogeys can carry the day for many, especially after 15 years of yield starvation since the credit crisis.
The 5.7% yield in IG corporates leaves ample room for debate on the relative asset class value of IG vs. HY in expected returns. If you are thinking soft landing or mild recession and easing, the old trade-off of duration and interest rate risk vs. credit risk comes into play. If you are thinking hard landing, then IG is the safer play vs. HY. That is a topic for another day in planning for 2024.
Fundamentals have been in aggregate solid, and 3Q23 earnings season did not signal trouble in the immediate context of spreads. Equity watchers cite the bottom of earnings YoY trends and favorable outlook ahead for earnings growth.
For the HY energy sector names, oil has been well behaved so far in all the Mideast turmoil and even dropped into $70 handles and $74 WTI to end the recent week. OPEC differences on supply and production quotas had captured some more airtime this past two weeks even as fresh news came of more record US oil production and natural gas production.
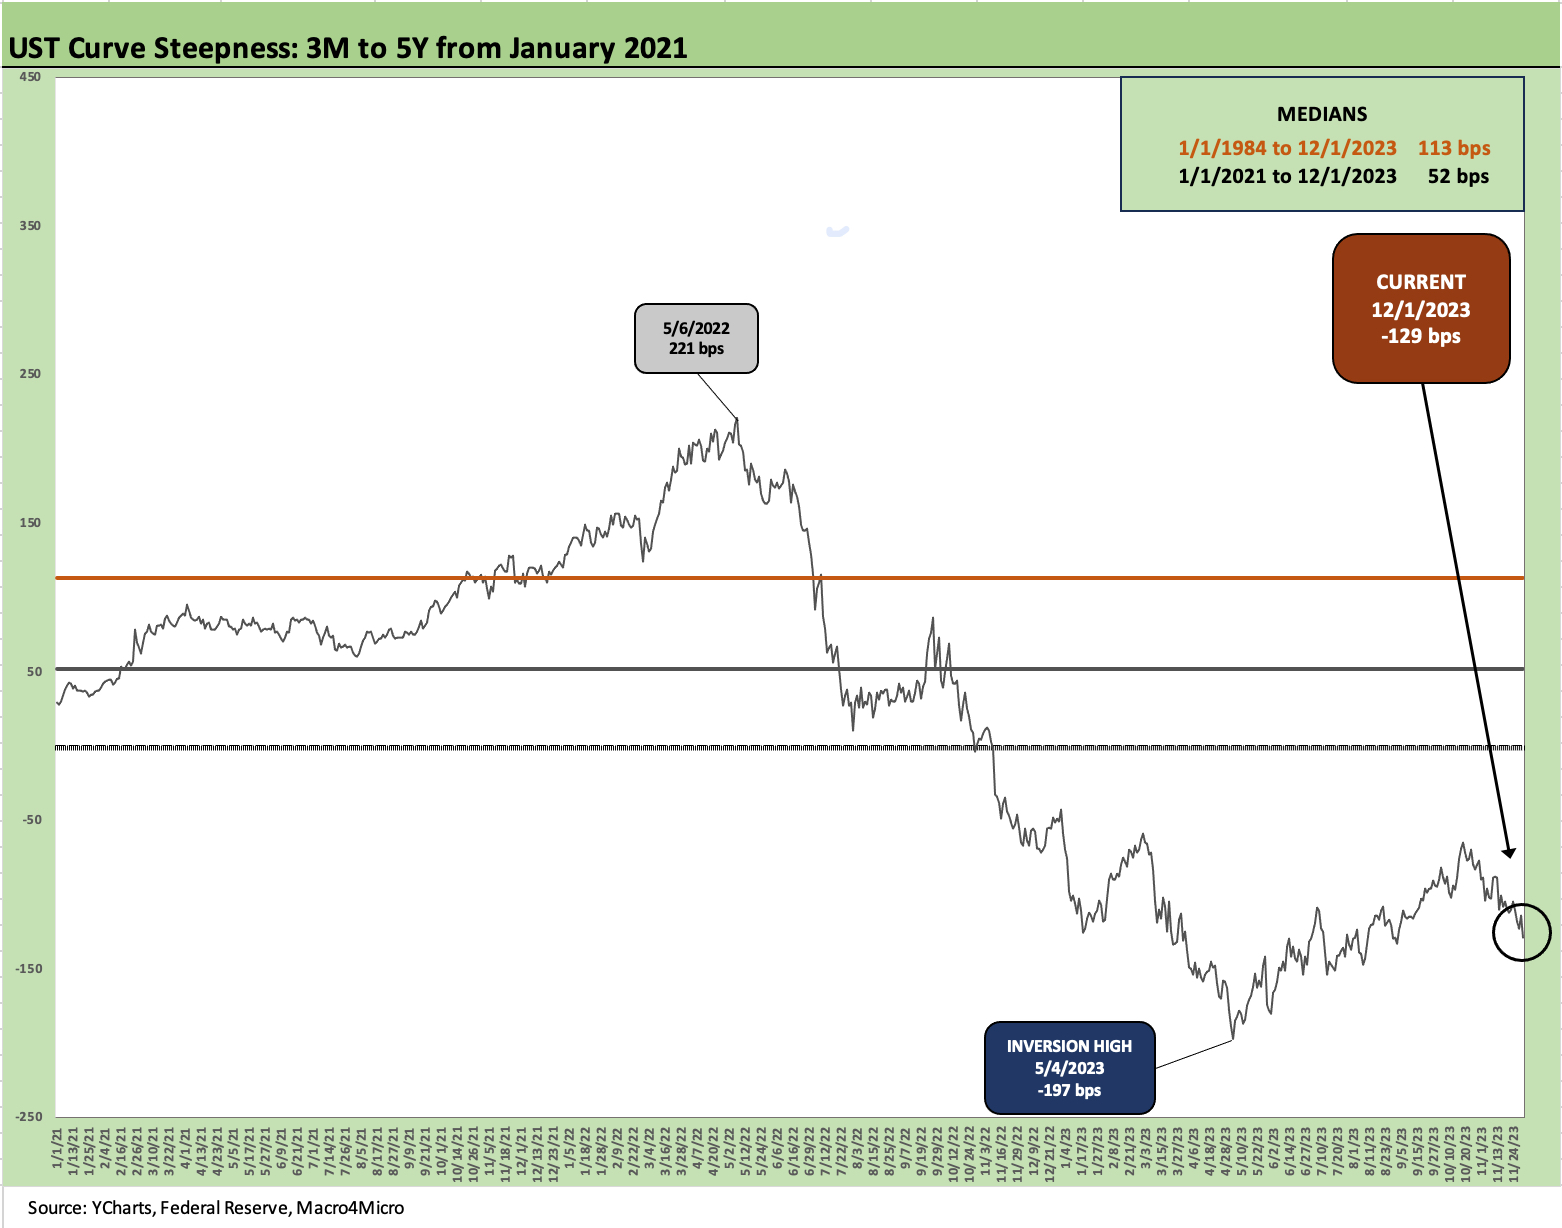
The above chart updates the 3M to 5Y UST inversion with some fresh rounds of increased inversion with the rally. The Fed controls the short end and the market controls what comes beyond. We see a 3M to 5Y inversion move back to -129 bps which is still well “above” the May 2023 peak inversion of -197 bps.
Those opting for heavy cash portfolio weighting at yields over 5% do not face the opportunity cost pain they had faced across the ZIRP years and brief normalization attempts from 2008 to early 2022. The median box offers a reminder of what the normal state of affairs looks like with a positive sloped long-term shape from 1984 and short term since early 2021.
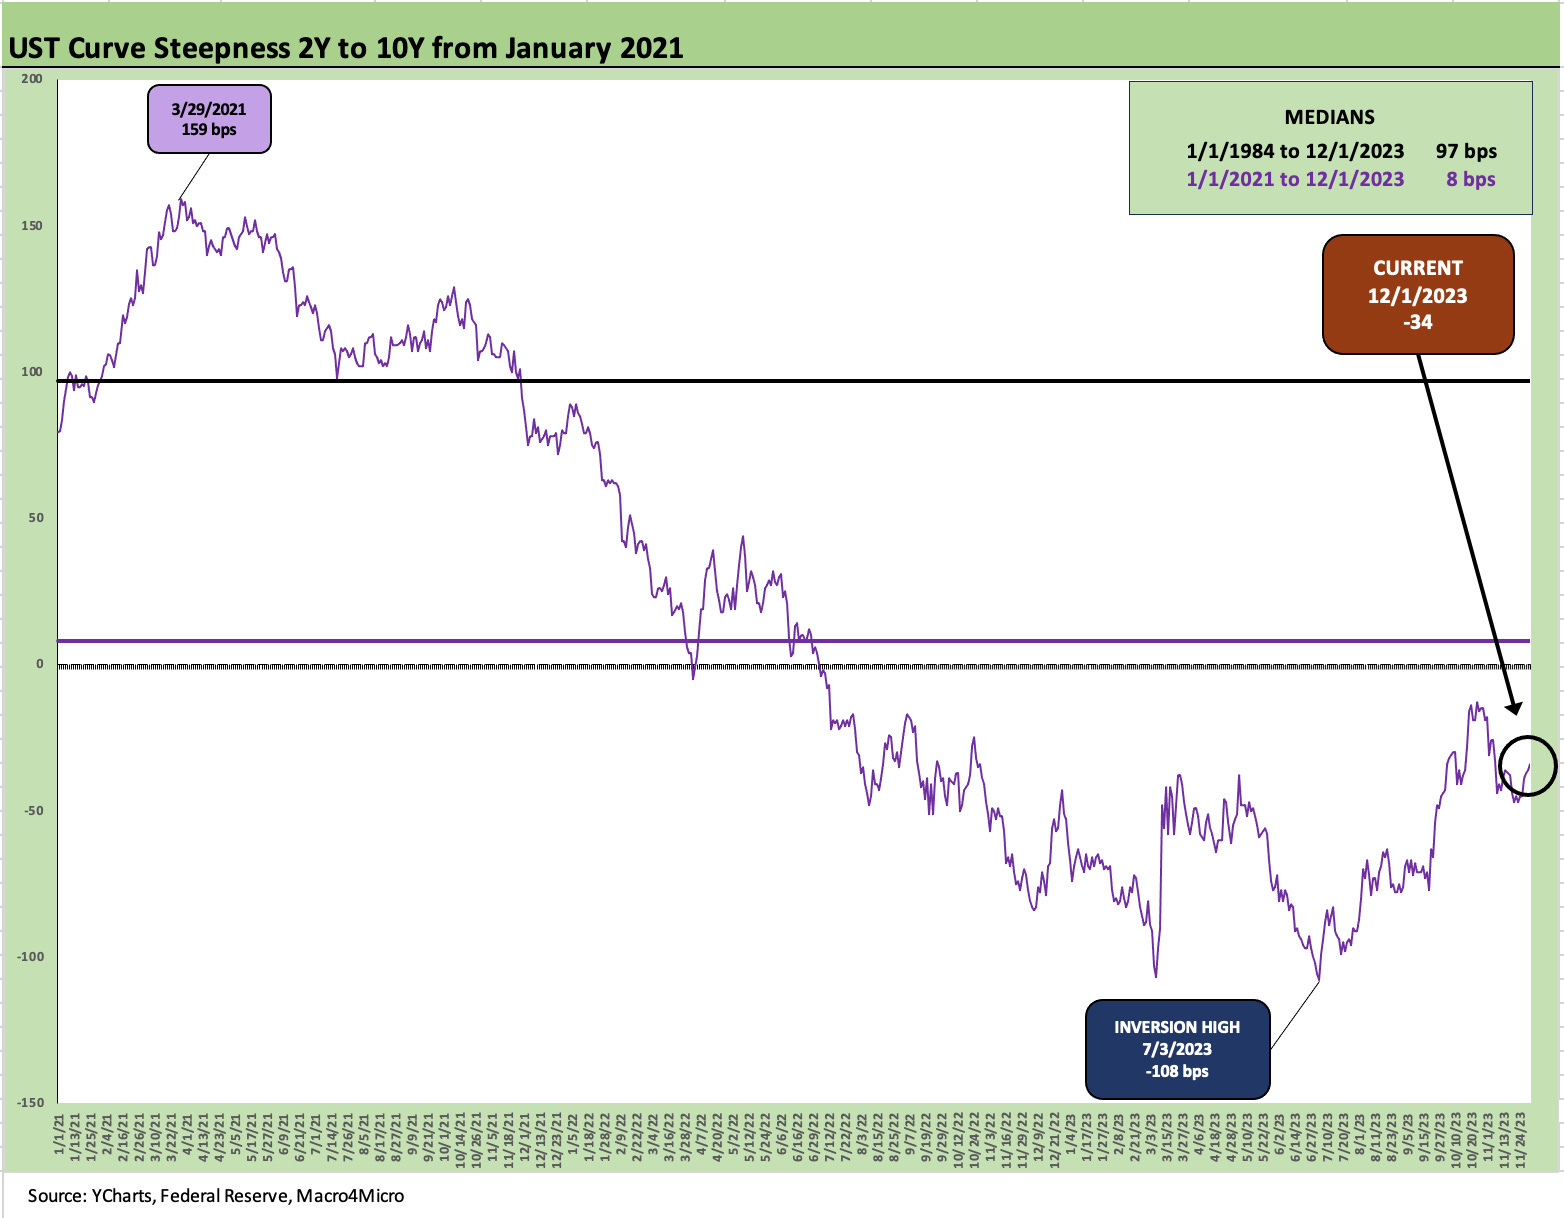
The above chart updates the 2Y to 10Y slope for the recent rally, and we see a -34 bps inversion that is still materially lower inversion than the -108 bps in July 2023. The big move lower in 2Y UST, detailed in the “Post-SVB” UST delta chart earlier in this piece, underscores the shapeshifting that is now giving more support to the curve costs for those in finance with a heavy mix of short duration liabilities.
For one example, we saw the Regional Bank ETF (KRE) for the past week and the past month soundly beating all the other 31 ETFs and benchmarks we look at in our asset return “Footnotes.” That could include some investors chasing the hope that interest margin relief will extend to the deposit base even more with a cut in fed funds offering additional support ahead. We are not embracing that scenario yet as it involves a lot of mission assumptions on what will make the Fed move earlier rather than later.

The above chart updates the 5Y to 30Y slope and its move back to upward sloping at +26 bps, which is above the post-2021 median of +20 bps presented in the box but still well short of +74 bps long term. The “steepening toward flattening” stage that unfolded along the way was painful for duration but there is now some normalcy out beyond 5 years as the UST shifts lower as detailed earlier in this commentary. At least for the past few weeks, it has come in the form of a bull steepener from 5Y to 30Y.
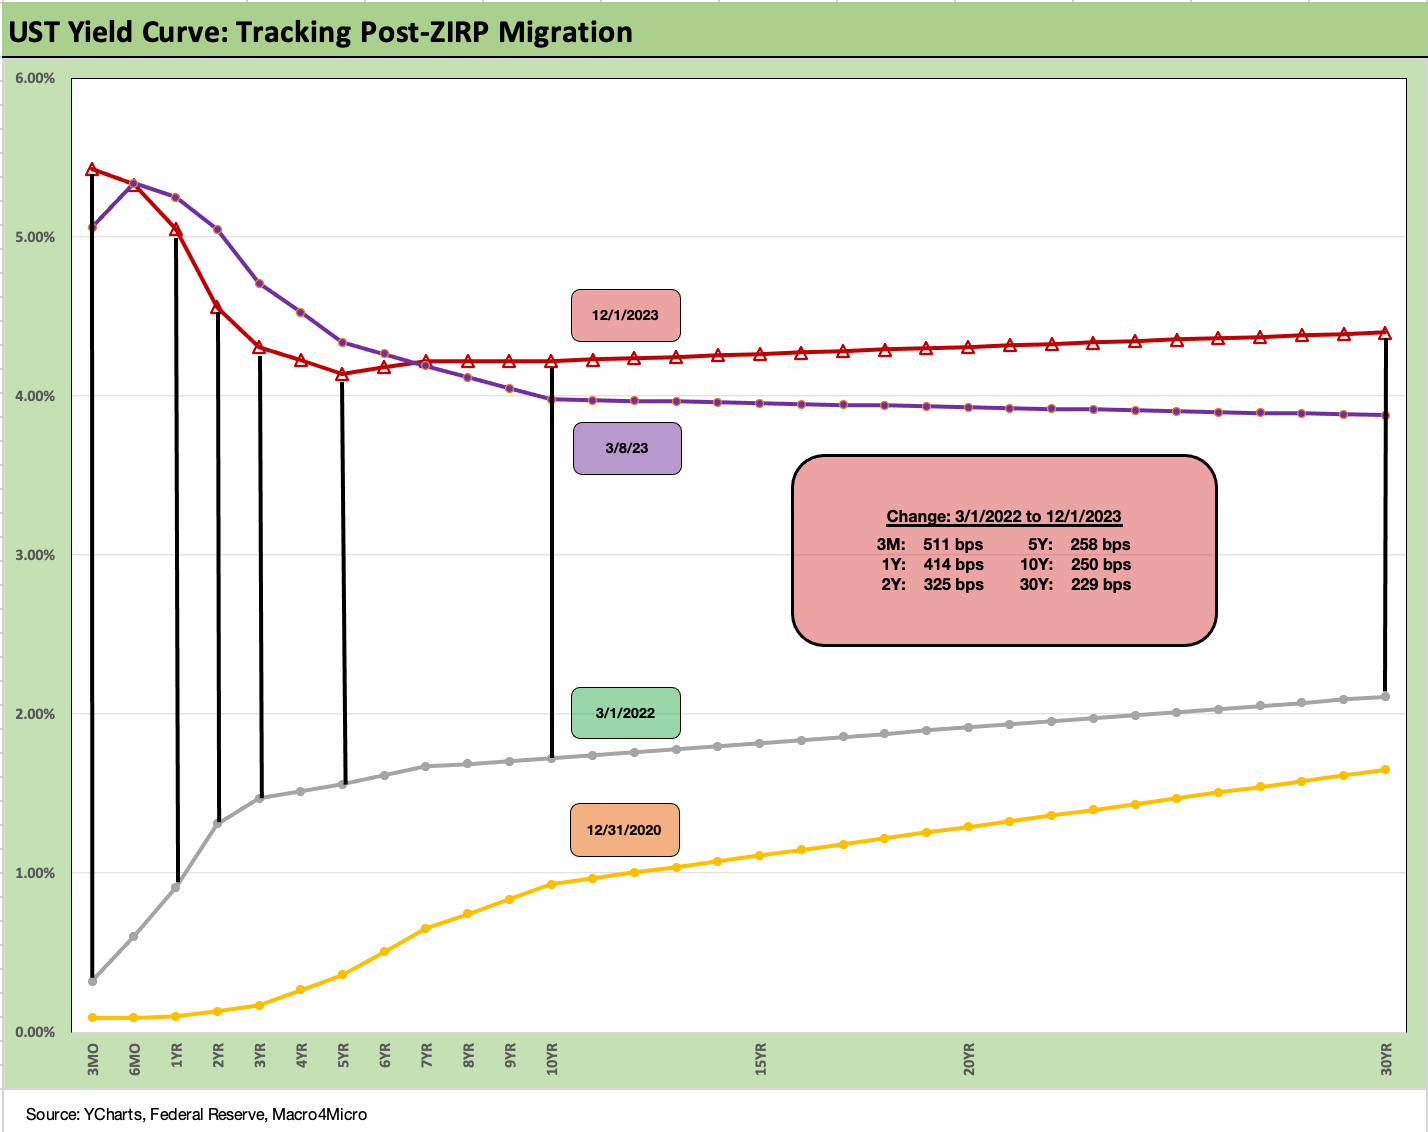
The above chart is our usual chart to wrap the State of Yields. We show the curve deltas from March 1, 2022 to start the month when ZIRP ended (mid-March). We also include a 12-31-20 UST curve as a frame of reference.
The numbers in the box capture the UST deltas and the numbers have really come down from what we posted up for the trading week ended Friday Oct 20, 2023 (see Footnotes & Flashbacks: State of Yields 10-21-23). The 2Y UST delta from 3-1-2022 noted above (+325 bps) is down from +376 bps at 10-20-23 or a decline of -51 bps in the post-ZIRP delta. For 5Y, the delta is -72 bps lower vs. 10-20-23, for 10Y UST -71 bps lower, and for 30Y -69 bps lower. That is a consistent downshift across the curve over a 6-week time horizon.
Summary…
The UST and market moves have been very volatile but have been to the bullish side since late October, and that could continue as the year winds down subject to the employment numbers, the next CPI numbers, and the coming dot plot and the post-FOMC meeting public commentary. Those releases are not small events and could change inputs quickly.
The world also keeps getting more unpredictable with the war back on in Gaza with the Israel-Hamas clash likely to further inflame geopolitical tension as it goes on. OPEC+ was still putting its production cuts in order as the week wound down but oil still ticked lower on the week and hit a $74 handle on Friday.
Looking back at the Yom Kippur War days and ensuing Arab Oil Embargo is not quite as relevant of a threat with the US hitting record oil and gas production yet again (Source: EIA). Record volume of projected LNG exports also take the edge off the threat. That said, any threat of return to $90 oil would upset the CPI expectations and consumer story. Predicting oil prices is the proverbial mug’s game based on history, but its importance in the inflation picture is a constant (see Inflation Timelines: Cyclical Histories, Key CPI Buckets 11-20-23).
Political noise as always…
We would expect the coming government shutdown risk falls into the category of “cross that bridge when we come to it” in the new year. The domestic political environment used to be easy to tune out when there was a mixed control in Washington with the idea being no one could do that much damage and better policy comes out of the checks and balances (Think of the Reagan and Clinton market booms). That theory has been shredded by the new breed of crazies in the House.
The weeks will only get stranger in the political realm as we wade into 2024. Whether Trump trials get delayed or stay on schedule (doubtful) is an X-factor that the market will not handicap in pricing until we get there. This weekend we were subjected to recaps of Trump losing his first round of legal challenges calling the President immune from legal or criminal accountability as a President and any time after his term. He also lost his appeal this past week over whether he is liable for civil cases against him and his actions outside his Presidential official duties on Jan 6. Life was so much simpler (and less threatening) when it was “left vs. right” with the middle determining what was rational.
The replays on cable were from Trump’s past Presidential podium statements include “the President can do whatever he wants” etc., etc., etc., (think Yul Brynner as the King of Siam).

It gets weirder by the day and will not stop. The themes can be taken to an extreme for Presidential immunity and unrestricted action. Trump should hope Biden does not believe him (Executive order for the military to seize and destroy all orange face makeup and manly hair spray?). The good news is most people are sane. In theory.
From my own standpoint, if I got stuck with a dictator, I was hoping it would be one who had a basic understanding of economics and one where we could find his fingerprints on a book and not just the TV controls (and a Big Mac box). Concepts count. Facts count. Or do they?
Political economy notes…
The statements of late that Trump wants to kill off the Affordable Care Act again (he must really hate Obama more than even McCain of “thumb down” fame) is a clear threat to household financial health, but that is a long way off to consider as a variable. Health care is 18% of GDP. There was no replace in the “repeal and replace” stories, but DeSantis came out with his “replace” plan story today (to be unveiled this spring) that would include protections for preexisting conditions. The latter was anathema to the right, so that was a headline surprise.
Meanwhile, Trump’s threat to slap punitive 10% tariffs on all imports brings up the threat of a fresh round of retaliation against the ag sector and in turn bailout costs for relief. Tariffs also are intrinsically inflationary even if Trump fails to admit that the buyer pays (he still falsely claims that he collected billions and billions from China.).
The problem with tariffs is that Biden in substance continued them and ardent pro-union Progressives tend to love them (Bernie Sanders et al). That is a double-edged sword of making construction and capex planning safer on policy predictability by promoting US investment. You don’t have to worry about a reversal of protectionism since the Trump and Democrats seem to be on the same page on that one issue. But tariffs, in the end, threaten price stability and/or corporate profits.
These are variables the market is not inclined to pay attention to until after it happens. This is, after all, Washington. In full year forecasts ahead, it will be interesting to see how analysts will discount in the moving parts of what might come in 2025 with the debt ceiling at the top of the list. Those issues can wait but asset allocation is usually a multiyear planning exercise.