
October New Home Sales: Low Bar to Clear
We look at lower New Home Sales after a substantial downward revision for Sept and a shift to lower price tiers.


The October 2023 new home sales easily cleared the YoY bar as the builders keep selling at a slow and steady rate and look to work down their inventory levels and watch their starts pace.
The sequential weakness from Sept is not a major factor for builder business risk with the demonstrated ability of the builders to effectively manage their working capital.
As they enter the offseason, most builders have been using a heavier spec game plan than usual given the state of this mortgage rate cycle as completed homes for sale in inventory remain high with a still-heavy backlog both under construction and under contract.
Oct 2023 showed a mix shift YoY into lower price tiers and sequentially lower sales in the West.

In this note, we update the monthly new home sales numbers from the Census (a day late, but we got sidetracked). Last month a big bounce was reported at the time at 759K (see Sept New Home Sales: The Need to Live Somewhere 10-25-23), but we just saw a material downward revision of that number to 719K. The sequential decline this month even from lower revised numbers for September is set against a material YoY increase. We see a -5.6% decline sequentially in the headline numbers with +17.7% YoY.
The mix of revisions and numbers is not ringing any bells or alarms here, and the builders are still well positioned to sustain the strategies that have helped them pick up market share of total home sales (existing + new) in 2023. The wildcard will remain how the builders can reach into their toolbox to design incentives (notably mortgage buydowns) with the 7% handle still ruling monthly mortgage payments and the ability of the market to see total inventory for sale loosened.
New home sales is the third of the main monthly releases for housing after new residential construction (see Housing Starts Oct 2023: Back in the Game Coach? 11-17-23) and existing home sales (see October Existing Home Sales: Searching for Lows 11-21-23). The main value of the new home sales release to us besides the updated estimates on new home sales in total and by region is that you get a sense of the status of what is under construction vs. completed inventory and can frame the relative mix of sales by price tier.
The most granular view of volumes and average selling prices come with builders’ earnings reports, and the range of fiscal years of the major builders (Sept, Oct, Nov, Dec) offer steady streams of data points. We recently updated the state of affairs at Lennar (see Credit Crib Note: Lennar 11-22-23) as the #2 builder and Pulte as the #3 builder (see Credit Crib Note: PulteGroup 11-15-23, Pulte: Relative Value Meets “Old School” Coupons 11-15-23). With its 10-31-23 fiscal year, Toll Brothers at #4 (based on sales) will be releasing 4Q23 earnings soon (Dec 6).

The above chart updates the market share increases homebuilders have seen this year with new home sales at 17.9% of total home sales. The share grab comes as existing home sales still sputter at 2010 levels and at credit crisis period lows for all the reasons we lay out each month. The mortgage rates will need to come down quite a bit to shake loose more inventory from the existing home base.

The above chart updates the median price trends, and again we wave the caveat flag of such prices being a function of mix and region. Oct 2023 saw a big sequential decline in the West on a SAAR basis and a material increase in the price distribution in the $300K to $399.9K bucket. The new home sales report shows a big YoY decline in the share of “$750K and over” and an even bigger share drop in the $500K to $749K tier.
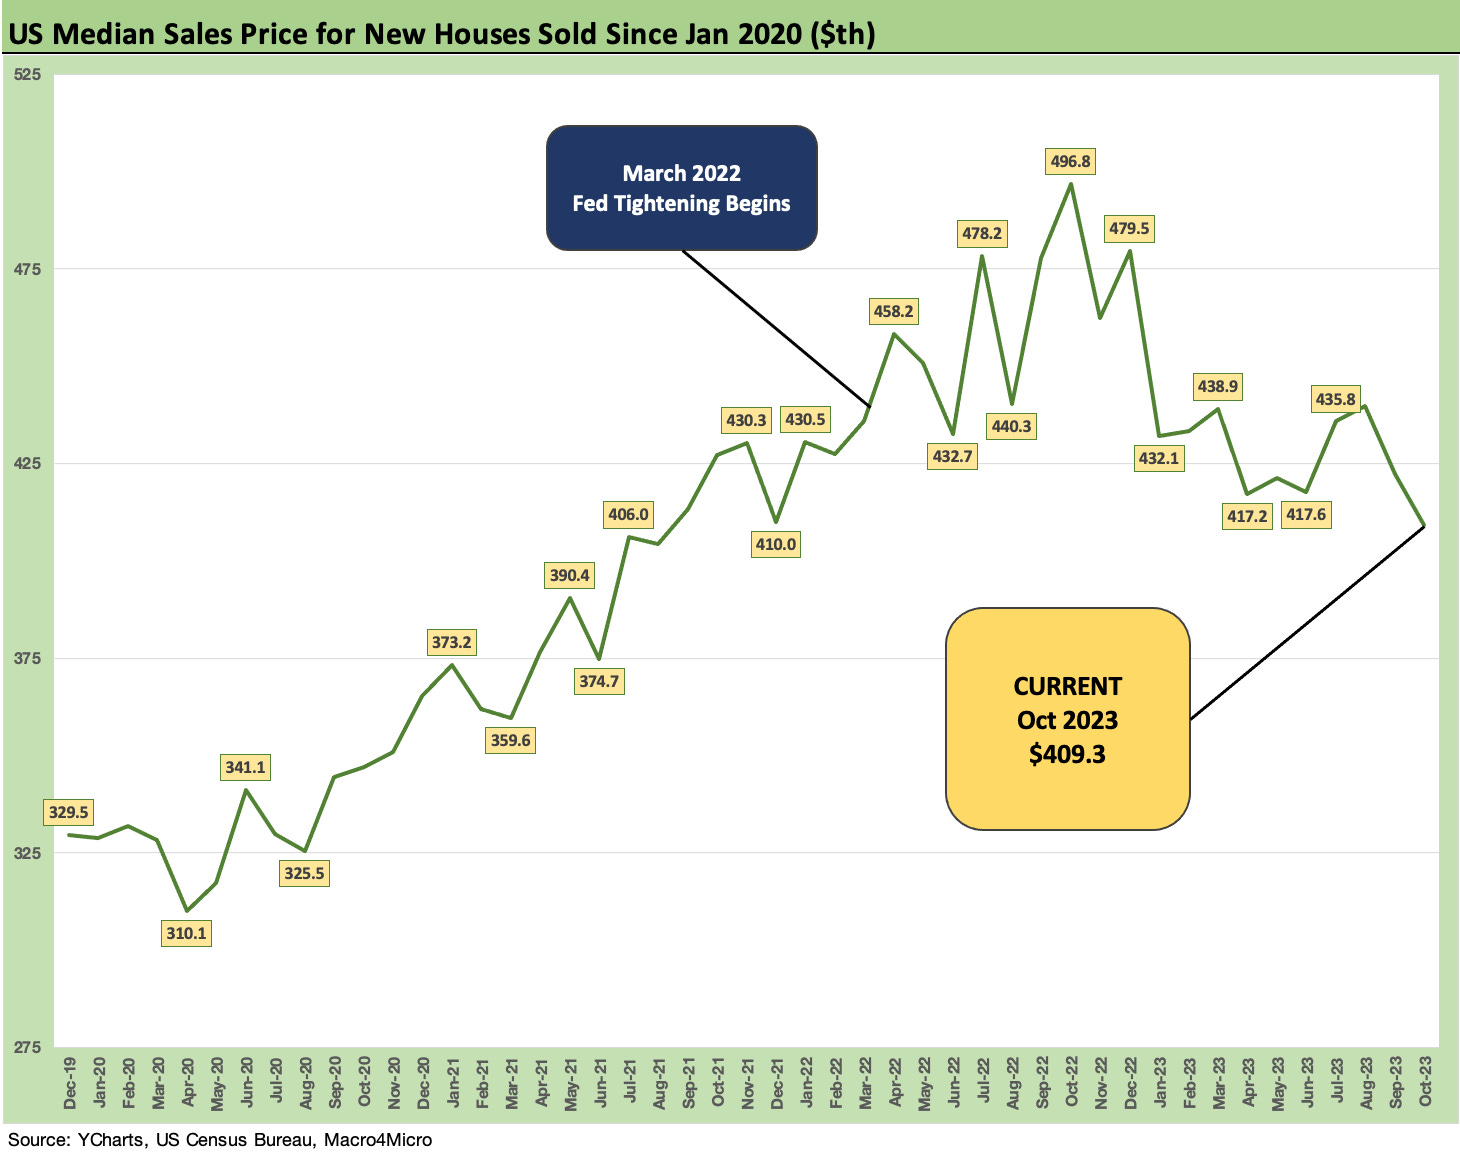
The above chart updates the median price timeline from Dec 2019 to underscore how the mix can really swing around. The time series is also a reminder of how far prices have run since 2019 ahead of COVID.
The weaker sales numbers overall are consistent with mortgage trends and discipline of the builders in managing inventory. The spec build rates could slow down subject to where the UST curve trends. For the builder narrowly, inventory liquidation drives cash flow in the funds flow statement but would start to take a toll on revenue and earnings guidance. The consensus is calling for lower mortgage rates but that is by no means a certainty.
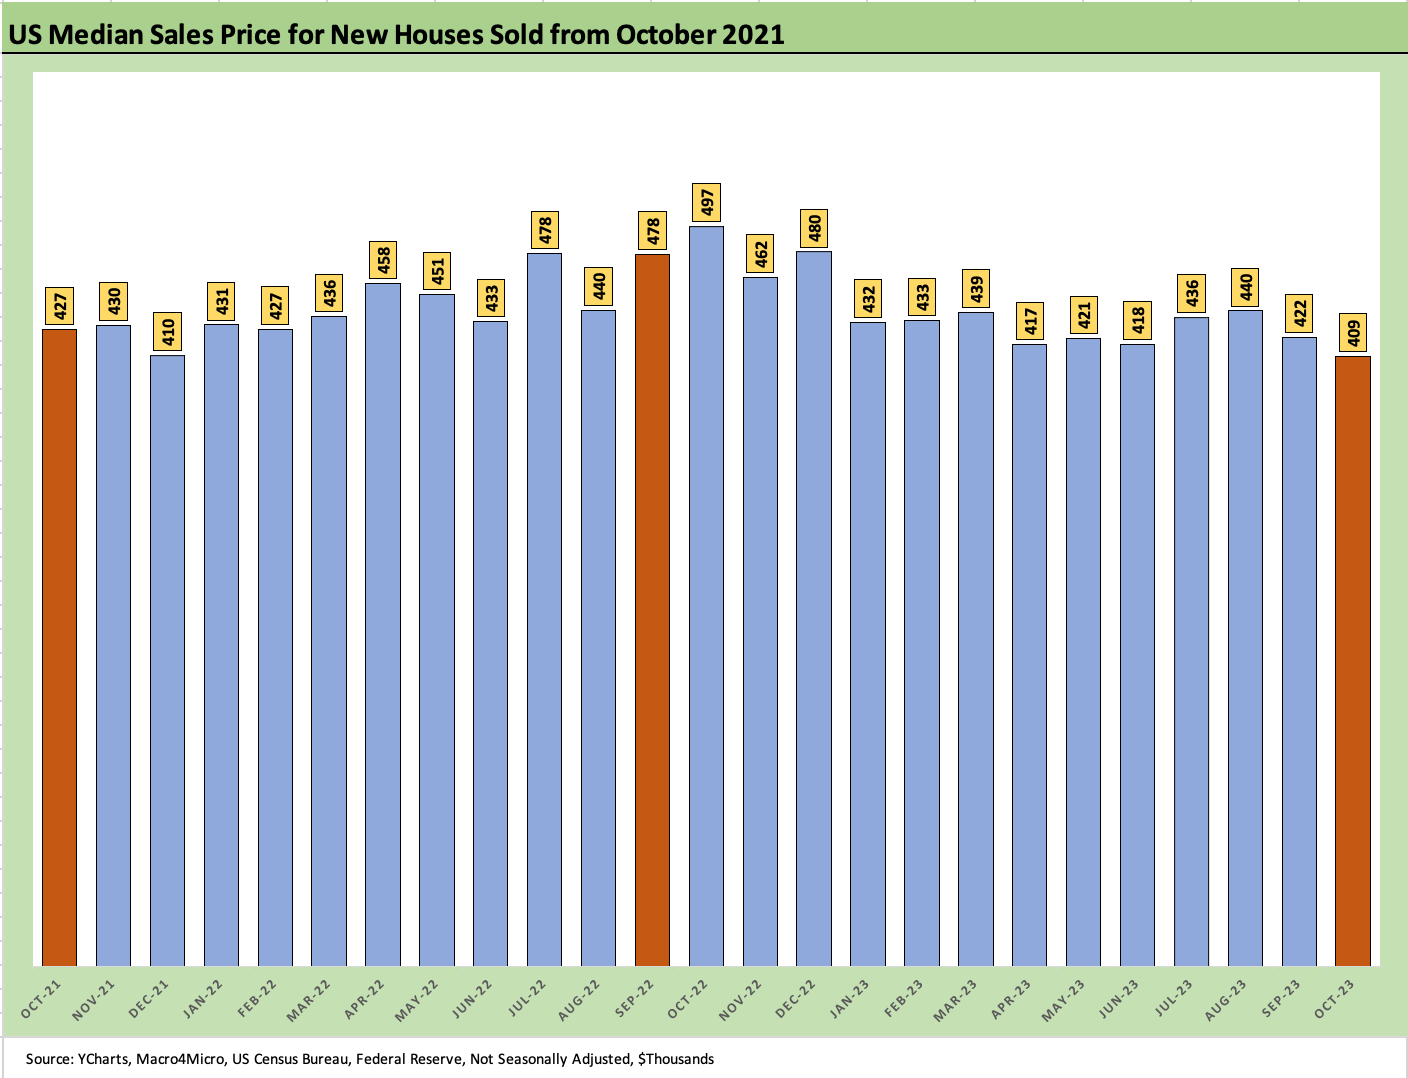
The above chart breaks out the monthly sales medians from a different angle with the monthly medians from Oct 2021 when ZIRP ruled and the curve was steep—but much lower. The stats have the revisions rolled in. This month’s median was the lowest in the time series with Dec 2021 at $410. The mix factor is a major driver of these trends but considering where monthly payments have gone since 2021, the home equity stability trends constitute good news for homeowners broadly.