
PCE Prices, Consumption, Savings: Good News is Less News
We look at a net positive month in PCE prices, disposable income, and consumption to add to the "happy pile."


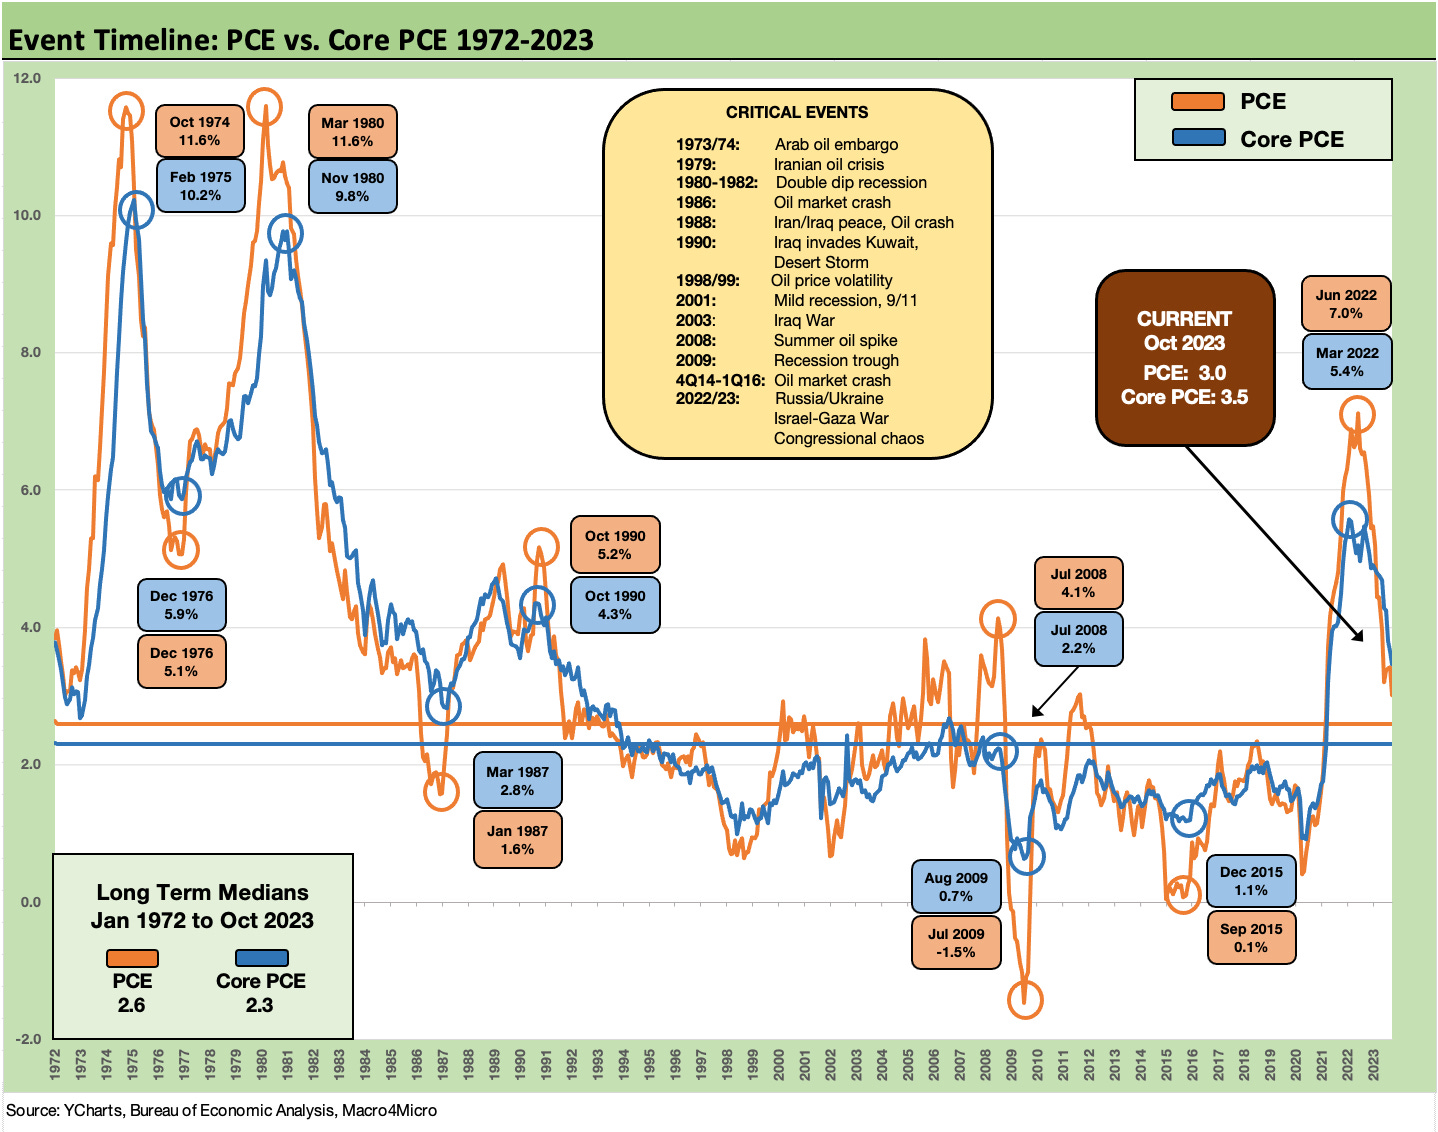
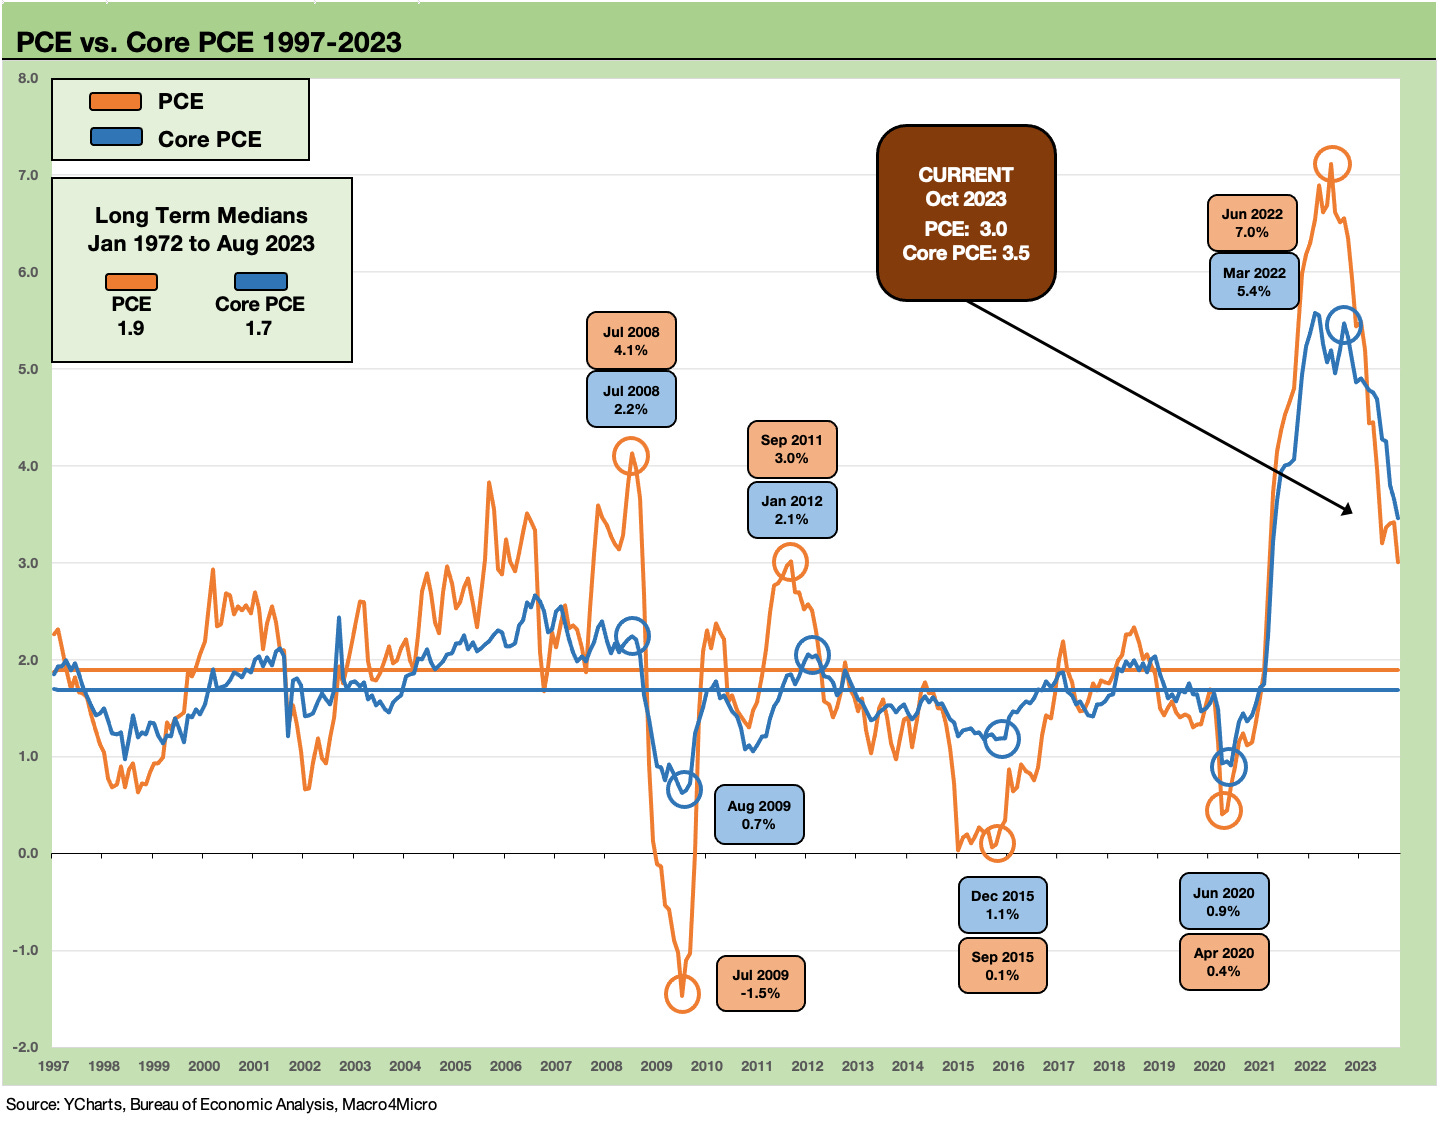
The favorable inflation story line gets a boost with the YoY PCE and Core PCE price indexes lower and the headline PCE prices even rounding to a 0% sequential monthly change and PCE Core down to 0.2% for the month of Oct 2023 from 0.3% in Sept 2023.
Consumption moderated at 0.2% sequentially from 0.7% with income still positive at 0.3% and saving rates slightly higher, so that adds some stabilizing inputs on household health (consumer credit excess, etc.) and eases some of the demand themes for inflation with the trend line for Goods inflation lower and Services mixed.
Disposable income was at +3.9% YoY, up sequentially but down from the 4% and 5% handles seen from March to July, so the wage inflation angle is somewhat more supportive.
The moderation in PCE is good news for inflation watchers while the consumption and income data can be used differently by market bulls and bears. Market bulls in equity can cite relief on the UST curve threat (though the UST supply watchers would have something to say about that). Those bearish on the economic cycle can debate the easing of PCE trends and where that could head from here. The fundamental bears will spin it as “The credit cards are getting yanked! Let the consumer credit defaults begin!”
The truth usually lies in the middle and consumer credit cycles are not new. Delinquencies and defaults will rise at the margins. We would argue that the 3% mortgage rates locked in are an important distinguishing factor in this cycle as a boost to household cash flow while healthy home equity values don’t hurt. We also can point at record payroll (total bodies employed) offering a good starting point, which leaves a lot of room to maneuver as layoffs will eventually kick in on a broader scale.
The positive PCE lines we look at below and saw in the GDP release for 3Q23 are the best recession counterpoint one can have when PCE is over 2/3 of GDP. The fixed investment and government lines are the other big pieces of GDP that are similar in size, and we just got served a fresh dose of those numbers and revisions with yesterday’s second round of 3Q23 GDP estimates (see 3Q23 GDP: Fab Five 11-29-23). That release showed private sector capex and government investment programs rolling along at a high clip (even if you object to policies, growth is a measurable fact).
Overall, the inflation trend lines continue to move in the right direction. We see headline CPI on the long-term median (3.2%) with core inflation still a longer walk from the long term median at +4.0% vs. the post-1972 median of +2.9% (see Inflation Timelines: Cyclical Histories, Key CPI Buckets 11-20-23).
As we covered in that inflation timeline commentary in the prior link, the Shelter component in Services is the single largest debatable factor in CPI Core in terms of the weighting and the highly questionable economic relevance of Owners’ Equivalent Rent.
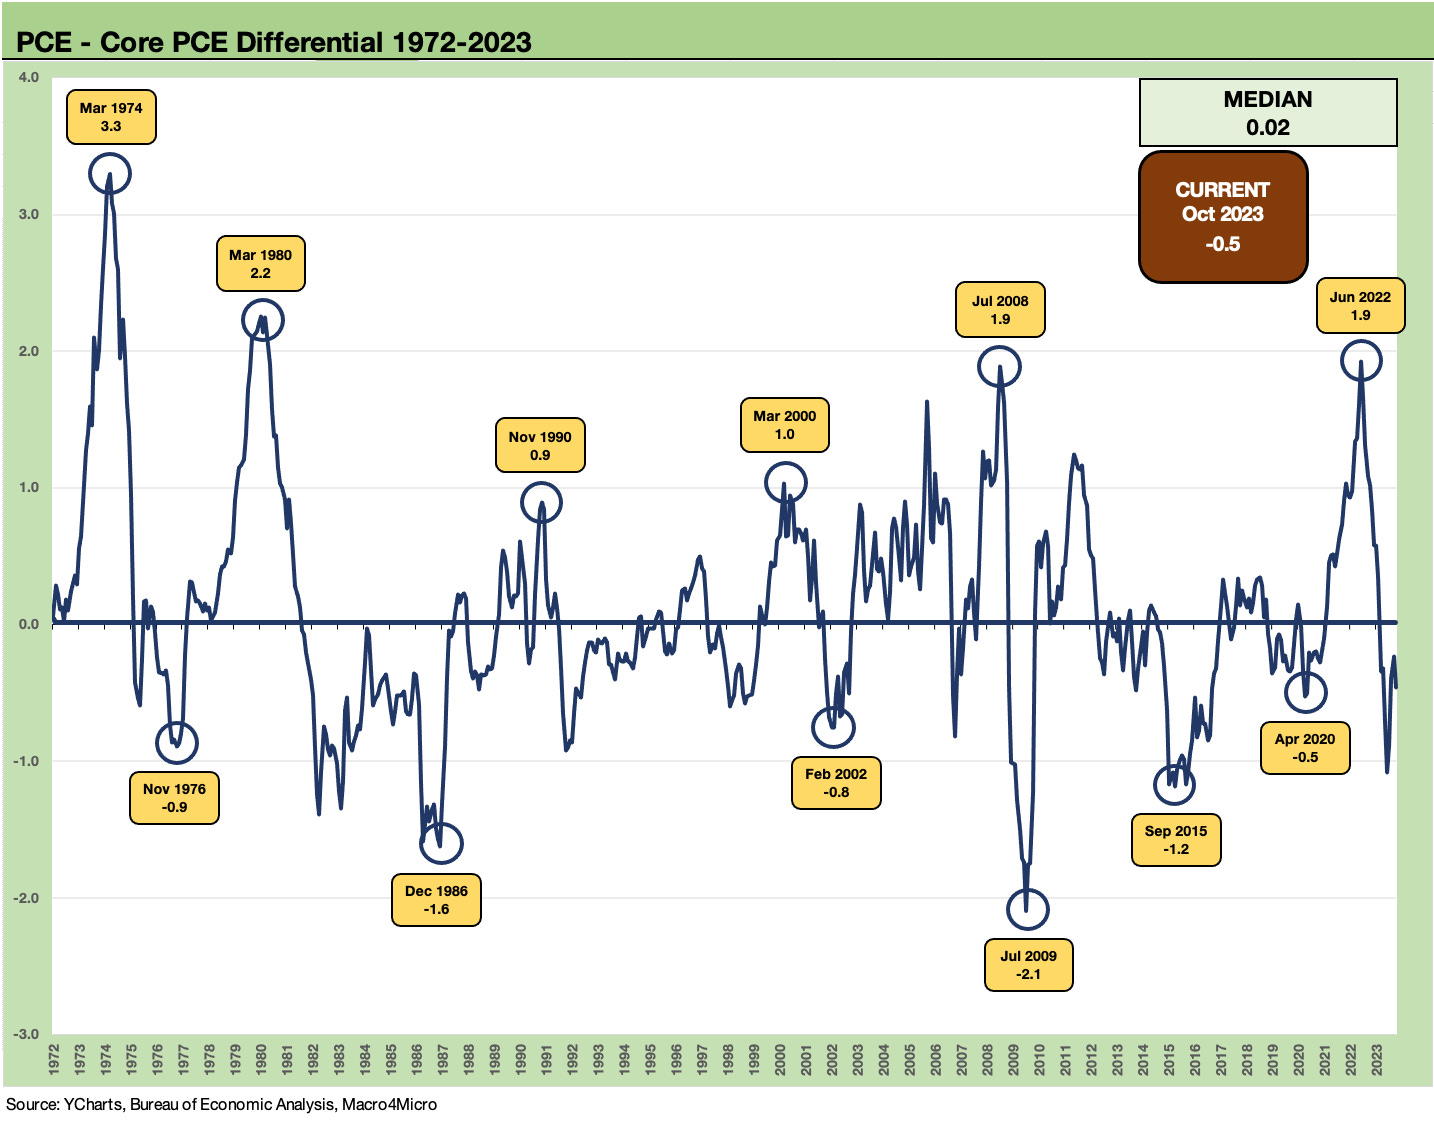
The above chart breaks out the differentials between the Headline PCE vs. Core PCE prices index across time. The differential offers a data point as Food and Energy whip around (especially energy) across the years. The good news in energy and refined petroleum product prices and natural gas costs is helpful to household discretionary cash flow. With winter coming on, that trend matters for peak heating season. A mood swing by the Saudis or a misstep by Iran could change that, but the geopolitical threat to oil has been a relief for many with the Mideast blowing up right now. Where the post-truce actions trend from here is no small risk factor.
The success so far in inflation declines as evident in PCE does not put the Goods in “Aisle 3” back to the pre-inflation price menu, and there is no changing the fact that purchasing power has clearly diminished in the post-COVID cycle. That gets into the political debate of who pays a price for that reality, but today’s PCE news consists of more economic good news overall when rolling in the bigger picture of market factors as well.
Income and consumption remain constructive overall…
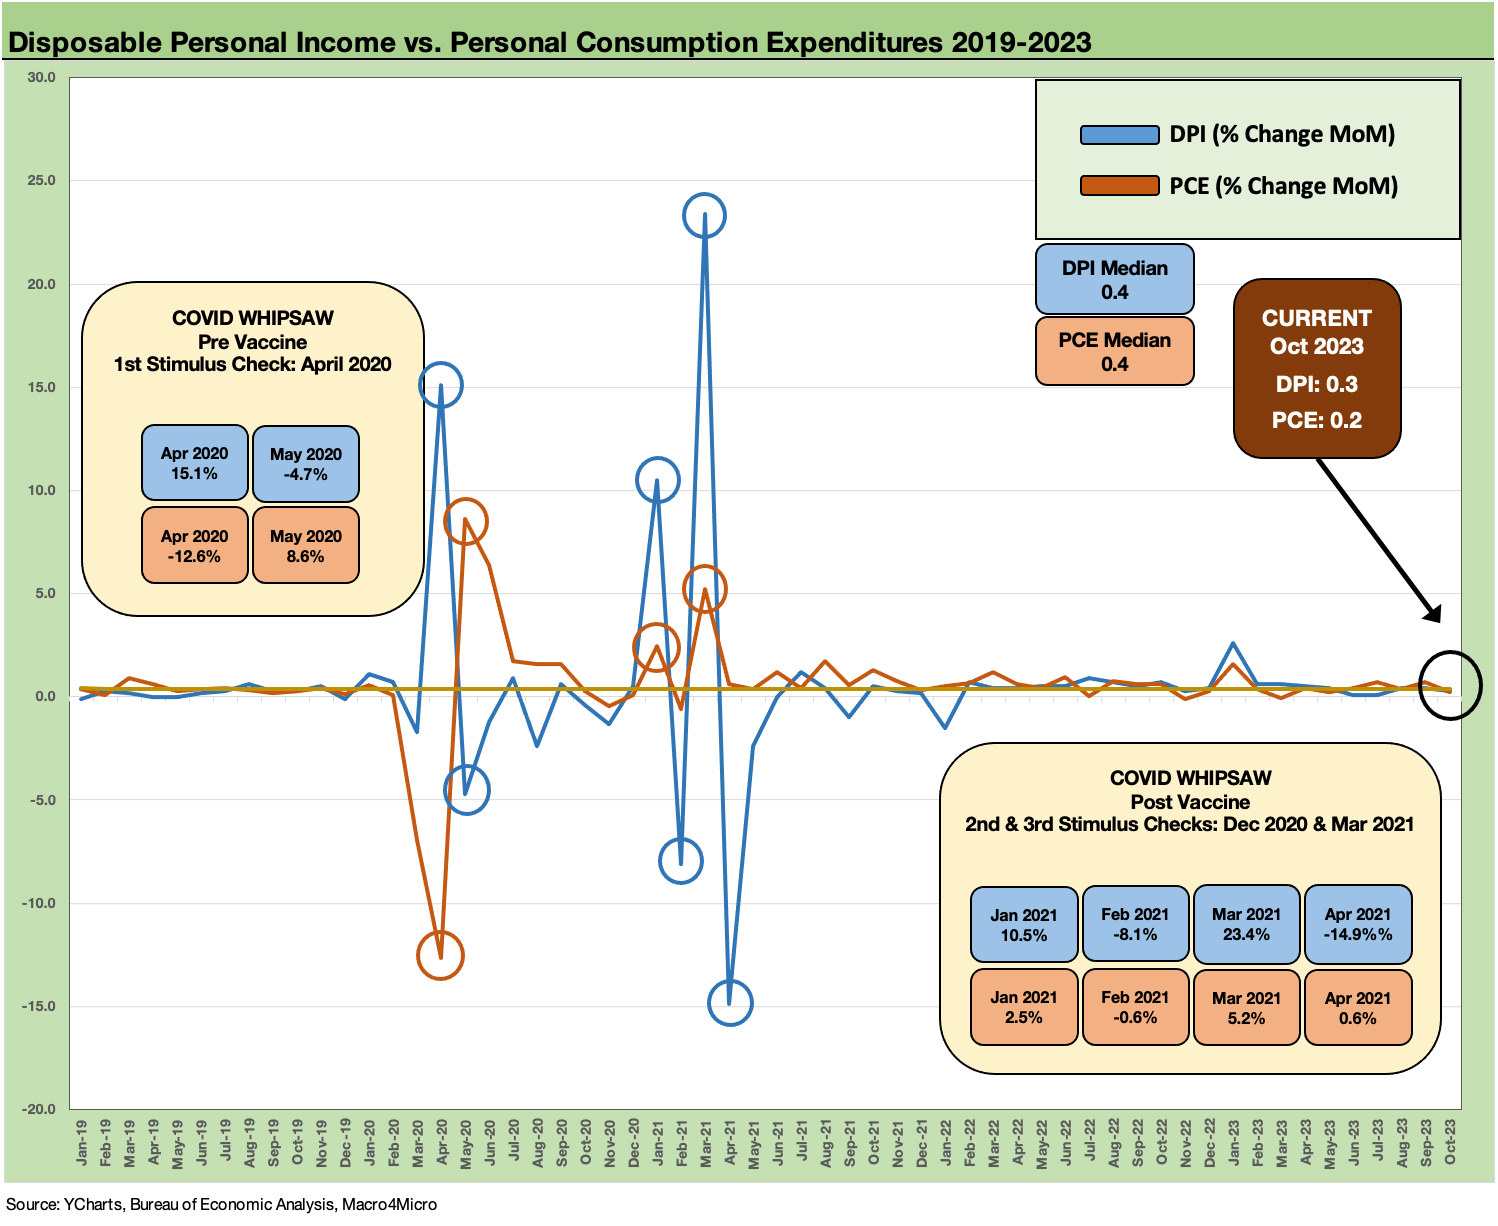
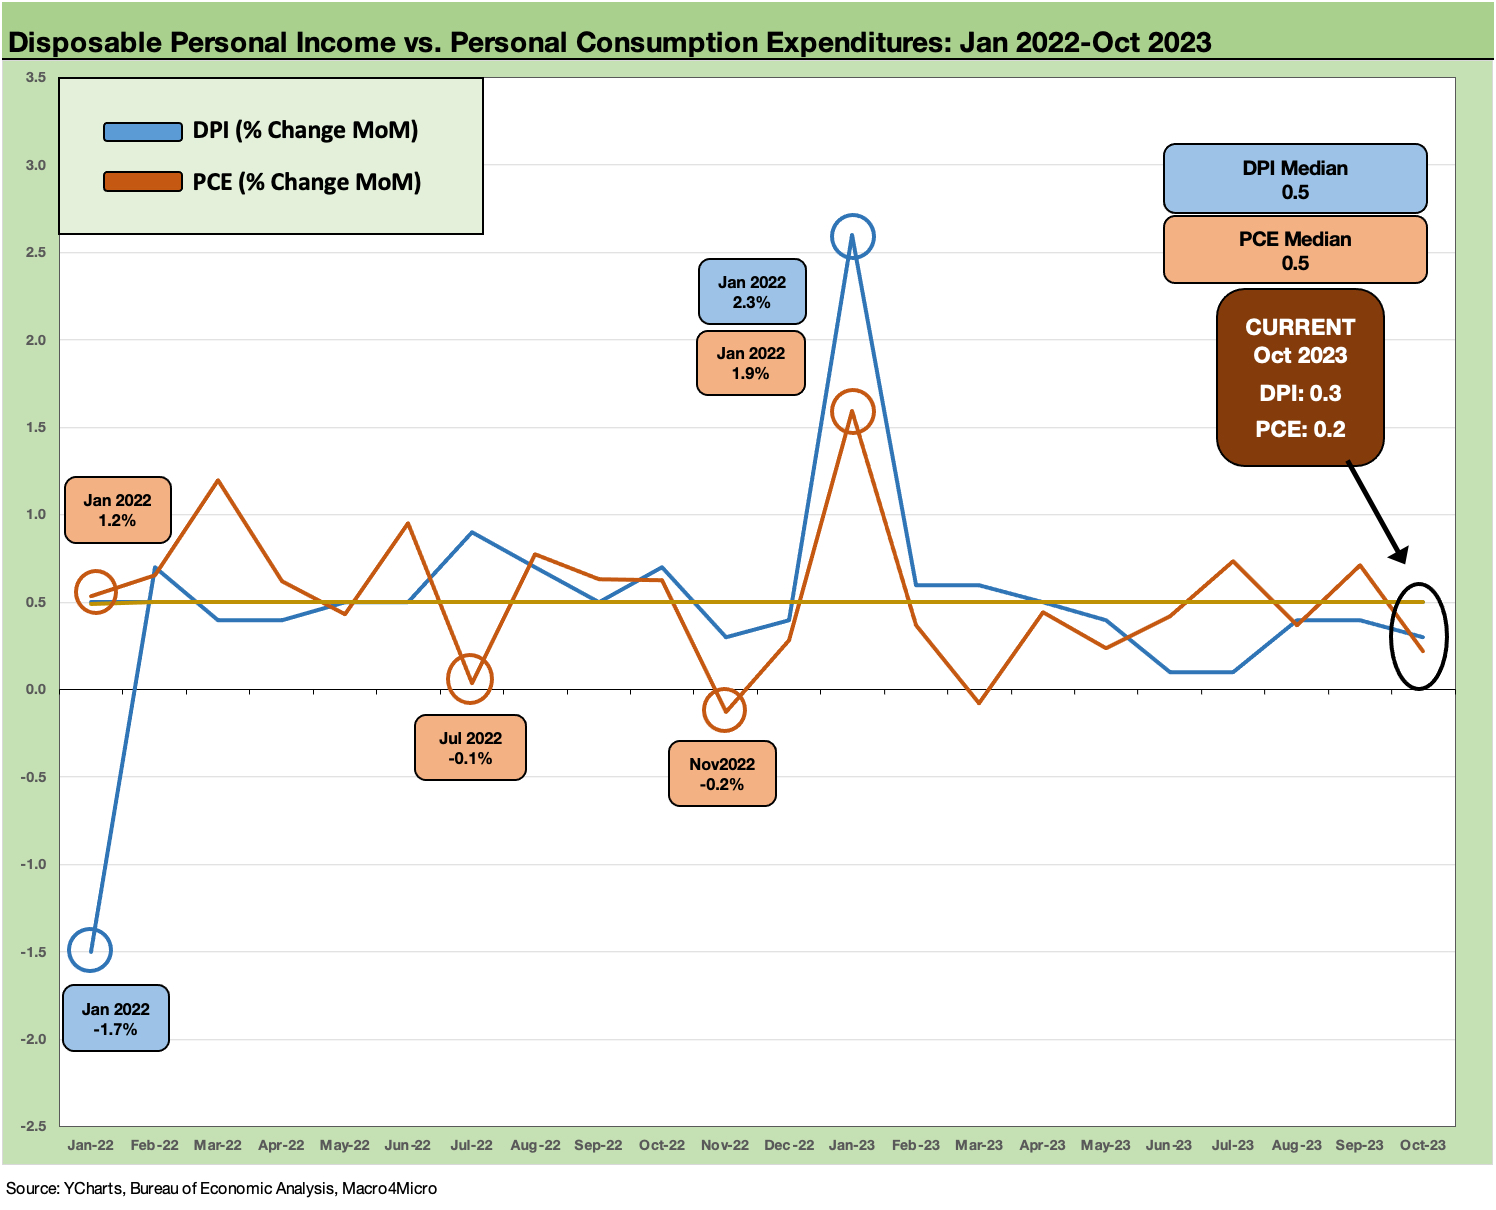
Below we break out the monthly trend line in Disposable Personal Income (DPI) vs. Personal Consumption Expenditures (PCE) from 2019 before COVID and then across the Washington stimulus responses. We don’t want to replay our views on that since we covered it earlier (see Inflation Rorschach Test: Looking at Relief and Stimulus 2-7-23). We tend to highlight that the facts don’t always match up well with political theme spinning.
The consumption picture is mixed in the sense it is lower, but moderation in the consumer sector is high on the list for those fixating on the UST curve these days (which seems to be most everyone in the debt and equity markets and corner offices). The tiny sequential savings rate increase still does not change the fact that it is very low. We looked at those issues after the Sept 2023 PCE release (see Savings Rates: Context Across the Cycles 10-27-23). The long-term post-1972 median for the savings rate is +7.0% vs. the Oct 2023 rate of 3.8%.
The above chart locks in more on the period just before the tightening cycle to get a better visual on the DPI vs. PCE trends during the UST curve migration. The timeline median of DPI and PCE during that period as detailed in the box is in a dead heat.
Savings rates remain quite low in historical context…
The next two charts plot the timeline for savings rates. In the first chart we remove the COVID impact from the visual (it remains in the median math) for a better sense of movements outside the COVID lockdowns and massive job swings.
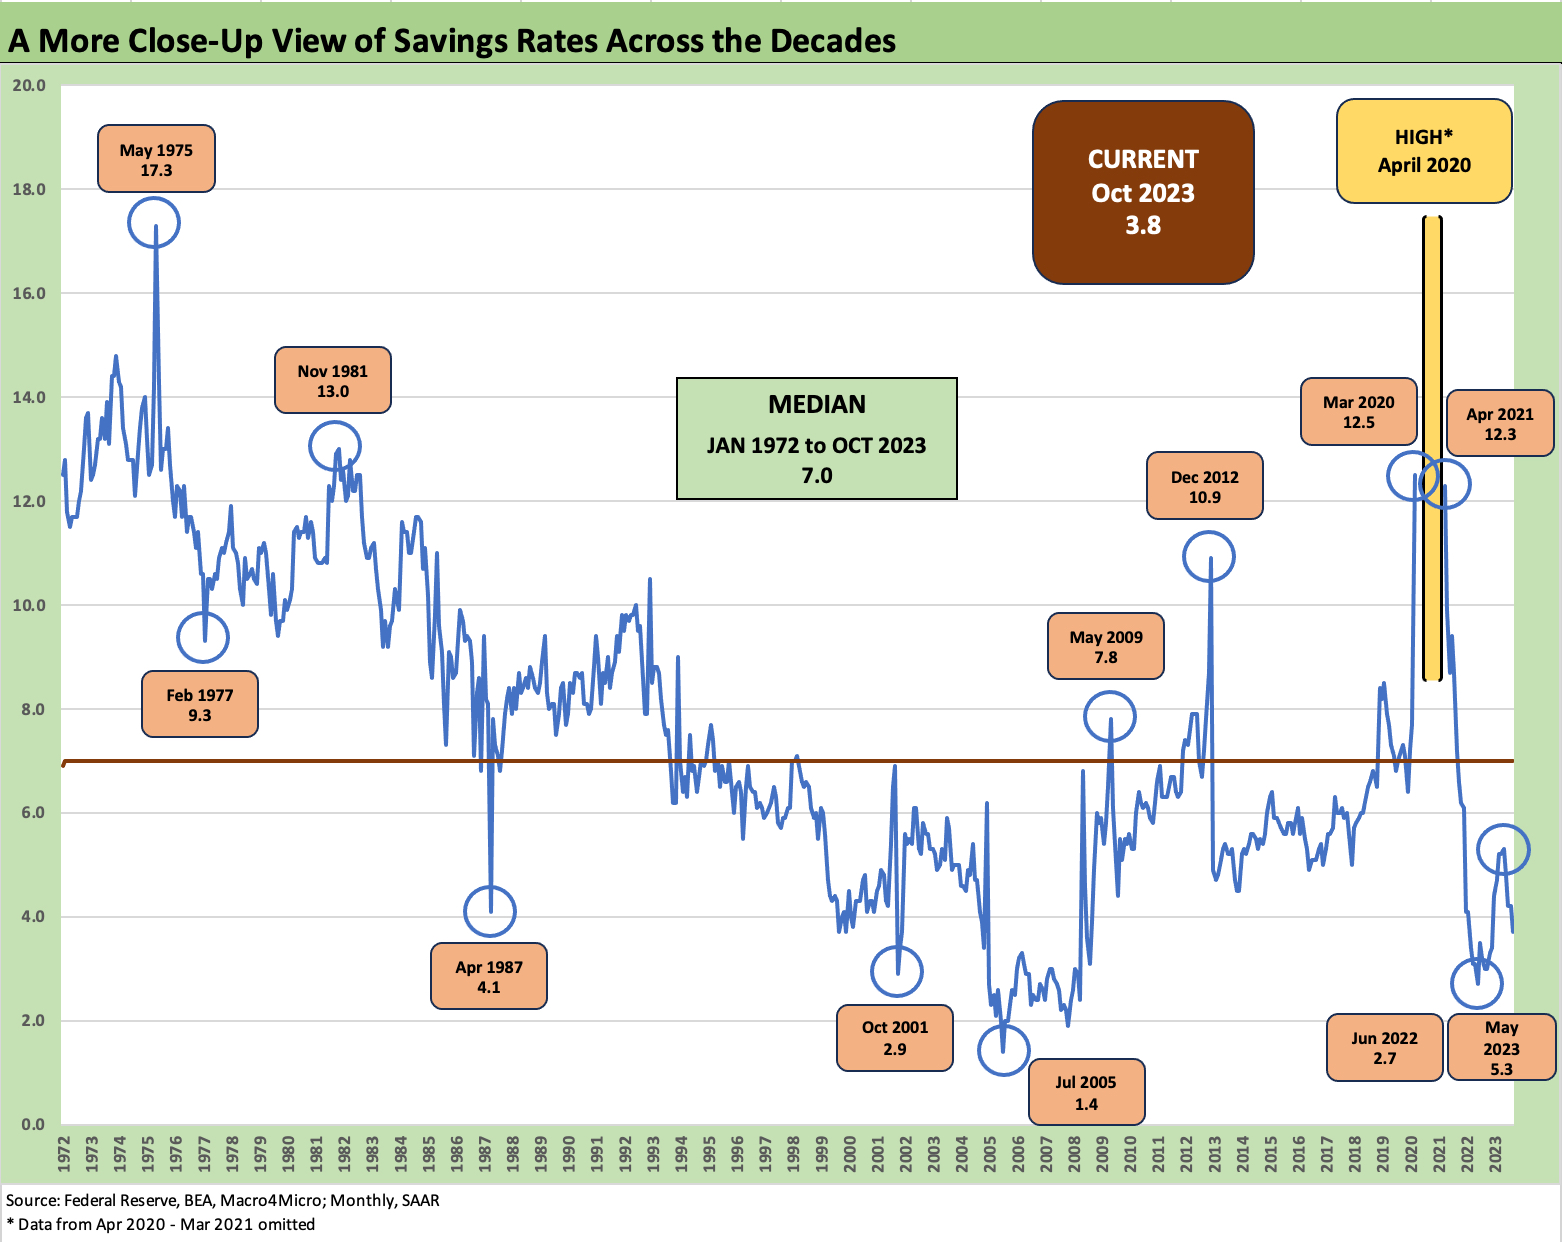
The Sept 2023 savings rate was revised higher with this month’s release to 3.7% from the initial 3.4% reported then, so it still increased slightly this month. The 3.8% is still below the 4% and 5% monthly levels from March to August. The “consumer’s party will be over soon” theme still has legs. That is of course true in every economic cycle, but we note that moderation is not wholesale collapse or even contraction (negative PCE in the GDP accounts).
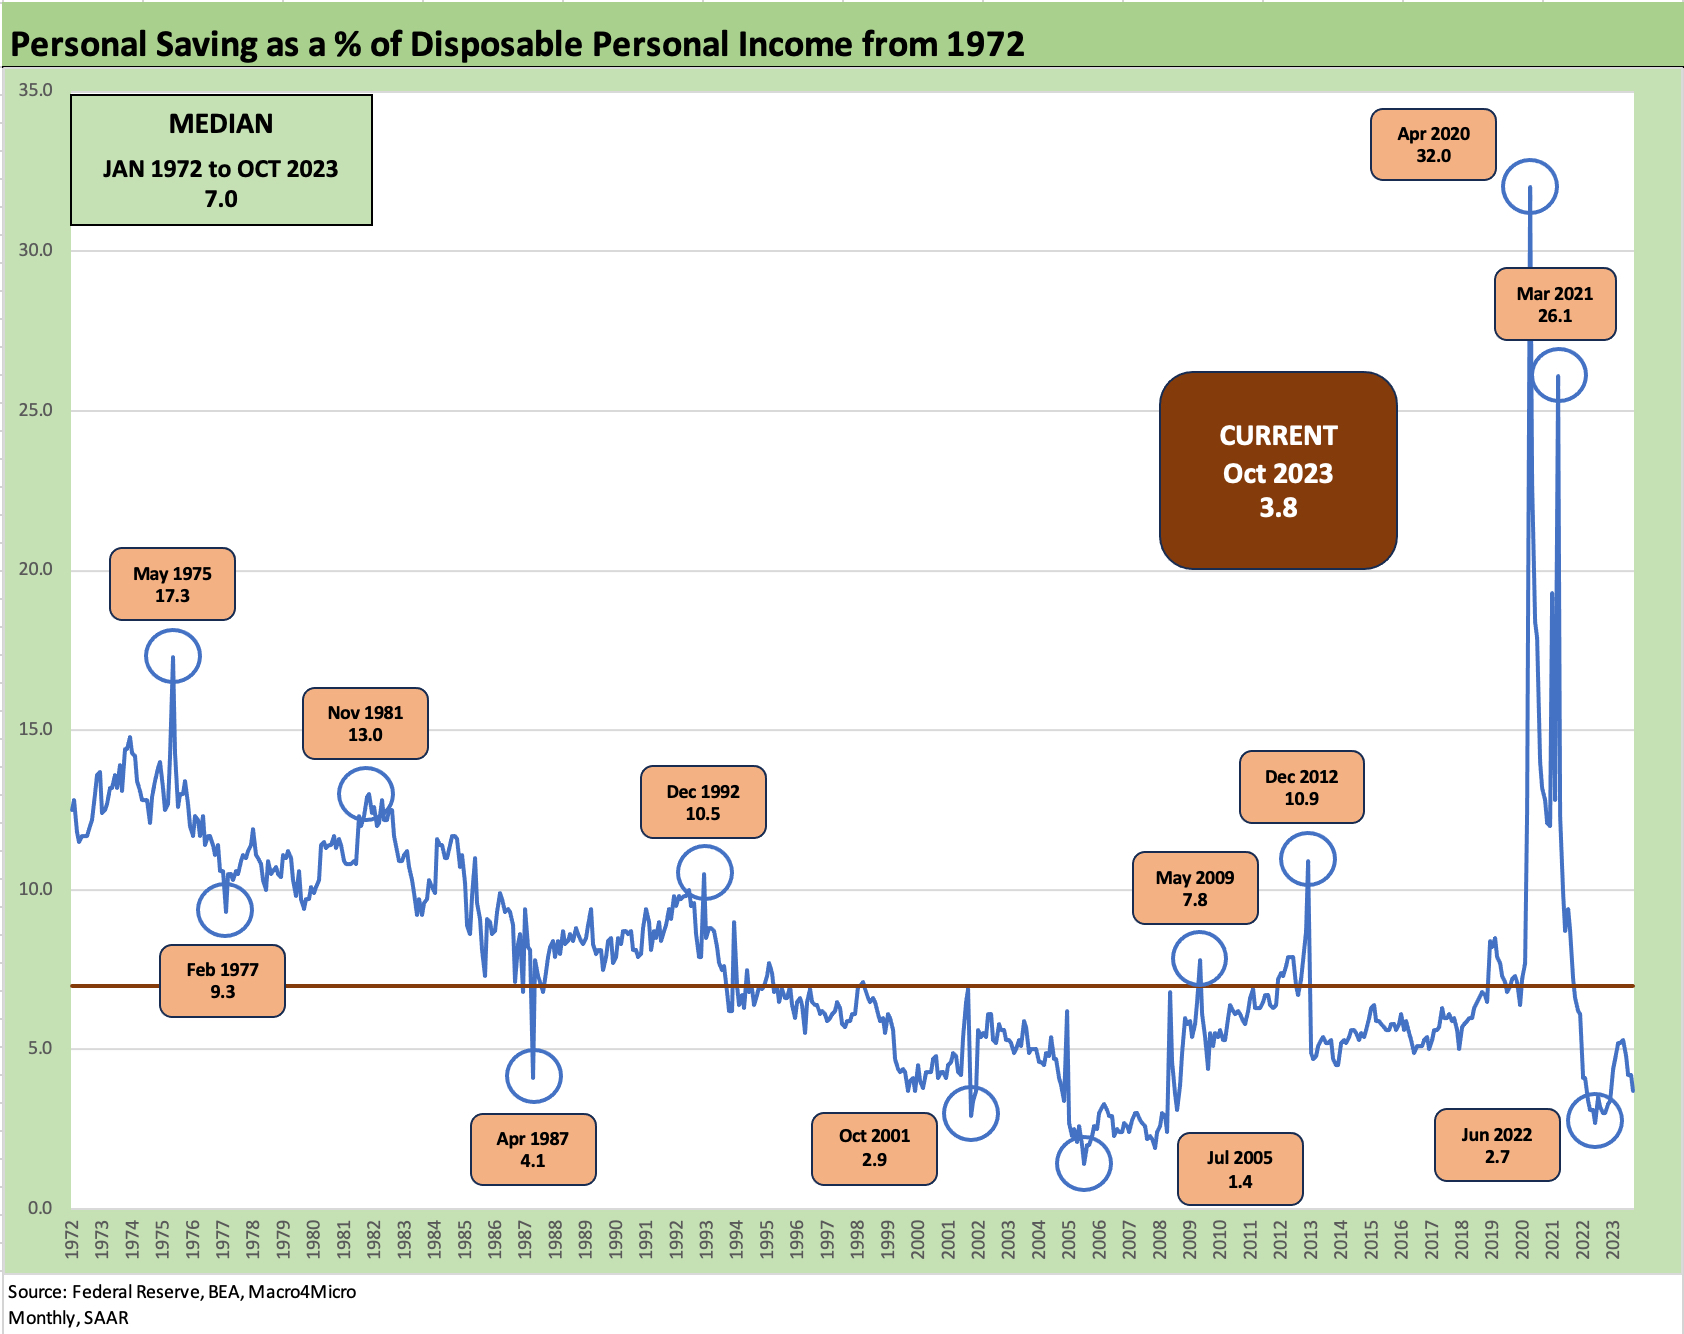
We usually don’t drop in this version of savings rate since the COVID distortions undermine the optics of change rates in “normal times,” but we add it for reference. We see the April 2020 32% peak. Then we see the distortions after the stimulus packages in early 2021.
The spike in savings rates during COVID are still subject to a lot of debate on how much investors spent down since then and how addicted they got to shopping and playing catchup with the pleasures of life on the services side (e.g., the insane air traffic volumes and prices of airfares and hotel rate spikes into the summer of 2023).
The goods boom with COVID and then the shift to services has been covered ad nauseum at this point. The new demand questions will pick up as we head into peak holiday season and then into what many employers, goods producers, and service providers are saying are more normalized seasonal patterns being back.
The old school view is that normal cycles (I can’t say I know what normal is since the 1970s) see the consumers lead and manufacturers reinvest the winnings later in the cycle. Cycles are obviously much more complicated than that with so much secular change and tech-based evolution of industries – notably so in an economy led by services and in a larger interconnected global economy (i.e., global sourcing led by China).
Different industries also have different cycles. One notable example is agriculture as we covered with Deere this past week (see Credit Crib Note: Deere & Co (DE) 11-28-23). We also now see the Affordable Care Act rising up as an issue again for the 2024 election wars, and that will make for a new front in a recurring war. Health care is around 18% to 19% of the US economy, so there will be much policy risk wood to chop in 2024. Medical care inflation has been muted in this inflation cycle, but that can change.
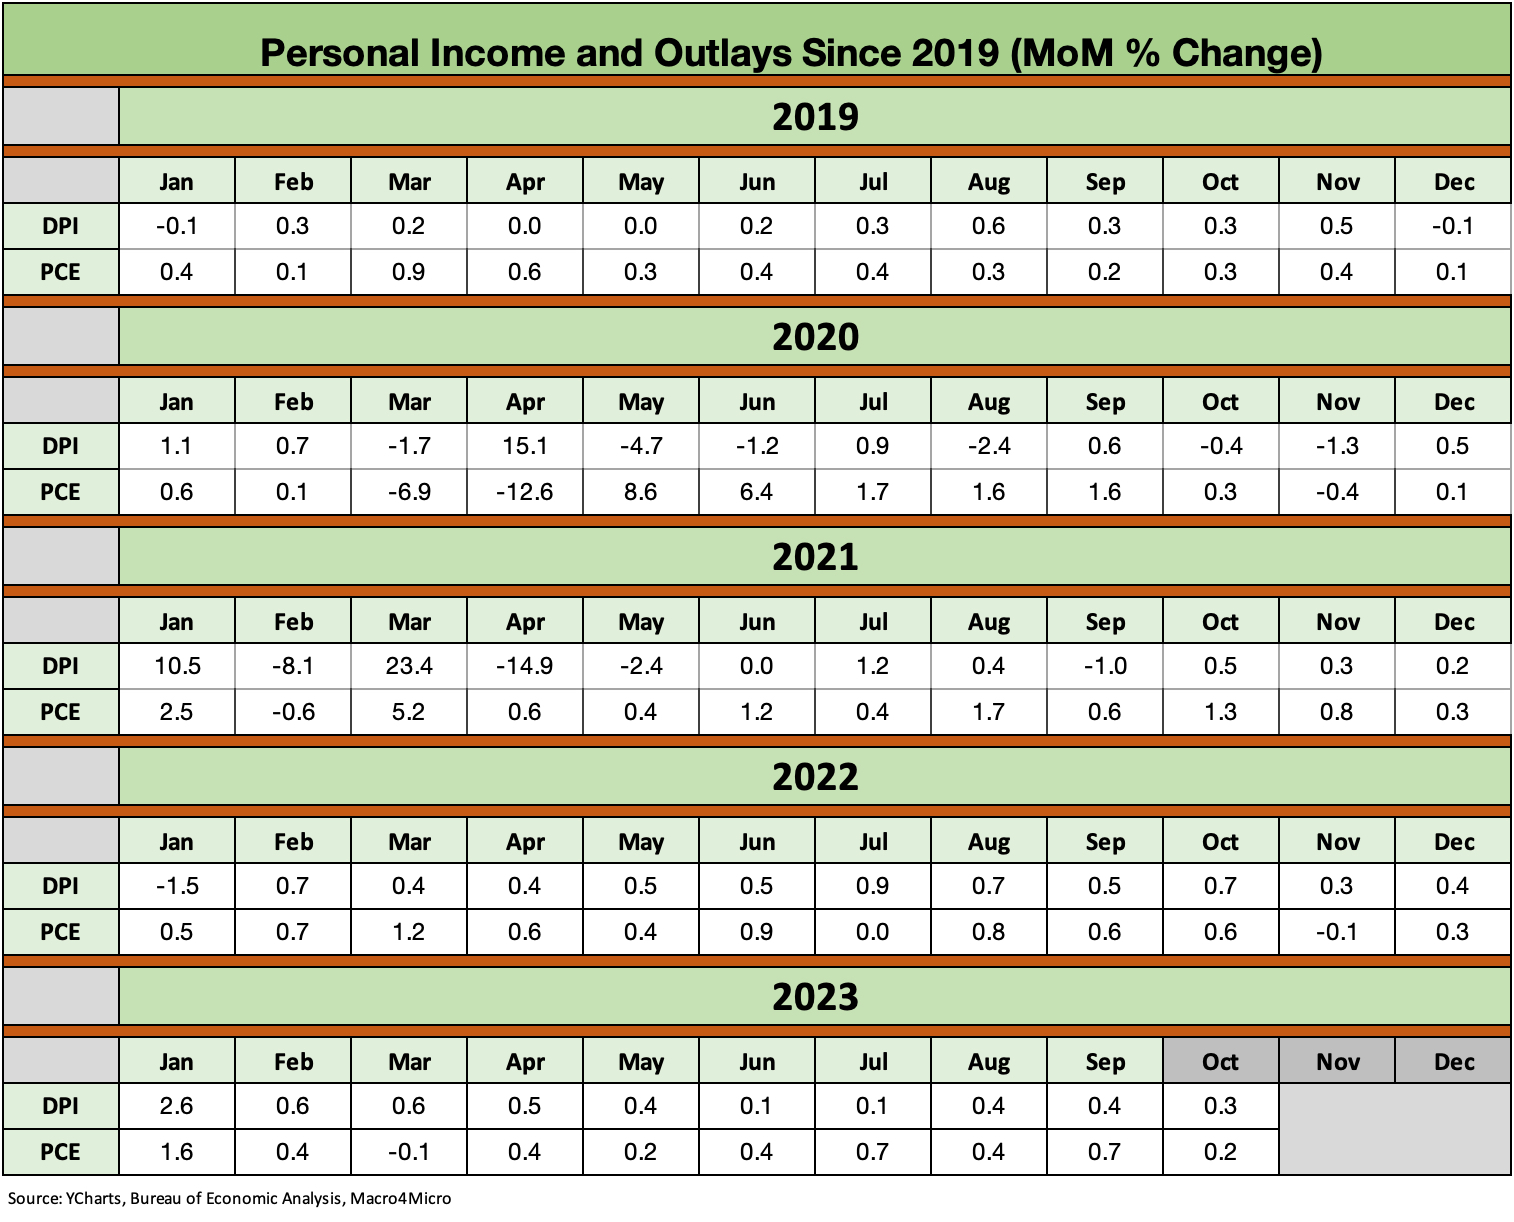
This last chart above recaps the monthly DPI and PCE numbers across the timeline from 2019. The rate of revisions (sometime without the flagged “r”) is a constant in economic data struggle.