
Footnotes & Flashbacks: Credit Markets 5-12-25
The China truce and tariff adjustments create an all-new backdrop after a constructive week for credit.


On the other hands…economists weigh potential outcomes.
The US-China deal just radically changed the near-term dynamics as Monday opens for business. Another 90-day pause saves face, but the radical reduction in tariffs heads off some very draconian near-term outcomes. The market is celebrating accordingly.
Trump has avoided the ultimate test of his “seller pays” fabrication and what might have evolved for Goods prices with inventory liquidation, pending household shortages, and the fear of even more pronounced price impacts of supply-demand imbalances.
Trade deficit reduction, reshoring and perhaps a “closet priority” of maximizing the tariff revenue stream is still in the mix of key policy goal of Trump 2.0. The aggressive tariff policy will continue even if the Reciprocal Tariff math lingers as an embarrassment that they will deflect by political spinning and say that 10% on China plus 20% for fentanyl was “the plan all along.” Declare victory, keep the clock running for 90 days, and roll out more product tariffs appears to be the goal now.
Even if the substance revolves around a 10% baseline goal for most nations, the slate of Section 232 and IEEPA national security tariffs are not slowing down. We saw commercial aircraft (engines and supplies) initiated this past week and massive product areas such as semis and pharma are a work in progress. They all carry high retaliation risk.
This week sees CPI, Retail Sales, Industrial Production, and Housing starts for April that will provide some early clues of tariff impact. Like the April jobs report, these may still be on the early side for any major shifts as the initial effects are blunted by pre-buying inventory and the existing stockpiles get used first.

For the week, the spreads continued to compress from the peak post-Liberation Day levels as sentiment around trade shifted with the “deals” that were not actually deals. The market signaled that anything resembling progress (even if provisional and incomplete) would get a friendly greeting. The charts below revisit a relatively uneventful week as the markets awaited the US-China meeting, so what follows will seem like very old news already.
We covered the above chart in Mini Market Lookback: When in Doubt, Get Forcefully Ambiguous (5-11-25) and the takeaway is that spreads are moving quickly in the post-Liberation Day aftermath. This week saw a brief sell-off heading into the Fed meeting until the ‘historic’ US-UK trade deal was celebrated as it at least provided some clarity on how these may get structured. We discussed this thoroughly in our recent commentary.
The week saw spread tightening of -4 bps for US IG and -7 bps for US HY. The mildly constructive week for credit risk now leaves the US HY market at -108 bps from the +461 bps post Liberation Day peak and retraced most of the way back to late March levels. The overall move leaves the YTD US HY OAS delta at +61 bps wider. With such a low starting point, HY spreads are still compressed.

The above chart covers total and excess returns across HY, IG, and the credit tiers. A mild tightening of spreads with another upward shift in UST did not cause major shifts in the pattern of YTD credit returns. Given the adverse curve shift, total returns for credit assets did not move much this week, but the excess return picture continues to improve as the retracement continues. The overall mix provides a good case study for credit allocations amid market volatility in a way that the 2022 spread volatility did not.
That said, all bets are off in a stagflation spiral. The fact that China bordered on a systemic threat to the US cost of sales just saw the stagflation risk mitigated in part. That will keep heat on the Fed to now ease. The Fed has been subtly and vocally escalating its degree of worry on the Trump tariff regime. While infuriating Trump, the Fed has made it clear that tariffs have been the main barrier. Trump’s advisors presumably explained to him that the China trade war could very quickly demonstrate that the Fed was quite right into June and July on the price lag effects with the new post-tariff pricing rolling into the transaction flow.
On a lighter note, maybe parents can still get those 30 dolls with Trump getting a new 747 in the form of a gold flying palace. The Air Ali Baba Golden Express would have looked bad with shelves heading toward empty, prices rising, and the peak order season ahead.

IG spreads ended the week -4 bps tighter and now sits at +102 bps. Spreads overall remain comfortably below the longer-term medians, but this is an IG OAS level that will be a major challenge to sustain as we look back across time.
The markets faced tough risk-reward symmetry with the China risk and lurking EU battles ahead. The market would react to trade setbacks again even if White House press releases will claim only good news. The China truce (it is not a “deal”) just changed the near-term symmetry. The news flow from the freight and shipping sector has been very negative, and port activity reflected part of the great “inventory liquidation” process that was coming. That just got some critical relief for both the US and China.
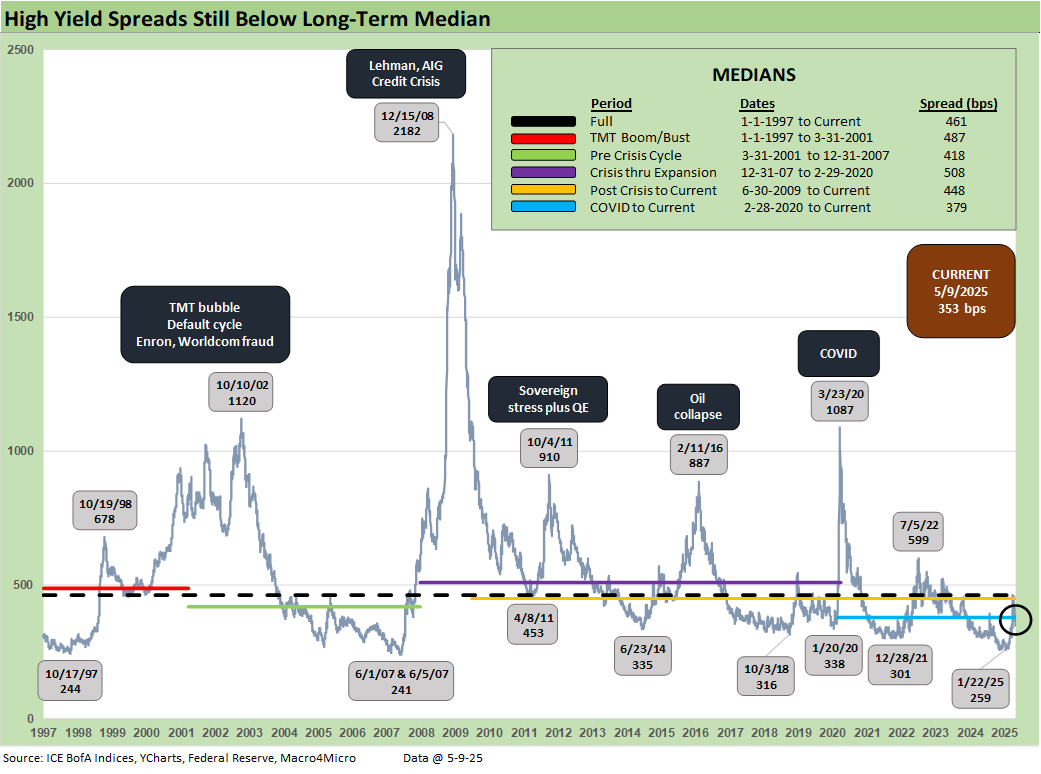
A respectable week for HY saw -7 bps of tightening to the +353 bps level and below all the long-term medians listed above, including the +380 bps post-COVID median. Even within a historically higher-quality HY index, we had viewed risks as skewed toward renewed widening. The China truce changes that for a while until we can sort out the next moves in the Trump tactical retreat.
The overall China-US arrangement coming out of the weekend is a retreat even if he does the expected end zone dance (After all everything Trump does is a victory in his eyes). Disaster was knocking and Trump can now turn his attention to the next wave of tariff programs that will also prove very contentious with industry and trade partners (aircraft/parts, pharma, semis, lumber, copper, etc.).
A framework in hand from the US-UK deal this past week does not yet provide us confidence that tariff uncertainty will be resolved quickly even if China was a big risk factor that has been mitigated (for now). The delayed impact of current measures will start to get more visibility. As the most recent whipsaw reminded, spreads will gap wider quickly and these relatively better levels provide an opportunity to selectively derisk.
There is no getting past the reality that the US has slapped painful tariffs on the three largest trade partners of the US including USMCA partners. The China news is good, but the EU, Mexico and Canada are bigger export markets. The bitterness of allies who have been targeted is not a small risk that goes hand in hand with the tariff disruptions. Japan and South Korea are high on the trade partner list and they have been targeted as well (see Trade: Uphill Battle for Facts and Concepts 5-6-25). Taiwan is in the top 10 trade partner list also, and we are unclear in how those talks will play out for the tech chain. A notable headline this week was a possible major defense package between Canada and South Korea—an indication that we can expect continued strain with traditional allies who feel mistreated in trade.

The differential between HY OAS and IG OAS (quality spreads) moved -3 bps this week with credit spread tightening driving minor compression. The recent history has been towards a tighter relationship between these two measures as IG quality shifts towards BBB and HY quality skews towards BB. This most recent compression brings us back below the long-term medians listed above but still far from the +178 bps low earlier this year.
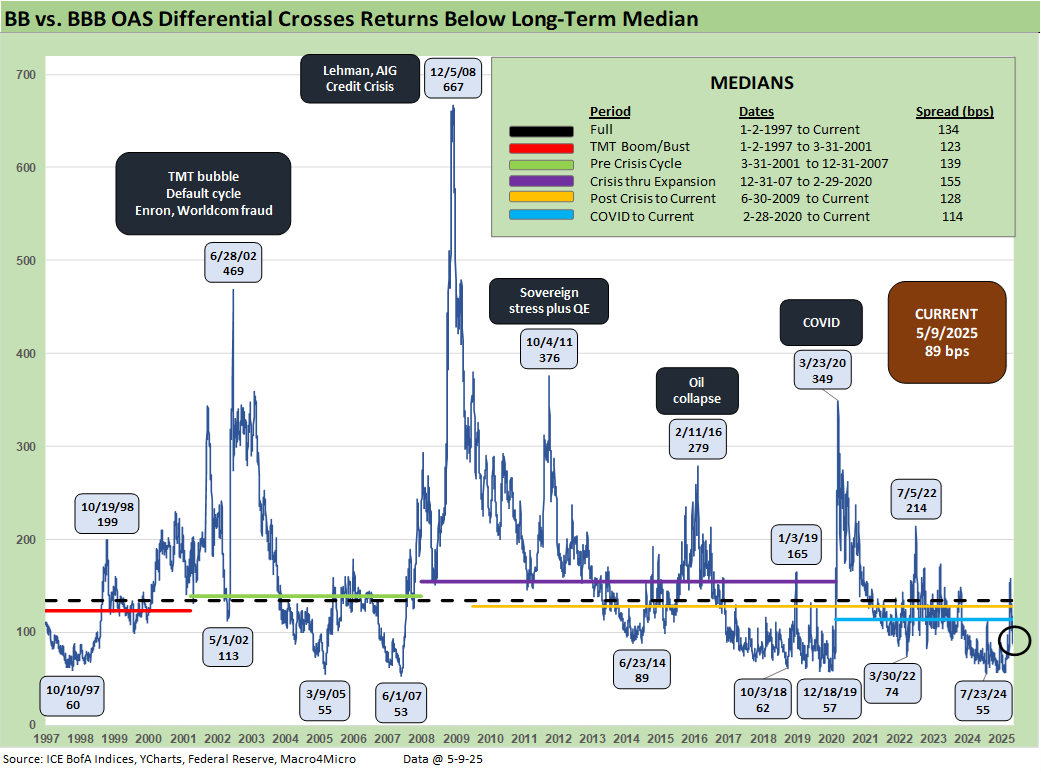
The “BB OAS minus BBB OAS” quality spread differential remained flat this week at -89 bps after both BBB and BB tiers saw -5 bps of tightening. The current levels return to below all the medians listed above this week and match the June 2014 low. This metric has stayed lower in recent history, and this level still has a ways to go from the low reached last year at +55 bps.

The BB tier compressed -5 bps since last week to +218 bps and is back to well below the long-term median. As with many of the measures, the recent move is below the post-COVID median as well.
The BB tier is relatively less exposed to cash flow shortfalls with tariff targets than the B tier, but the BB tier also could be joined by more than a few BBB tier fallen angels if the tariff backdrop and economic fallout “heads south.” The China news is a relief for the auto supplier chain. Autos and commodity-based BBB tier names with full yield curves of unsecured bonds can roil BB tier spreads under more than a few fallen angel scenarios. We saw oil pop on the China news as well to back over $63 on WTI from a $57 handle low last week, so that is helpful for commodity-exposed BBB and BB tier names.
The BB tier shows larger weightings of Financial Services, Media, and Leisure. The B tier has higher leverage and a more volatile industry level earnings mix. In other words, no tier would escape the wrath of a major tariff fallout and stagflation scenarios. China eases some of that risk. That would mean material quality spread decompression from BB to CCC. Even a simple, old-school economic contraction without high inflation would do damage to these spread levels. In that scenario, the Fed jumps in with two feet.
The potentially tragic outcomes from a US-China trade meltdown scenario for small and medium-sized business lines is important to regional banks as well as private credit. That also is very important in the payroll picture. Small business groups had been seeking exemptions, and they were pushed back by the White House. The bottom line is that the China news is much better than many people may realize. The White House was not admitting the downside risk that has been averted for now.

The B tier compressed -6 bps this week down to +371 bps. The whipsaw this month saw spreads briefly touch above the long-term median at +486 bps, tightening by -115 bps since then.

The B vs. CCC tier OAS time series is plotted above. The timeline for B and CCC spreads highlights the points of major divergence along the way (see The B vs. CCC Battle: Tough Neighborhood, Rough Players 7-7-24).
The current CCC tier OAS at +933 bps tightened by -23 bps the past week and just broke under the long-term median of +954 bps. The recent volatility was a brief reminder of the kind of B vs. CCC divergence that can happen in a hurry as markets reprice. Further tariff chaos was a threat that has been eased by the China action.
The potential economic damage that comes in 2Q or 3Q are still coming with the wide array of tariffs, but the scale of the China shutdown was more immediate and far more serious. That hit to prices and expense lines are mitigated (for now).
China as an outsized importer that was embargoed was going to lead to inventory crisis, shutdowns, bankruptcies, and fallout in trade credit. The new China tariffs still point at margin pressure and inflation price impacts, but that is a very different set of risks than widespread financial stress and layoffs. China knew that, so Trump had to blink (more than once …and then apply Visine).
The CCC YTW moved below the 14% line to 13.38%, but the underlying constituents are widely dispersed across an 80.78 composite dollar price. The CCC tier is still in the pricing zone of equity risk-returns with such yields. CCC investing at this point demands careful capital structure analysis and rigorous issuer-level relative value research. Subject to how the tariff policies play out and how the stagflation wildcard unfolds, the distressed players are warming up. China just took a swath of companies off the list for near term collapse and notably for working capital intensive operations who would see inventory evaporate. Costs will still be rising even at the new tariff levels.

The shorter timeline from Jan 2022 just ahead of the end of ZIRP and start of the tightening cycles gives better granularity on the movements from a low for CCCs of +659 bps in Jan 2022 to a peak of +1226 bps in July 2022 and +1289 bps to end Sept 2022 down to the Jan 2025 tights of +690 bps ahead of the recent spike and whipsaw to current levels.
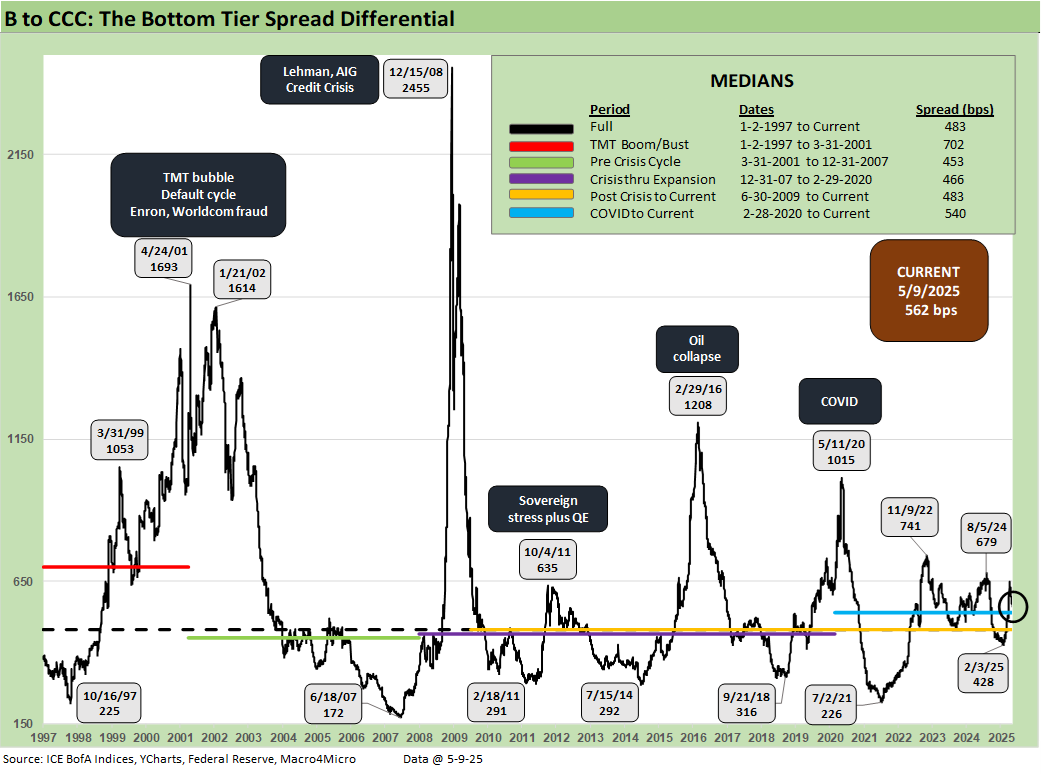
The B vs. CCC tier differential is broken out above with the current +562 bps still above the long-term median and above the distinct markets shown above with the exception of the TMT HY credit cycle with its +702 bps median.

The above chart frames the “B vs. CCC tier” quality spread differential across the short timeline for better granularity. Spreads widened with a vengeance since the low of Feb 2025 at +428 bps even if quality spreads recovered from the early April spike to +651 bps on April 8.
A look at yields…
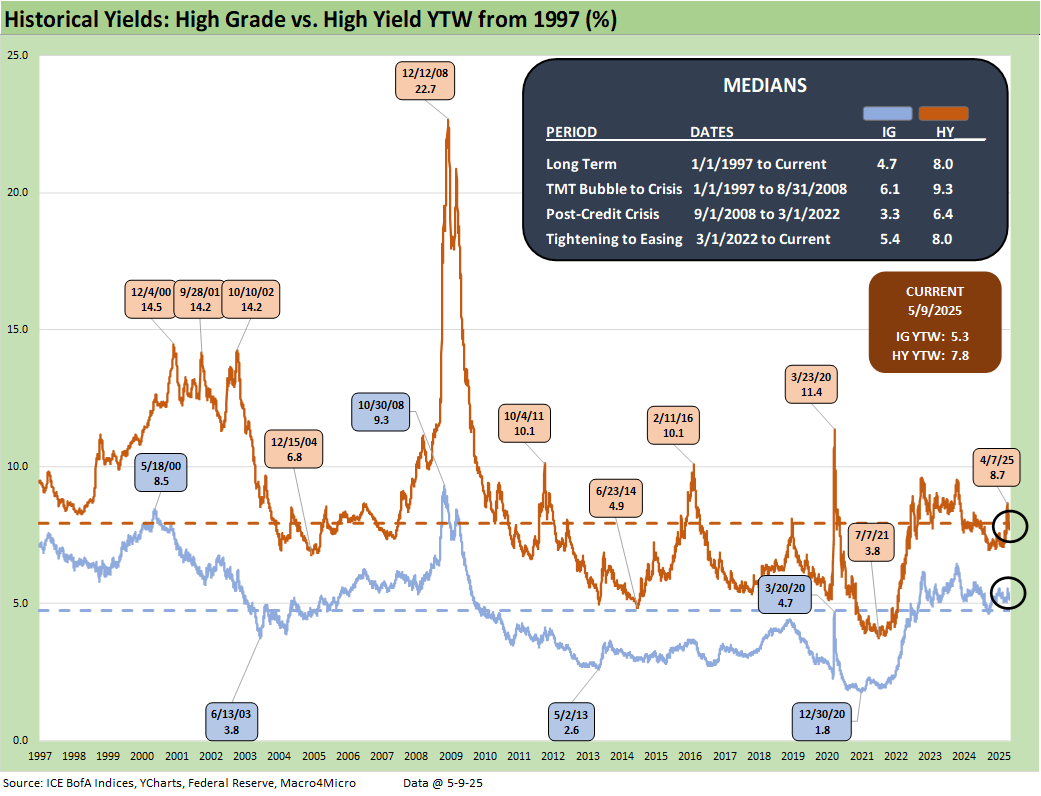
Moving away from spreads, which are a little further below long-term medians this week, yields for both IG and HY have a more complex story in historical context given the post-crisis distortions of ZIRP and “normalization.” The normalization period of Dec 2015 to Dec 2018 never really got on track with the economic weakness and Fed easing of 2019 followed by a COVID crisis and return to ZIRP in Mar 2020 (ZIRP ended March 2022).
The current IG YTW at 5.31% (vs. 5.30% last week) remained largely in place with an upward UST curve offset by spread tightening and remains below the 6.1% pre-ZIRP median on YTD UST curve moves. The HY YTW also remained flat at 7.77% (from 7.78%) vs. a pre-ZIRP 9.3% mark. We consider the pre-ZIRP years the most rational frame of reference in light of the post-crisis ZIRP and QE as well as the COVID Fed reactions.
Spreads will remain a key swing factor for reaching those yield medians of pre-ZIRP years, and we just saw material volatility in credit risk pricing in HY the past four weeks. UST yields are a tougher call with the tariff backdrop that still threatens stagflation as well as the potential for a technically driven upward shift on the supply-demand fears. The China truce eases the scale and immediacy of the risks but stagflation risks are not gone by any stretch. After all, China was the #4 trade partner.
In theory, old fashioned recession risk would pressure UST rates lower and credit spreads higher, but this is no ordinary cyclical turn. We cover the UST shapeshifting in our separate Footnotes publications on yields as the UST curve saw another minor selloff this week.
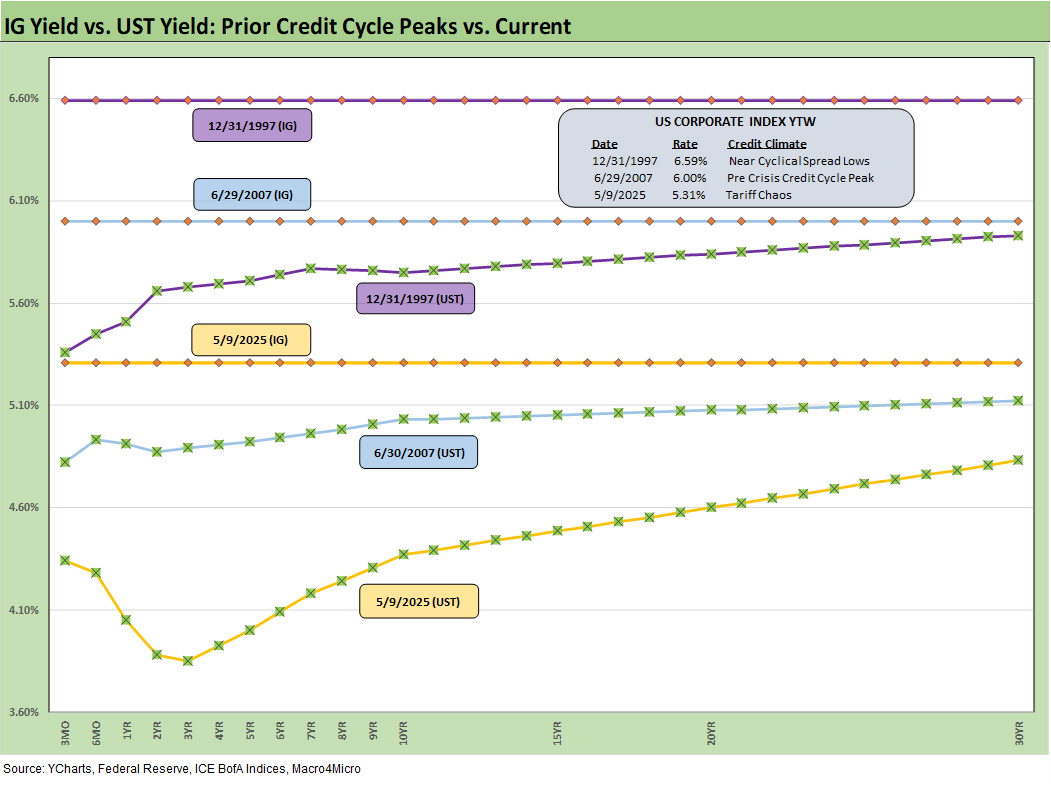
The above frames current IG index yields vs. previous credit peaks along with their respective UST curves. We include both prior credit peaks in June 2007 and Dec 1997 for context as prior peak credit cycles when high risk appetites saw investors chasing yields. Those 1997 and 2000 markets saw poor risk symmetry and low spreads.
Today’s curve is still low in those historical credit peak contexts. With stagflation risks back in the mix and the current market beyond the credit cycle peak after the tariffs, the next stretch could see long yields rising as spreads widen out for renewed return pain. The short to intermediate IG market is still the safest bond game for now. The funds that are asset class constrained to HY can take refuge in the higher quality layers but overall default risks remain in check.

The final chart does the same 1997 and 2007 drill but for HY index yields. This week’s UST move leaves current HY index yields still in line with prior peak credit cycles at 7.77% vs. 7.96% in June 2007 and 8.60% in Dec 1997. The recent spread widening had moved HY index yields higher, but the past week spread rally and recent rolling UST move lower left the current HY index YTW below both the 2007 peak and 1997 HY index levels.
The widening early this month gave flashbacks to the volatility and major spread moves of the 1997-98 and 2007-08 periods that also posted triple-digit widening months. The sheer speed of risk repricing has happened in earlier cycles even if those moves were for very different reasons.
The challenge is identifying a fundamental transmission mechanism to more trouble for financial metrics and relative risks of default. Identifying a catalyst for pain now is easy with tariffs hitting the macro drivers (the consumer) and micro drivers (“buyer pays” hits margins or requires higher prices).
The recent tariff shock is unprecedented in modern capital markets, but at least the banks are much healthier. The China truce eases the immediate threat, but the threat still looms large even if not the near-term cliff many borrowers faced with China.
We also see higher quality levels in the HY bond index as a starting point vs. 2007 and the late 1990s TMT bubble years. The reality is the tariff impacts and supply-side disruptions are only now just beginning in substance. It is hard to reflect forward-looking risks when so few know (including the White House) what those risks will be. Trade war risk wit the EU, Canada, and Mexico are not zero. China has a 90-day clock that can be required or extended with ease.
The bad old days…
Looking back even more, the turn in the credit cycle always comes at some point and often with an external trigger or “assist” that can set it off. During 1990, securities firms started to collapse including Drexel’s Chapter 11 in Feb 1990 and bridge loan related bailouts of Shearson Lehman, First Boston, and Kidder Peabody. We do not face that type of financial intermediary meltdown risk here (at least not yet!). In a protracted stagflation bout, eyes will return to the regional banks.
The summer of 2007 was the start of major problems in the credit markets with asset risk and leveraged counterparty exposure and bank/broker interconnectedness risk soaring. Despite that backdrop that worsened in August 2007, the equity markets and S&P 500 and NASDAQ kept on rallying into Oct 2007. Later in the turmoil and well after the fact, the start of the recession was tagged as Dec 2007 (see Business Cycles: The Recession Dating Game 10-10-22).
The 2007 experience reminded the market that credit leads the cycle and equity lags. The same was true in 1999 with the HY default cycle underway and NASDAQ at +86% that year. This time around, the credit markets did not expect the tariff insanity and is still making up its mind. The real economic effects are more geared to the periods ahead in 2Q25 and 3Q25 when tariffs will be registered at the transaction level. That will be the reality point. We expect HY to stay unhappy and spreads to average wider as the tariffs roll into actual corporate fundamentals.
With the weekend developments around China, at least the empty self and crushing bankruptcies in retail are not imminent.
See also:
Footnotes & Flashbacks: State of Yields 5-11-25
Footnotes & Flashbacks: Asset Returns 5-11-25
Mini Market Lookback: When in Doubt, Get Forcefully Ambiguous 5-11-25
Credit Snapshot: PulteGroup (PHM) 5-7-25
Credit Snapshot: Toll Brothers 5-5-25
Footnotes & Flashbacks: Credit Markets 5-5-25
Mini Market Lookback: Inflated Worry or Slow Train Wreck? 5-3-25
Payrolls April 2025: Into the Weeds 5-2-25
Payroll April 2025: Moods and Time Horizons 5-2-25
Construction: Singing the Blues or Tuning Up for Reshoring? 5-1-25\
Employment Cost Index 1Q25: Labor is Not the Main Worry 5-1-25
1Q25 GDP: Into the Investment Weeds 4-30-25
PCE March 2025: Personal Income and Outlays 4-30-25
1Q25 GDP Advance Estimate: Roll Your Own Distortions 4-30-25
JOLTS Mar 2025: No News is Good News 4-29-25
Credit Snapshot: D.R. Horton (DHI) 4-28-25
Mini Market Lookback: Earnings Season Painkiller 4-26-25
Existing Home Sales March 2025: Inventory and Prices Higher, Sales Lower 4-24-25
Durable Goods March 2025: Boeing Masking Some Mixed Results 4-24-25
Equipment Rentals: Pocket of Optimism? 4-24-25
Credit Snapshot: Herc Holdings (HRI) 4-23-25
New Home Sales March 2025: A Good News Sighting? 4-23-25
Mini Market Lookback: The Powell Factor 4-19-25
Home Starts Mar 2025: Weak Single Family Numbers 4-17-25
Credit Snapshot: Service Corp International (SCI) 4-16-25
Credit Snapshot: Iron Mountain (IRM) 4-14-25
Credit Snapshot: Avis Budget Group (CAR) 4-9-25
Credit Snapshot: AutoNation (AN) 4-4-25
Credit Snapshot: United Rentals (URI) 4-1-25
Recent Tariff Commentaries:
US-UK Trade: Small Progress, Big Extrapolation 5-8-25
Tariffs: A Painful Bessent Moment on “Buyer Pays” 5-7-25
Trade: Uphill Battle for Facts and Concepts 5-6-25
Tariffs: Amazon and Canada Add to the Drama 4-29-25
Ships, Fees, Freight & Logistics Pain: More Inflation? 4-18-25
Tariffs, Pauses, and Piling On: Helter Skelter 4-11-25
Tariffs: Some Asian Bystanders Hit in the Crossfire 4-8-25
Tariffs: Diminished Capacity…for Trade Volume that is…4-3-25