
Footnotes & Flashbacks: Asset Returns 2-25-24
In a mild week for UST rate moves, the headlines were dominated by more benchmark records, tech bullishness, and the big headlines from Nvidia.


We look at asset returns in a week dominated by Nvidia headlines but where the trenches showed solid numbers across a wide range of industry groups.
We see Homebuilders (XHB) and Midstream Energy (AMLP) leading the 31 benchmarks and ETFs we track each week with a mix of defensives, cyclicals, and financials in the top quartile.
Duration and fixed income had a bland week with mixed UST price action after a tough stretch, but the 30Y curve helped the long duration UST ETF (TLT).
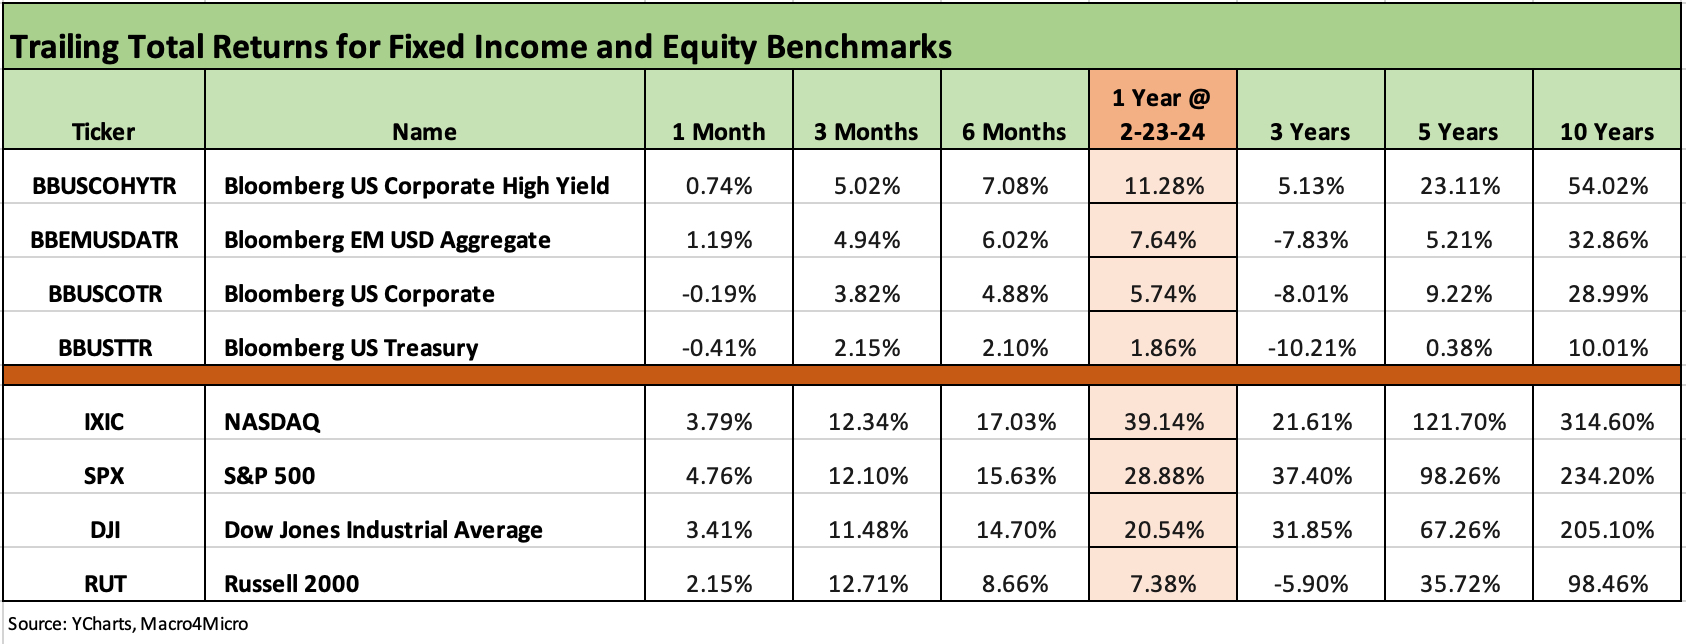
The above chart updates the rolling time horizon returns for the debt and equity benchmarks we track. We line them up in descending order for 1-year total returns. The equity returns are impressive in tech-centric benchmarks as the Magnificent 7 drove superior broad market returns across 2023 as covered in our year end recap (see Footnotes & Flashbacks: Asset Returns 1-1-24 ). Many other subsectors only joined the party late in the year.
The 1-month horizon has been a tough month for bonds with duration pain showing IG Corporate and UST benchmarks in the red. We update the UST deltas in our separate Footnotes publication that we will post later this evening. For the rolling 3 months, however, the Nov-Dec rally in risk and UST has kept the bond benchmarks at healthy run rates for 3-month returns. Spread compression and shorter duration has been a good combination for US HY.
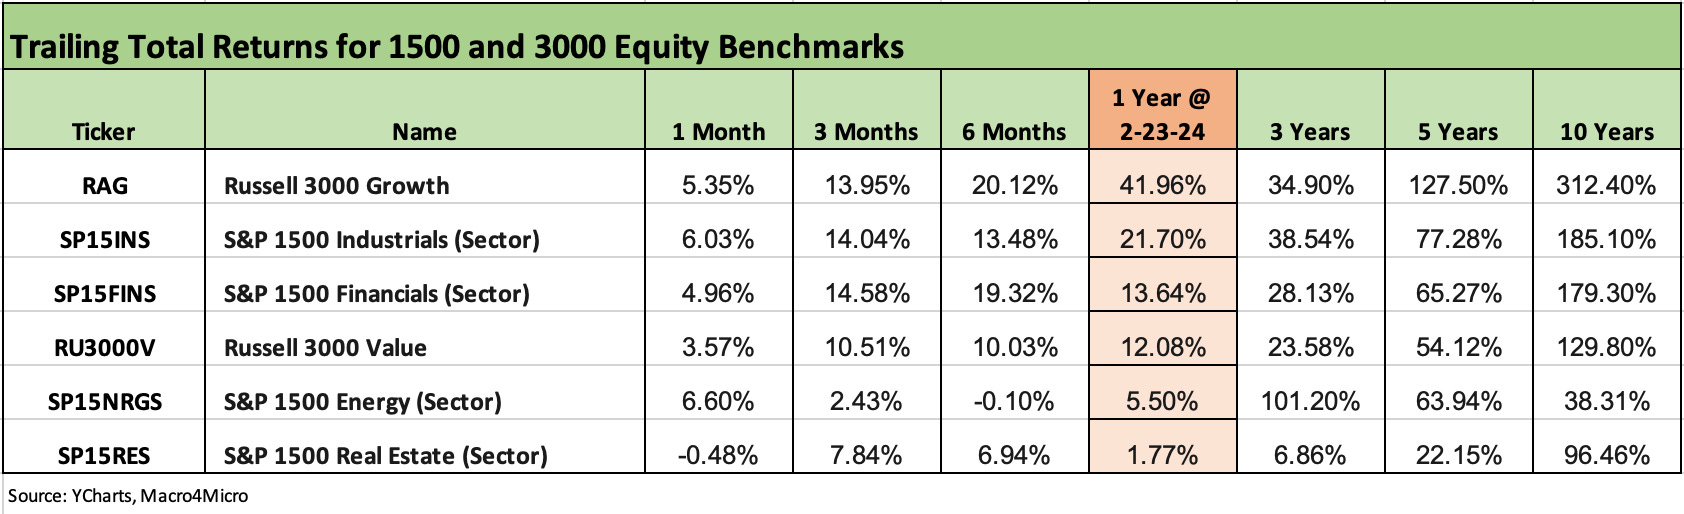
The above chart updates the 1500 and 3000 series, and the trailing 1-month returns are showing balance and breadth across Growth, Industrials, Financials, and Energy. Real Estate has been the weak link given a mix of asset quality worries and interest rate concerns. For the rolling 3-month period, we see the broad rally of Nov-Dec still holding up double-digit returns for Growth, Value, Industrials, and Financials. That is a very impressive 3-month stretch across numerous sectors.
The rolling return visual
In the next section we get into the details of the 31 ETF and benchmarks for trailing periods. The collection of four charts below looks a lot like some recent Footnotes publications since we still see a clear advantage on the positive returns side of the score. This past week posted a very strong performance across the mix of 31 at 29-2 favoring positive. That comes after the prior 4 weeks posted 16-15, 18-13, 21-10 and 26-5 for the remainder of the rolling 5 weeks. After some mixed weeks in January, the positive bias has been steady.
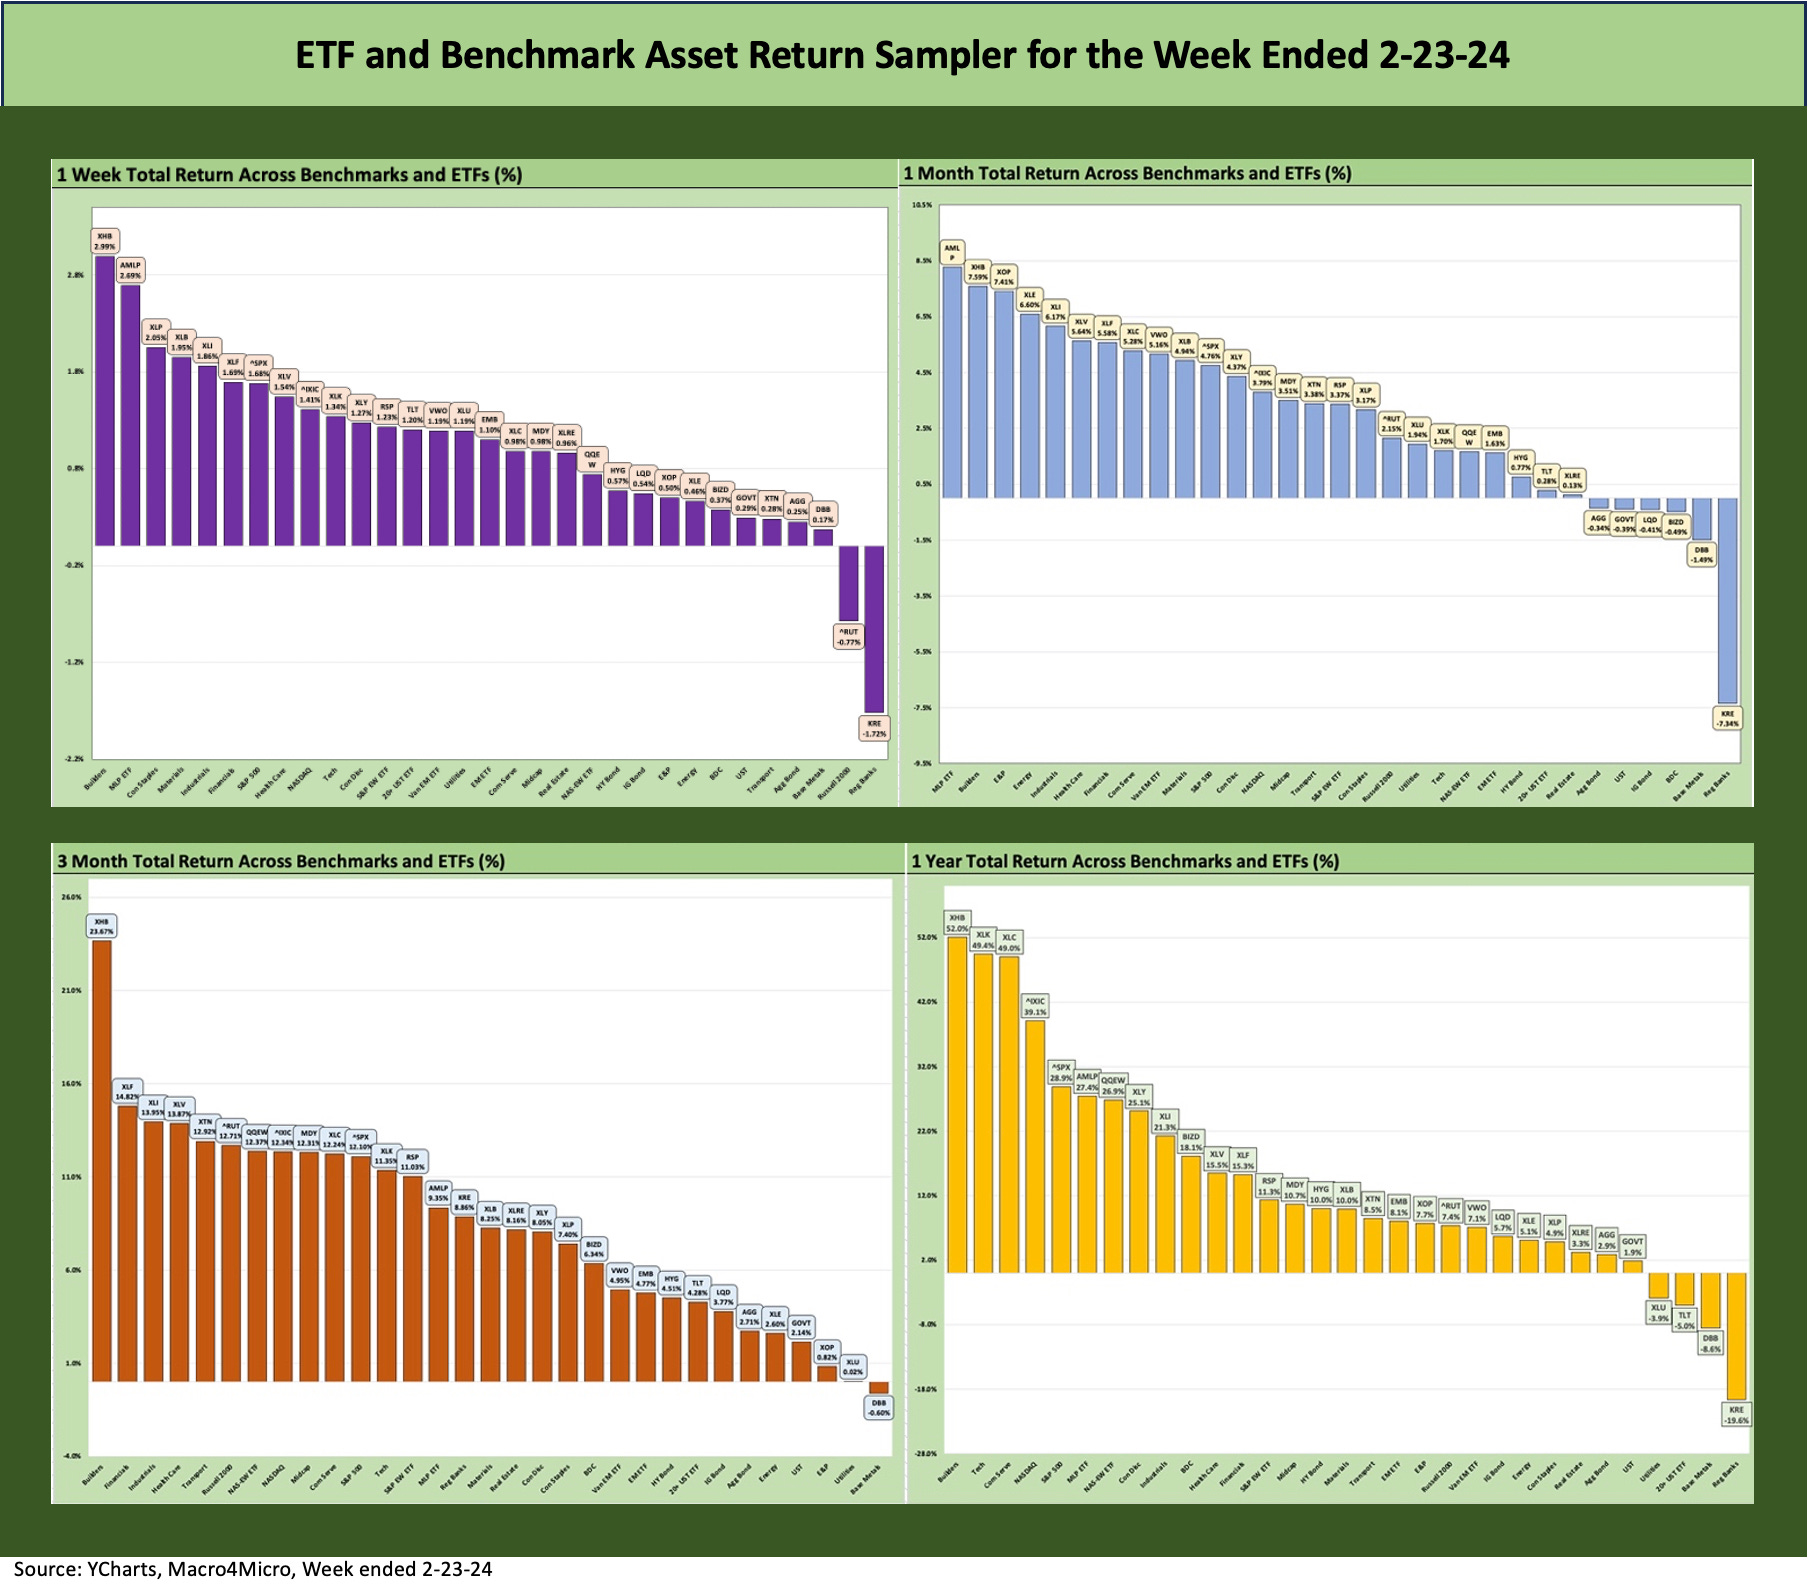
The above chart is a quick visual that shows the 1-week, 1-month, 3-month, and trailing 1-year mix. After a rough tightening cycle and some serious damage on duration and tech in 2022, we see only 4 line items in the red zone for the trailing year, 1 in negative range for 3-months, 6 negative line items for 1-month, and a 1-week set of numbers at only 2 negative with the Russell 2000 small caps and Regional Banks (KRE) missing the cut.
The Magnificent 7 heavy ETFs…
Some benchmarks face issuer concentration elements that leave them wagged by a few names. When looking across some of the bellwether industry/subsector ETFs in the rankings, it is good to keep in mind which narrow ETFs (vs. broad market benchmarks) get wagged more by the “Magnificent 7” including Consumer Discretionary (XLY) with Amazon and Tesla, Tech (XLK) with Microsoft, Apple, and NVIDIA, and Communications Services (XLC) with Alphabet and Meta.
The headlines around NVDA this past week do not need too much commentary after it was all over the headlines before, during, and after its banner earnings report that moved the needle for some benchmark indexes. On a trailing 1-year basis, a total return of over 233% for NVDA is almost 9x the S&P 500 and almost 5x the NASDAQ 100. That is an otherworldly performance, and enough to make market risk analysts nervous on how NVDA might wag volatility in periods ahead.
With the S&P 500 and Dow hitting record high closes this past week and NASDAQ just missing after hitting an intraday high, the equity market is helping sentiment around risk broadly. HY saw -11 bps of contraction, but quality spreads compressed from the bottom up with -28 bps tighter in the CCC tier.
The mood is good in risk as the market awaits its next inflation read with PCE this Thursday set to test the nerves of UST bulls if it disappoints the way we saw with CPI and PPI. Interestingly, the long duration UST 20Y+ ETF (TLT) was the top bond ETF and landed in the 2nd quartile for the week in a positive equity period.
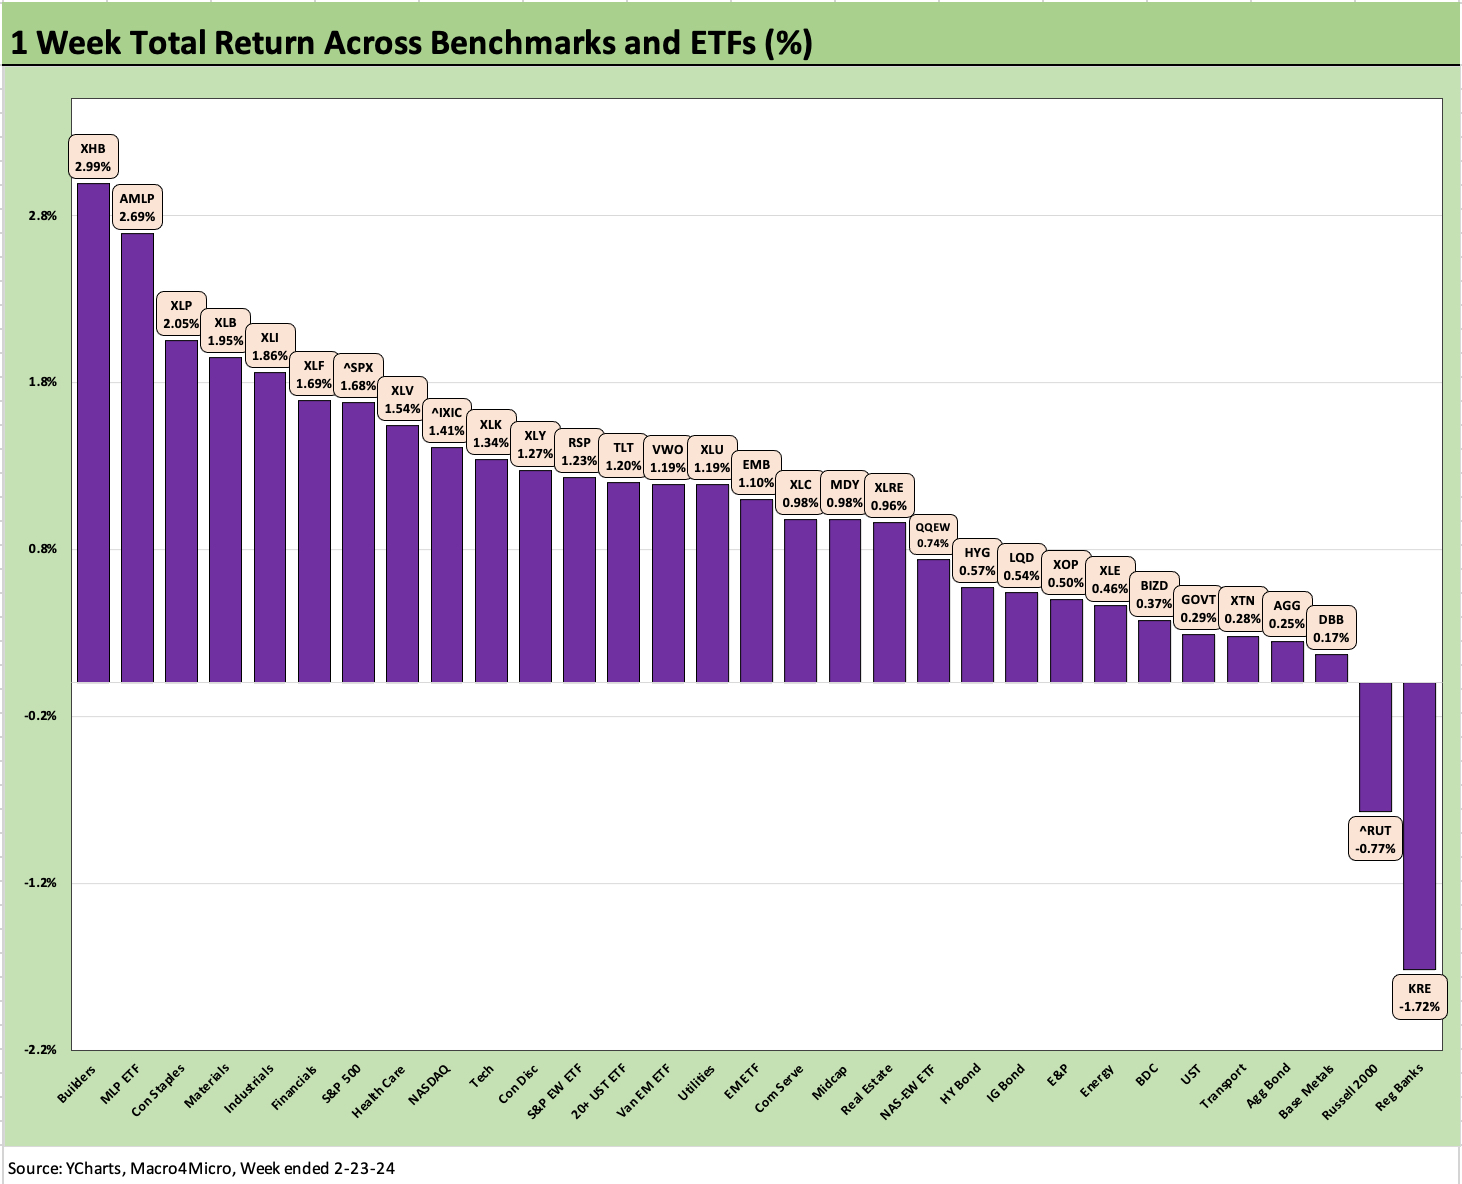
The above chart details a 29-2 week for our 31 benchmarks and ETFs with only the Regional Bank ETF (KRE) in the red with small caps (RUT) just slightly negative. Builders turned in another strong week despite higher mortgage rates as Toll Brothers reported very impressive earnings that brought a big stock pop and the largest cap builder names all outperformed the market benchmarks.
We see AMLP having a strong week as one of its larger holdings, Western Midstream Partners, surged on reports Oxy was looking to maximize value on its holdings to repair its balance sheet. Oxy controls a 51% economic interest (almost 49% of LP + GP interests), and the trade rags lit up on the potential for another major midstream asset sale. WES climbed over 15% for the week and is +29% LTM in total return on its units.
The rest of the top quartile for the week shows impressive breadth and the top performers were light on Mag 7 names. Staples (XLP), Materials (XLB), Industrials (XLI), Financials (XLF), and Health Care (XLV) were in the top quartile along with the S&P 500. Given the NVDA headline, that was somewhat of a surprise to see such an old school mix.
Over on the far right side of the rankings, we still see Regional Banks (KRE) struggling. That will be a fragile block of issuers until the market can gain conviction around shoes that could drop in commercial real estate. It was less than a year ago that the regional bank sector lit up the screens.
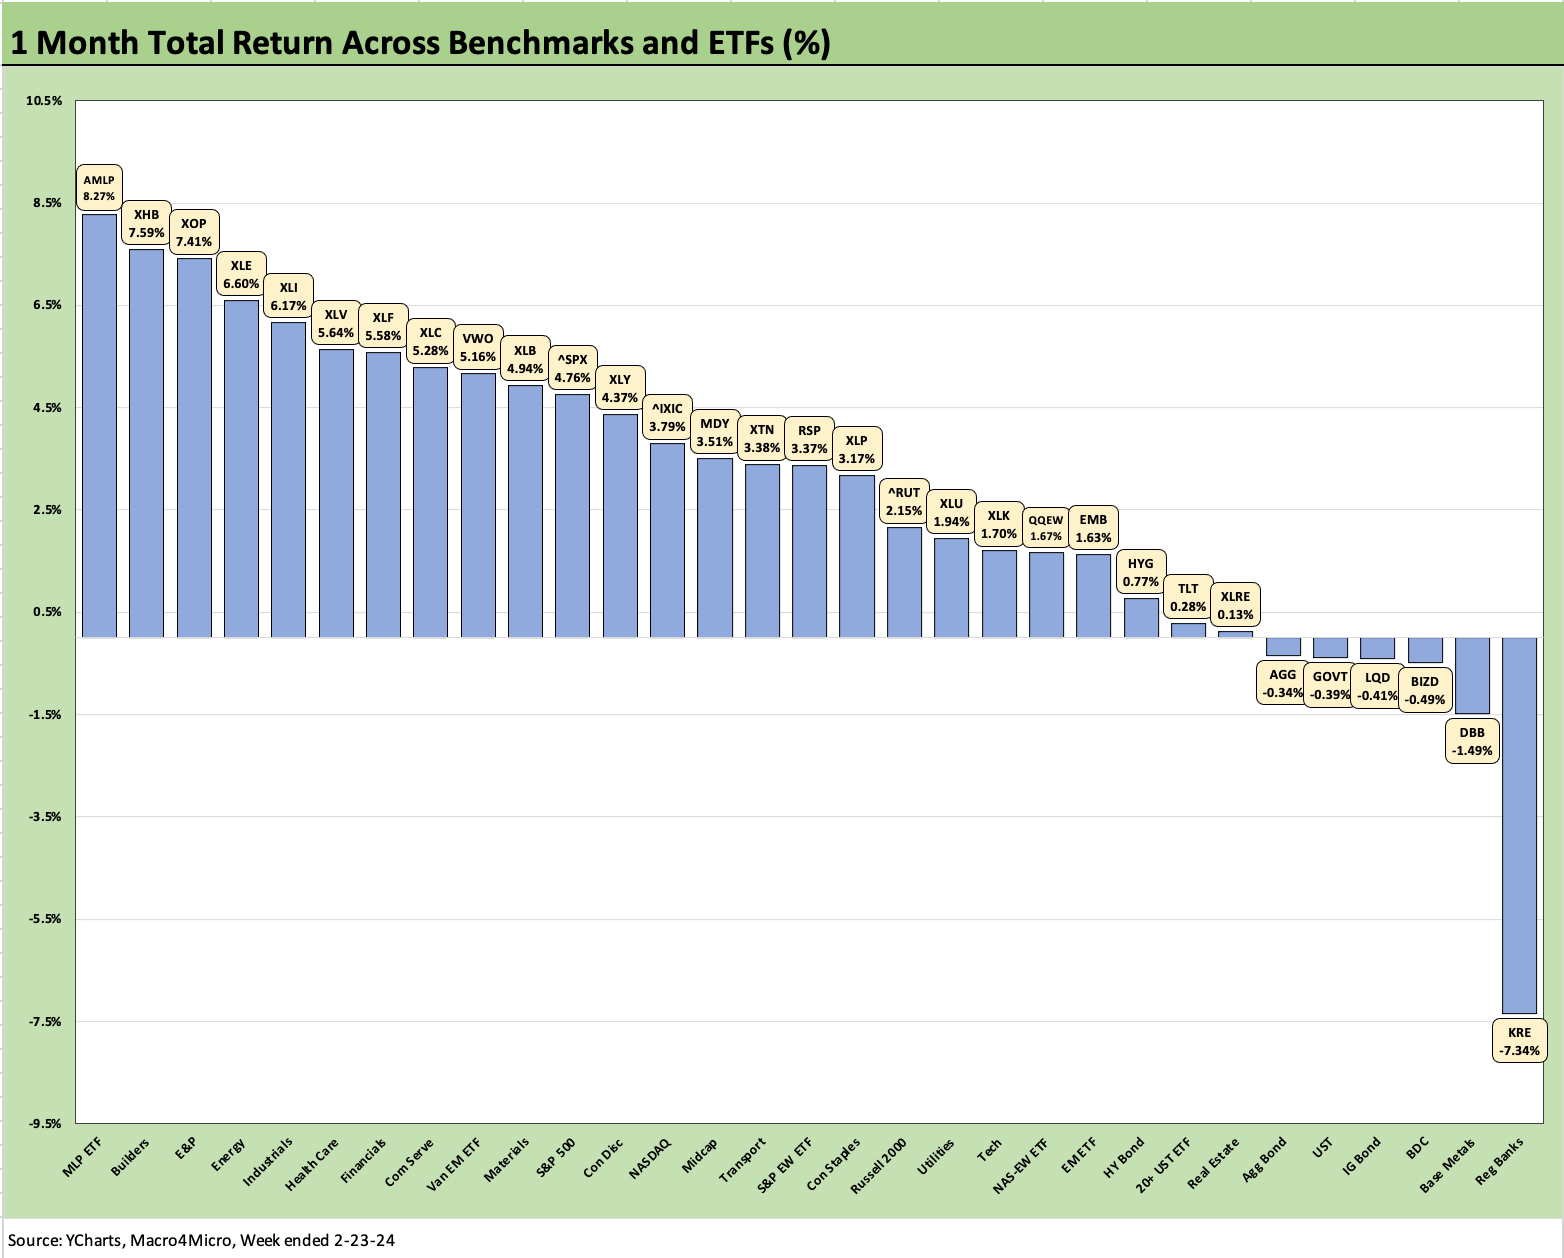
The 1-month returns weighed in at 25-6 positive with 3 of the 6 in the red being from the bond ETF universe with IG bonds (LQD), UST (GOVT), and AGG slightly in the red along with the BDC ETF (BIZD), which for its part had a pretty good earnings season with some exceptions. The credit cycle is clearly hanging in there for most BDCs on asset quality, and the floating rate secured assets are still well positioned with Fed cuts (timing and number) under growing doubt. For the trailing 1 year, the BDC ETF is on the upper end of the 2nd quartile.
The top quartile for the 1-month period shows Midstream Energy (AMLP) at #1 with Homebuilders (XHB) close behind it before E&P (XOP) and Energy (XLE) and Industrials (XLI) round out the Top 5. The only Mag 7 heavy name in the top quartile is at #8 with Communications Services (XLC).
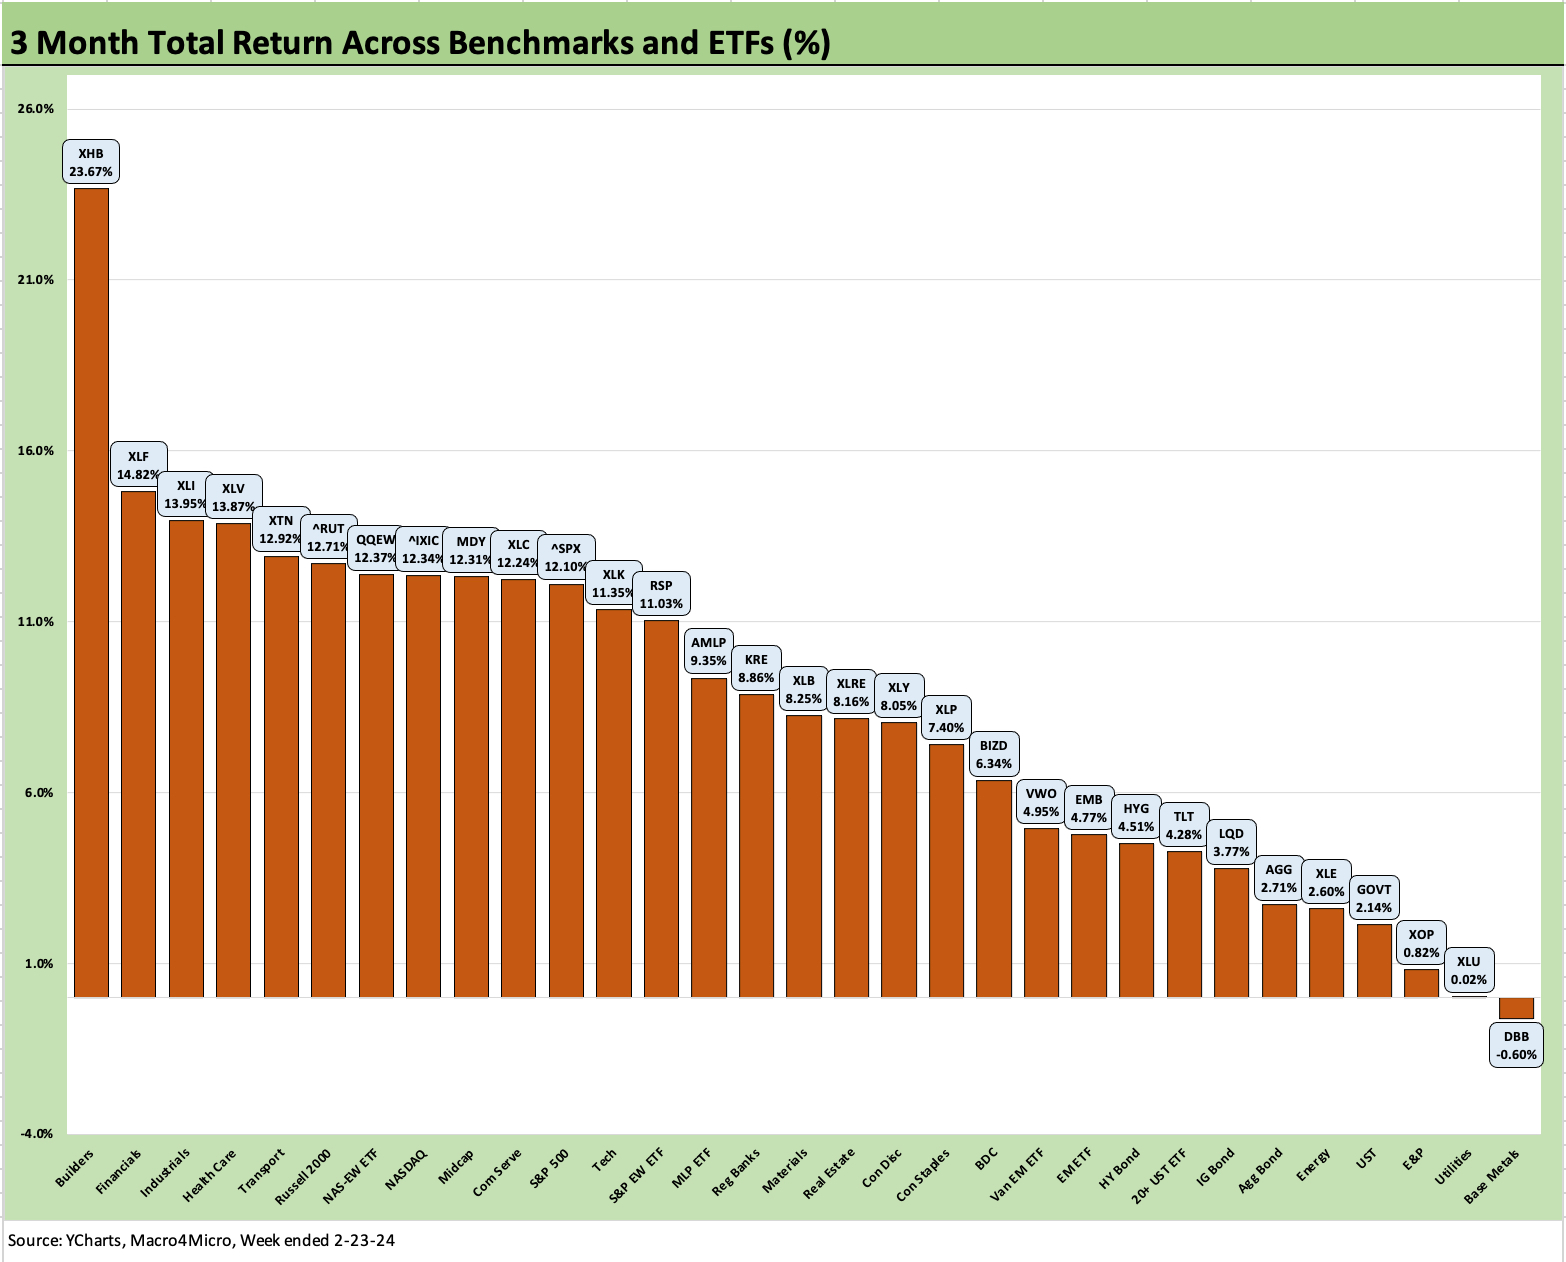
The 3-month time horizon posts only 1 line in the red zone with the Base Metals ETF (DBB) feeling the shaky China macro story line. That 30-1 score sheet is a reminder of the rally of late Nov into a very bullish rebound in Dec 2023 with its impressive breadth and now a good rolling start to 2024.
Homebuilders have pulled away from the pack again on earning strength, constructive guidance and the demonstrated ability of the major builders to navigate 6% or 7% handle mortgages. The industry will soon be moving into its two peak quarters of spring and summer.
The top quartile measurement period benefits from some strong performers in the Nov-Dec period. The rally by so many industries and subsectors (notably small caps in Dec 2023) saw more subsectors and industry groups play catchup and narrow some of the gap on the tech market leaders to close out 2023 (see Footnotes & Flashbacks: Asset Returns 1-1-24 ).
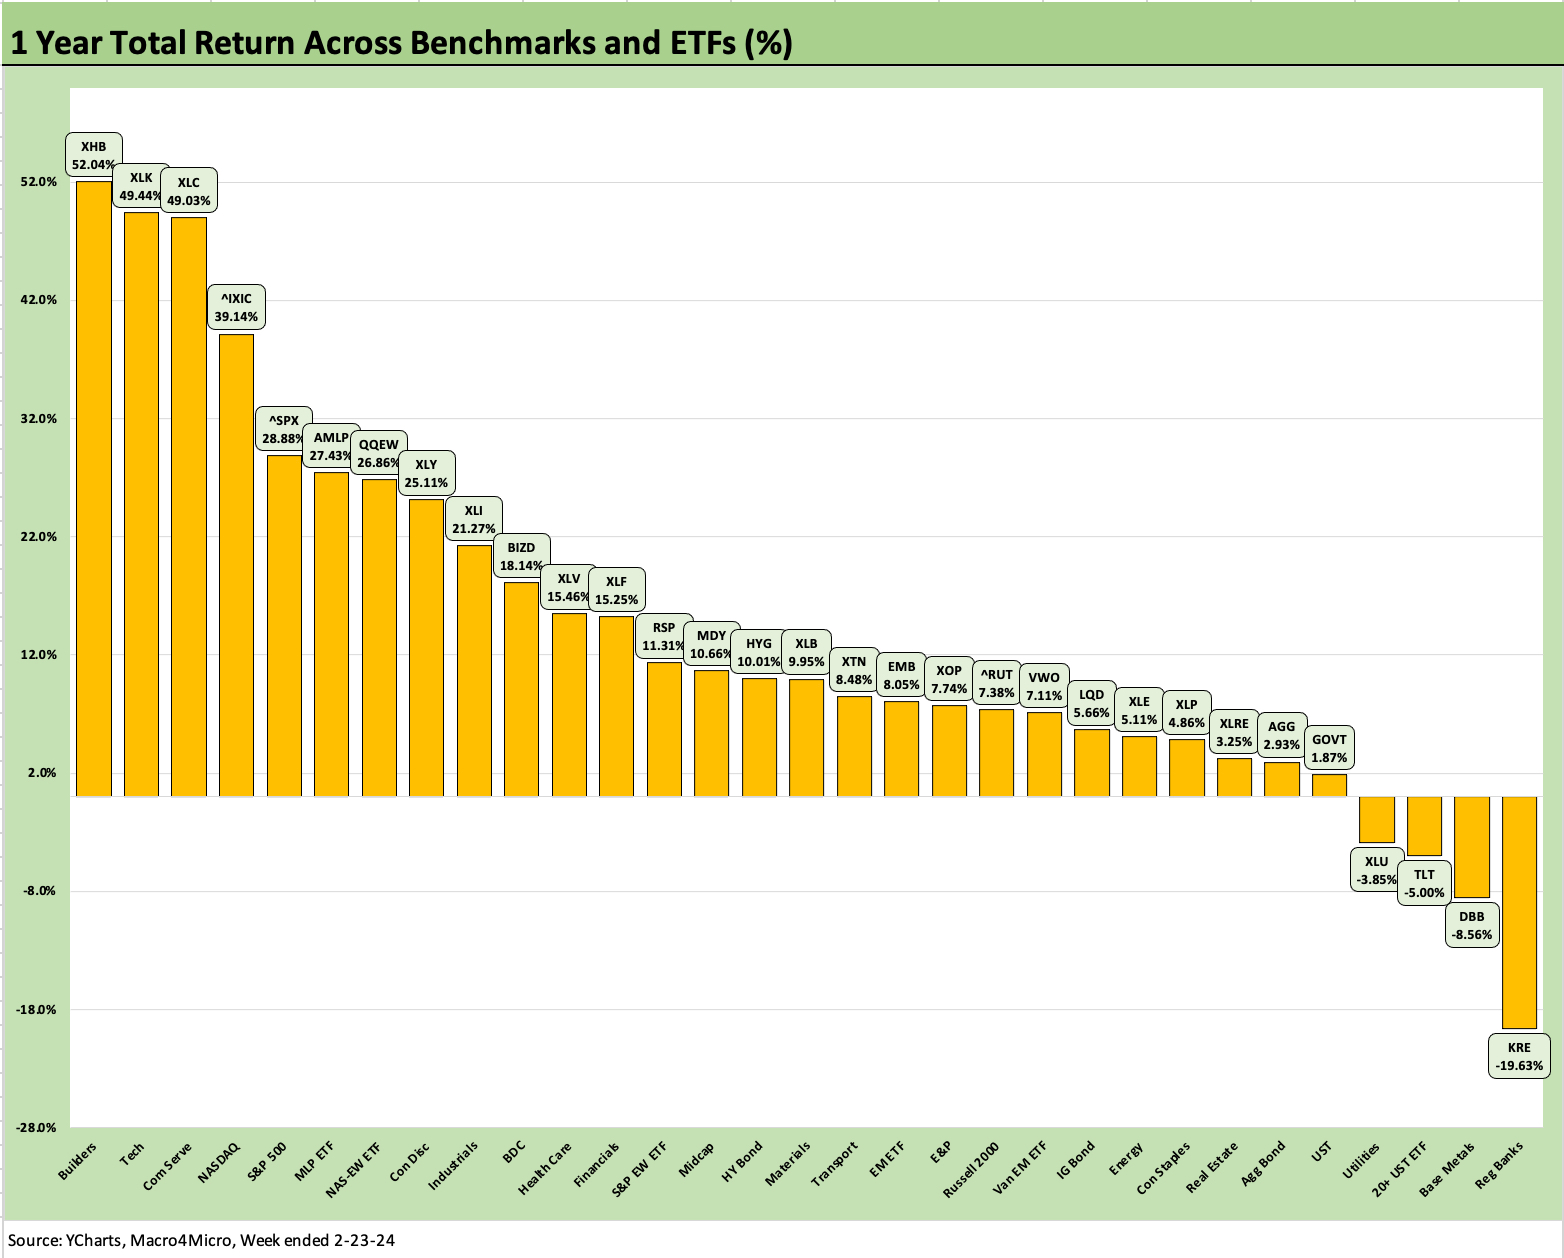
We wrap with the 1-year time horizon that is still holding in well with a small subset in the red at 27-4 and only Regional Banks (KRE) in a double-digit negative range. The Base Metals ETF (DBB) is second to last as global cyclical worries and notably in China set the sundial for that asset class. The duration-sensitive 20+ Year UST ETF (TLT) remains negative and interest-sensitive Utilities the last of the negatives at 4 off the bottom.
The Hi-Lo total return range of 71.6 total return points make a statement on active management hopes and dreams for two mainstream sectors of Homebuilders vs. Regional Banks while throwing out the Hi-lo names still leaves the gap at a 58 point differential for Tech ETF vs. Base Metals. The double-digit positive count is 16 of the 31 north of +10% and 9 of the 31 above +20%. That is a very good LTM.
See also:
BB vs. CCC: Quality Spread Differentials, Yield Relationships, Relative Returns 2-20-24
HY vs. IG Quality Spread Differentials and Comparative Returns 2-6-24
BBB vs. BB: Revisiting the Speculative Grade Divide Differentials 2-5-24
Histories: Asset Returns from 2016 to 2023 1-21-24
Credit Performance: Excess Return Differentials in 2023 1-1-24
Footnotes & Flashbacks: Asset Returns 1-1-24
Footnotes & Flashbacks: State of Yields 1-1-24
Return Quilts: Resilience from the Bottom Up 12-30-23
HY Refi Risks: The Maturity Challenge 12-20-23
Coupon Climb: Phasing into Reality 12-12-23
HY vs. IG Excess and Total Returns Across Cycles: The UST Kicker 12-11-23
HY Multicycle Spreads, Excess Returns, Total Returns 12-5-23