


Inflation remains a worry given the mix of variables from cost pressure lags (energy, materials, tariffs) also facing a strange netherworld of Iran and geopolitics. July numbers did not rattle the markets and even showed some stabilization along some critical product lines.
We do see some major risk factors dead ahead on how the USMCA derailment will play out and how Canada will respond to the increasingly incoherent and antagonistic trade policies. Any dose of resource export taxes by Canada would be at the very least negative for numerous commodities chains. “Commodities” CPI is already at 3.9% and “commodities less food and beverages” is at +4.5%. Energy has enough problems already without Canada slapping export taxes on the discounted heavy crude grades favored by US refiners.
Our favorite special aggregate indexes are still a darker cloud relative to historical levels with “All items less shelter” well into 3.0% handles vs. the 1% and 2% handles in 2024 to 2025.
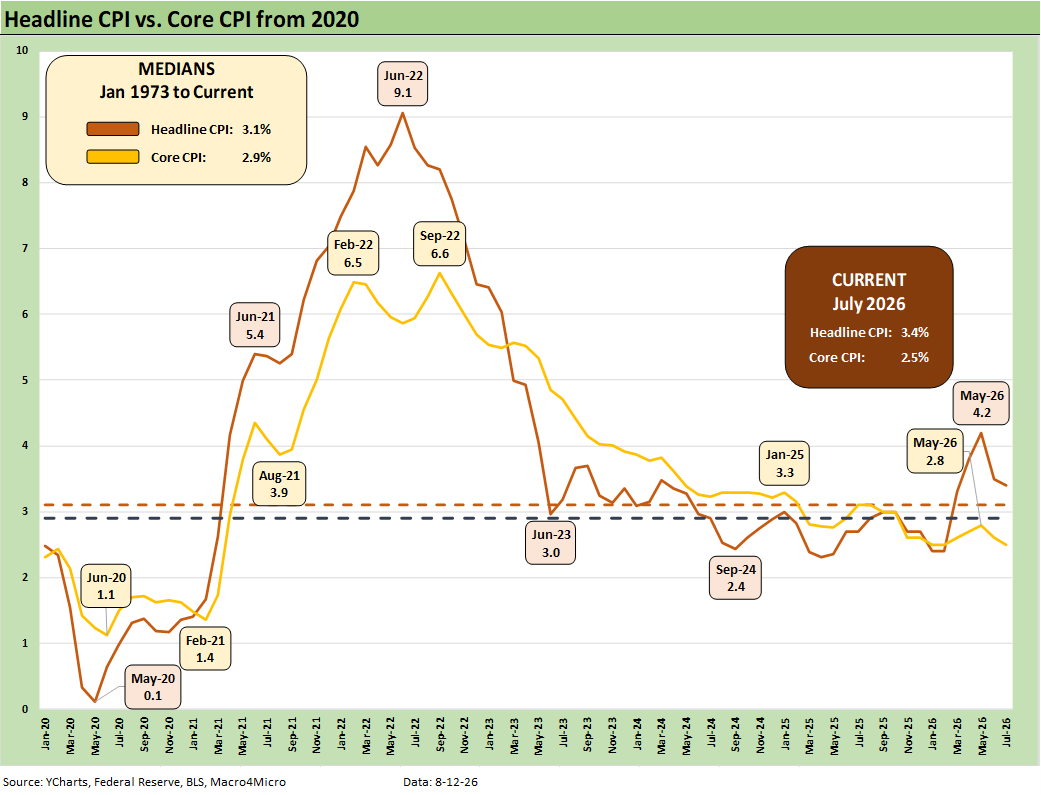
The above time series plots the headline CPI and Core CPI from the COVID plunge into the supply-demand imbalance year of 2021 and then into the Russian-Ukraine oil spike of 2022. Inflation spiked to a 9.1% headline CPI in June 2022 and 6.5% Core CPI in Feb 2022 edged out by the 6.6% of Sept 2022.
The inflation roots and causes can face more than a few debates between the monetarist zealots and the sea level “goods and services pricing power” crowd. It is safe to say that recent low 3% handle nominal wage growth should be framed against headline CPI in how consumers face an affordability headwind.
The role of food and energy in the life of a consumer is no small matter. Such weak wage growth in the payroll report and the employment cost index tell an ugly story for household cash flow (Payroll Deltas July: Mixed Bag, Mediocre Numbers 8-9-26, Employment Cost Index June 2026: Inflation > Wage Growth 7-31-26)
The cost of the household basket soared under Biden and kept on rising in Trump 2.0 (Team Trump will only agree with half of that view). That has taken a toll on consumer health and undermined savings rates as covered separately (see June 2026 PCE: Inflation, Income, and Outlays 7-30-26). The good news from the macro side is that the Personal Consumption Expenditure growth story rebounded in 2Q26 from a 1Q26 decline (see 2Q26 GDP: Good Underlying Numbers Despite Headline 1.5% 7-30-26, GDP 1Q26 Final: PCE Growth Plunge 6-25-26).
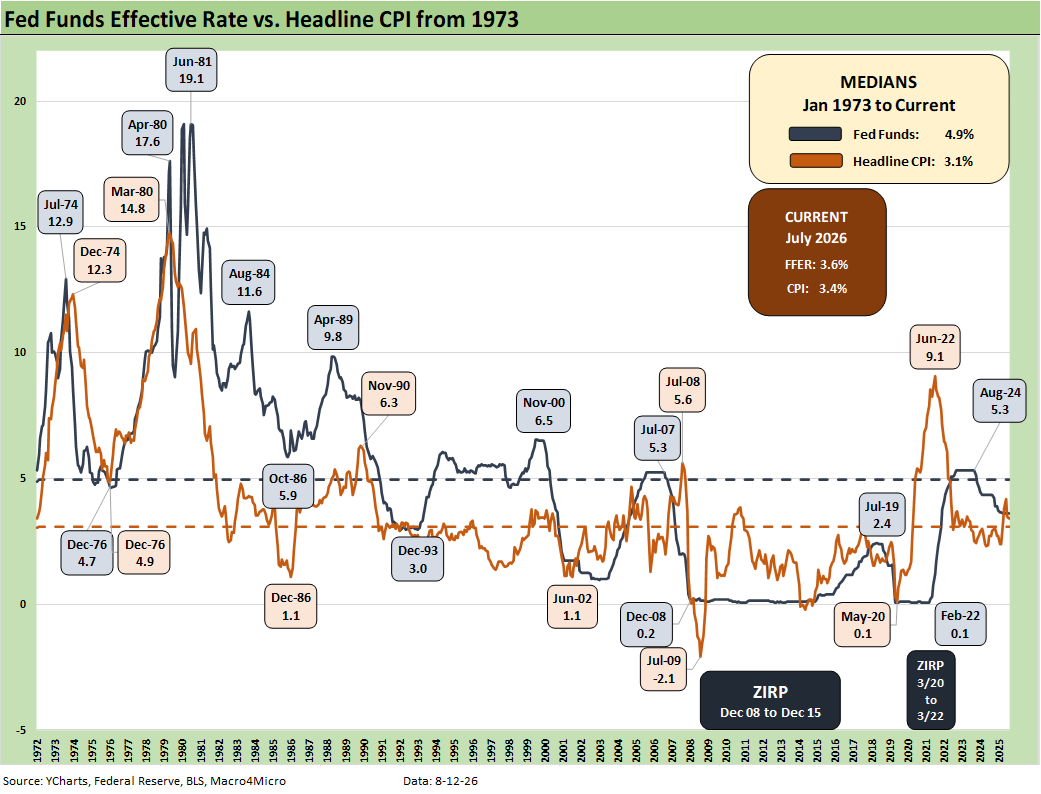
The above chart updates the historical time series for fed funds vs. headline CPI. The latest headline of 3.4% for July is at least back below the 4% threshold after ending 2024 (Biden’s last full month) below the 3% line at 2.9%. The chart includes the long-term medians, which underscore that the current compression of CPI and fed funds is “not normal.”
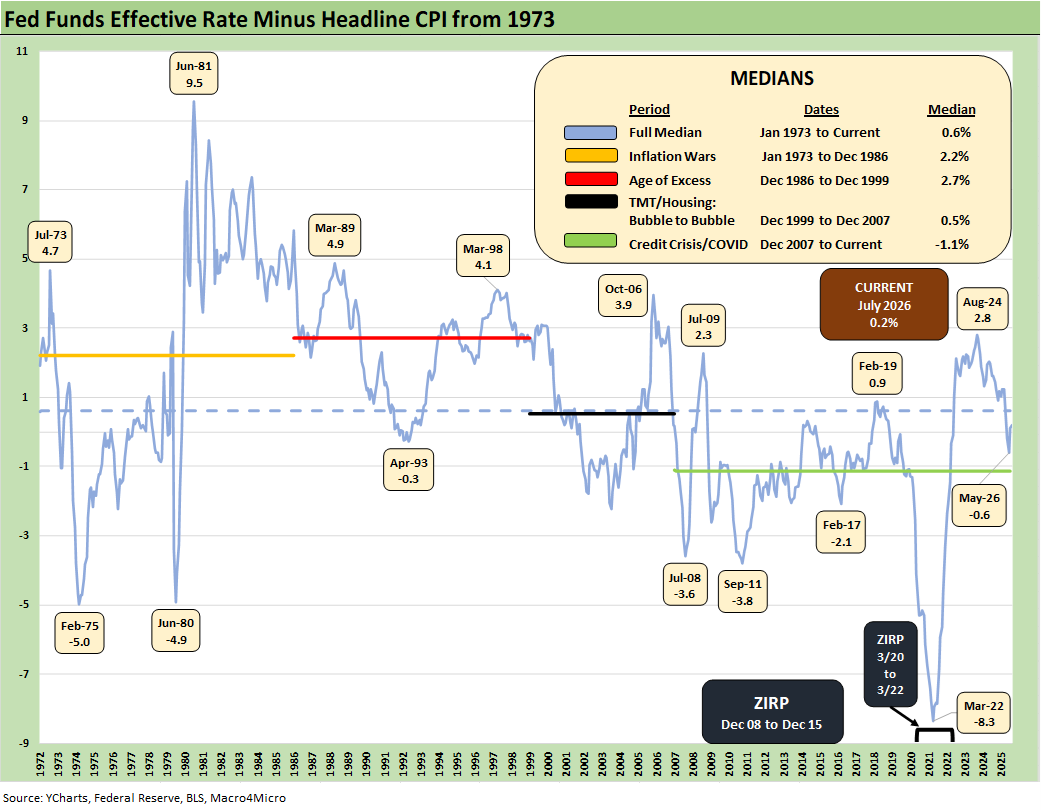
The above chart frames the fed funds vs. CPI differential. Fed funds minus CPI is now +0.2% after it had turned negative in May at -0.6 or dramatically different than the long-term median of +0.6%. In its simplest terms, that relationship looks more like accommodation.
FOMC odds are dim from here. As we go to print, the Vegas odds (CME FedWatch) show the odds of no change in fed funds by the Dec 2026 FOMC meeting at 22.5%, 1 hike at 45.1%, 2 hikes at 27.5%, and 3 hikes at 4.9%.
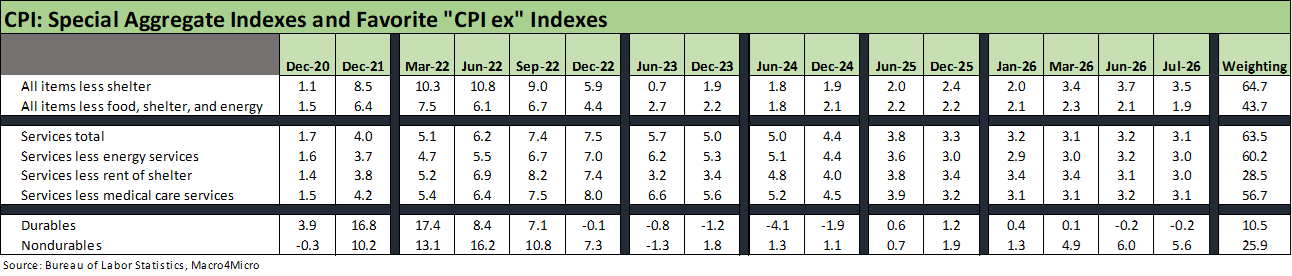
The customized special aggregate CPI indexes posted in Table 3 of the BLS release are troubling in historical context even though there was improvement in July 2026 from June. Those detailed above are our favorites, but there is a long list worth reviewing.
Note: We had to be selective in the months included in the table in order to to show more of the timeline. May 2026 was an especially challenged month (see CPI May 2026: The 4% Rubicon 6-10-26).
“All items less shelter” has been our top pick across time as we have cited in prior research since “Shelter CPI” comes with too many asterisks and derived numbers that do not fit the typical household reality (or even close).
The chart shows “Services” still stubborn above the 3% line in what is a “services economy.” The Services line comprises 63.5% of the CPI index. Table 3 also drives home the stark differential between the Durables CPI (-0.2%) at a 10.5% weighting in the CPI and the much larger Nondurables line at +5.6% CPI for 25.9% of the CPI index. The ability (or desire) to pass through tariff costs has still not hit Durables CPI yet in any meaningful way.
The 3.5% for the “All items less shelter” metric in June is better than the 4.1% in April and the 4.7% of May with the energy spike. Even at the 3% handle now, that metric is still a material contrast with the sub-2% levels of 2024 including 1.9% in Dec 2024 (Biden’s last month). In mid-2023, the level was +0.7%. The FOMC was doing its job the right way by then, and the payroll additions of those 2023 days crushed what was posted for June 2026 and the negative payroll numbers for July 2026 (see Payroll Deltas July: Mixed Bag, Mediocre Numbers 8-9-26, Employment Situation June 2026: Back to a Crawl 7-2-26).
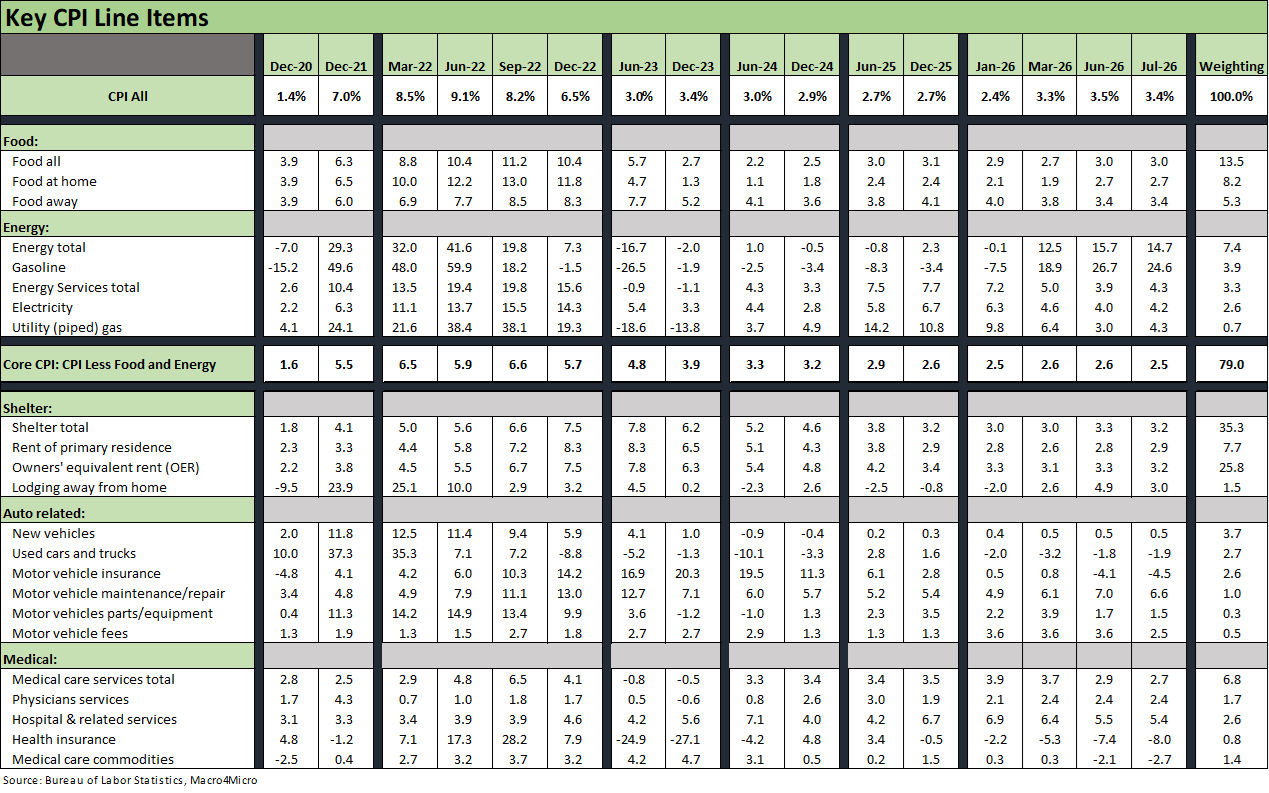
The above table details our Big 5 subsectors for CPI. These roll up to around 75% of the CPI index, so overall this mix of 5 broad categories is the main event even if there are plenty of line items outside this group that matter to consumers.
We will not give much space to our long-held view on the low value of the lines that are “derived” and inconsistent with the household “checkbook experience” and household cash flow. That is notably the case with shelter and the steep deflationary number of -8.0% for health insurance. Some of those lines speak for themselves at a time when such items as ACA premiums have soared and the deductible offerings are shifting the mix in the wrong direction. Too many people have had to drop coverage or see deductibles spike to find “affordable” health care. There are times when the measurement theories of the BLS econ teams do not work with the real world consumer experience.
The total energy bucket of -1.5% MoM is worse than the -5.7% energy relief of June but is a long way from the +10.9% MoM in March after the onset of the Iran War. The “Energy commodities” line was at +21.3% MoM in March and that set off a chain reaction with lag times.
Energy YoY metrics are down sharply from +23.5% in May to +15.7% in June and +14.7% in July. Within energy, the gasoline CPI of +24.6% in July is ugly but beats the +40.5% gasoline CPI of May. With the Strait of Hormuz “shut” again, the war enters a stage of uncertainty on how long and how damaging. Handicapping odds of escalation or any other scenario is a mug’s game at this point.
As we go to print, WTI is at $82 and Brent is near $88. WTI had a $68 handle in the first week of July. That was a short reprieve.
Housing and healthcare anomalies…
The higher costs of housing are uglier when including financing and the monthly payment pain even if the CPI metrics do not capture that effect. Mortgages and the cost of financing do not get factored into the product line CPI. The UST curve and mortgages and auto financing are clearly going in the wrong direction in 2025-2026 and very likely could get worse.
With many households crushed by health care premiums (notably the ACA), the consumer is certainly not “feeling the deflation” in health insurance seen in the table. Those that struggle with coverage then get held hostage to the rising costs of services as broken out. The 5.4% for “hospital and related services” is high by any measure with 5.8% for the outpatient subset. In other words, if you lose coverage, that is what awaits you with prices high in absolute terms. Trump’s lack of effort in health care is one of the worst consumer headwinds and notably in the lower part of “the K.”
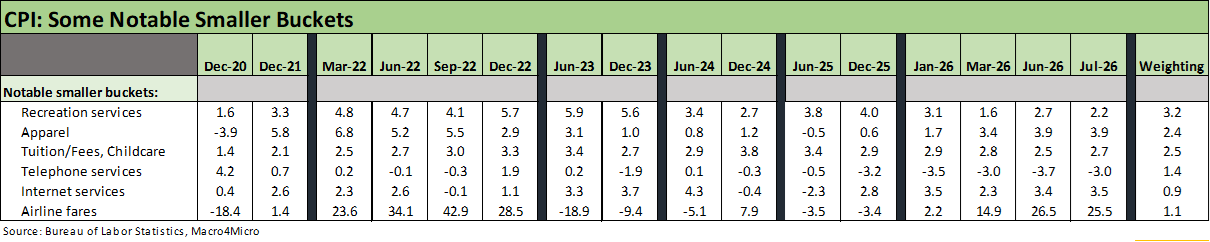
The above table updates some of the lines near and dear to households. Airline fares at +25.5% in July are heavily tied to jet fuel costs. These lines are a mixed picture with divergences across lines within these buckets.
The Apparel CPI was flat at 3.9% after reaching 4.8% in May. Trump looked to inflict pain on the low-cost Asian countries, and we are surprised it is not higher. Trump lost on IEEPA and that had heavily targeted Asia. Trump is now using the Section 301 “forced labor” strategy to raise tariffs on essentially all trade partners. He is also turning to a more flexible provision of Smoot Hawley of 1930 (Section 338).
See also:
The ChatGPT Living Wage Test 8-11-26
Market Commentary: Asset Returns 8-11-26
Existing Home Sales July 2026: Slow Row 8-11-26
Market Commentary: The Curve 8-10-26
Payroll Deltas July: Mixed Bag, Mediocre Numbers 8-9-26
The Curve: Steeper, Inflation Anxiety Remains 8-2-26
Employment Cost Index June 2026: Inflation > Wage Growth 7-31-26
June 2026 PCE: Inflation, Income, and Outlays 7-30-26
2Q26 GDP: Good Underlying Numbers Despite Headline 1.5% 7-30-26