


Seriously, he said they are “low-keying it?”
An overwhelmingly positive return week with solid breadth across the benchmarks and major industries also saw a UST curve rally and positive returns for bond ETFs. This week brings gut check time on CPI and PPI and more setbacks in the Middle East.
We already looked at jobs and the UST curve, and the FOMC handicapping and market tightening odds remain a challenge with jobs weak and real wages still in negative range.
Oil prices are back in modest war premium mode from Friday while some inflation reports this week should give some signals on how the earlier cost pressures and refined product turmoil are flowing into the line items. People are starting to pay more attention to the diesel crisis.
The game theory around the US-Iran War will not be a case study in strategic positioning in future years. The “don’t put your hand on a hot stove” rule is not groundbreaking. That is especially the case if your ego will not let you take your hand off quickly. The strait is effectively still closed, and the Iran blockade is in place. Ships are being fired upon by both sides.
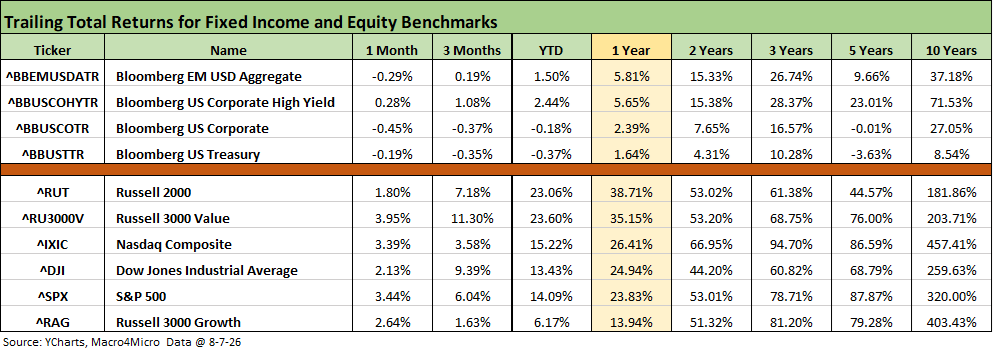
The timeline returns for the debt and equity benchmarks we monitor still show a rough stretch for bonds over 1 and 3 months despite this week’s curve rally. We already reviewed recent curve action in a separate piece (see Market Commentary: The Curve 8-10-26).
Equities are posting a strong month with “value” modestly better than “growth” the past month. The 3-month numbers are very impressive and the 1-year returns overall are a multiple of the long-term annual returns on the equity asset class.
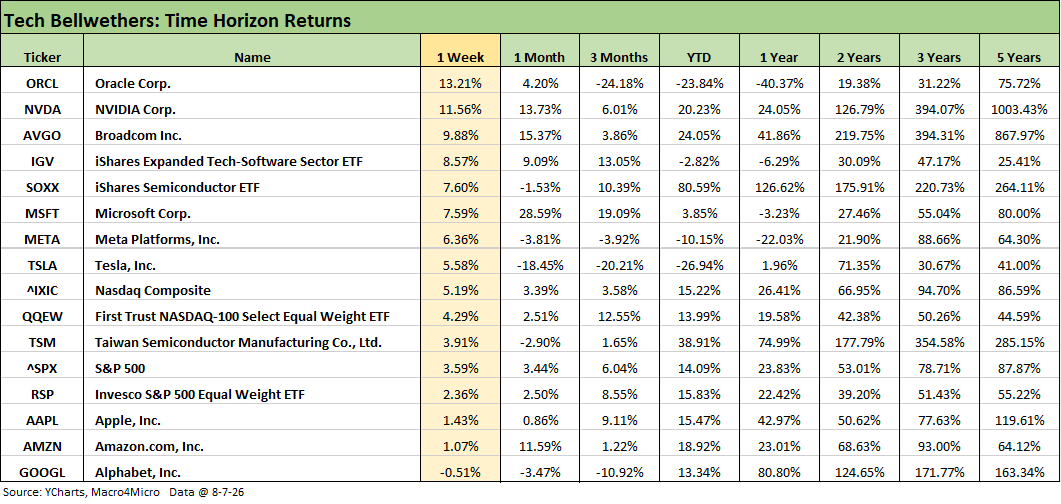
Last week’s performance by tech bellwethers shows all positive returns with a minor exception from Alphabet (GOOGL) on the AI management personnel headlines. The 1-month and 3-month time horizons show much wider divergence across the names as covered in earlier commentaries.
The 1-week commentaries are edited cut-and-pastes from separate LinkedIn posts:
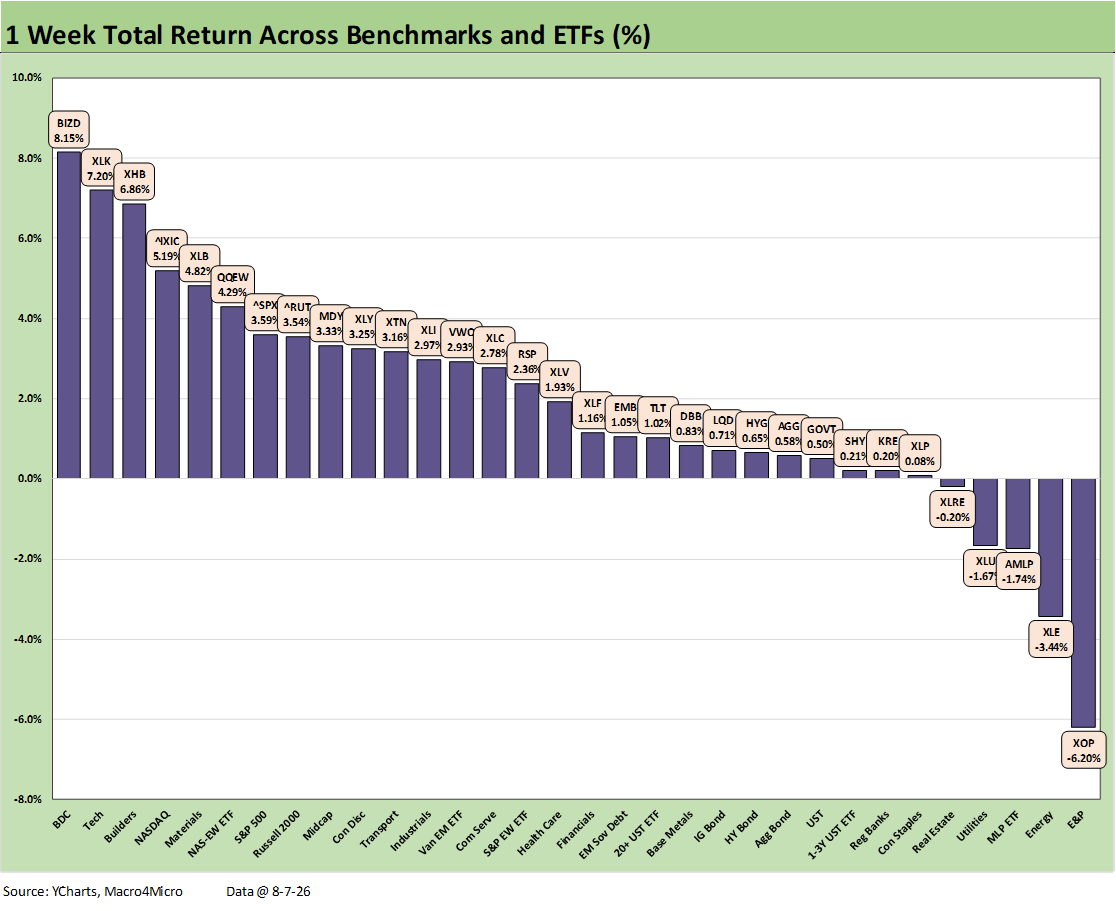
The chart highlights a banner week for equities that also saw all 7 bond ETFs in the positive zone. The top quartile has 3 of the 4 broad benchmarks (NASDAQ, S&P 500, and Russell 2000) with the Midcaps just across the line at the top of 2nd quartile. Rounding out the high quartile was the chemicals-heavy Materials ETF (XLB) with the Equal Weight NASDAQ 100 ETF (QQEW).
One asset line that stands out in the pack is the BDC ETF (BIZD) at #1 which had a sharp rally. The earnings season was underway for the major BDC names, and the stock performances were solid even if just on the absence of very bad news built into prices. The BDC gloom and doom did not play out in earnings and/or dividends even though dividends still face downside risks and asset quality trends and valuation/mark confidence will still feel the burden of a dark view of asset carrying values.
The BDC structural risks as publicly traded portfolios of private credit and equity do not share the same structural and liquidity risk factors as a major private fund facing the sword of redemption Damocles in an illiquid market.
For BIZD, we looked at some of the lead exposures plus a handful of the larger names, and it has been a very good month for the stocks. BIZD ranks #1 for the week and the month and has now even broken into slight positive return range YTD. That is qualified praise as the constant market laggard over 1 year and YTD.
We see the Tech ETF (XLK) at #2 and Homebuilder ETF (XHB) at #3. Builders and suppliers posted an interesting rally despite the lingering pressures of mortgage rates and slower volumes with a weaker price backdrop. Existing home sales posted another small decline this morning and housing starts are releases next week for some more color on housing and builders.
With only 5 of 32 lines in the red, we saw a sell-off in energy ETFs on optimistic war news with E&P (XOP), Energy (XLE), and Midstream (AMLP) in the bottom 3. That will be changing with Iran’s hostile weekend activities. We even got a fresh round of LEGO propaganda. Utilities (XLU) and Real Estate (XLRE) round out the 5 lines in negative range.
For the bond ETFs, the UST rally supported duration and bond returns for the week in what was otherwise a rough 1-month period for bonds that posted 5 of 7 in the red for the month. Only HY (HYG) and the short UST 1-3Y ETF (SHY) were slightly positive (1-month covered separately).
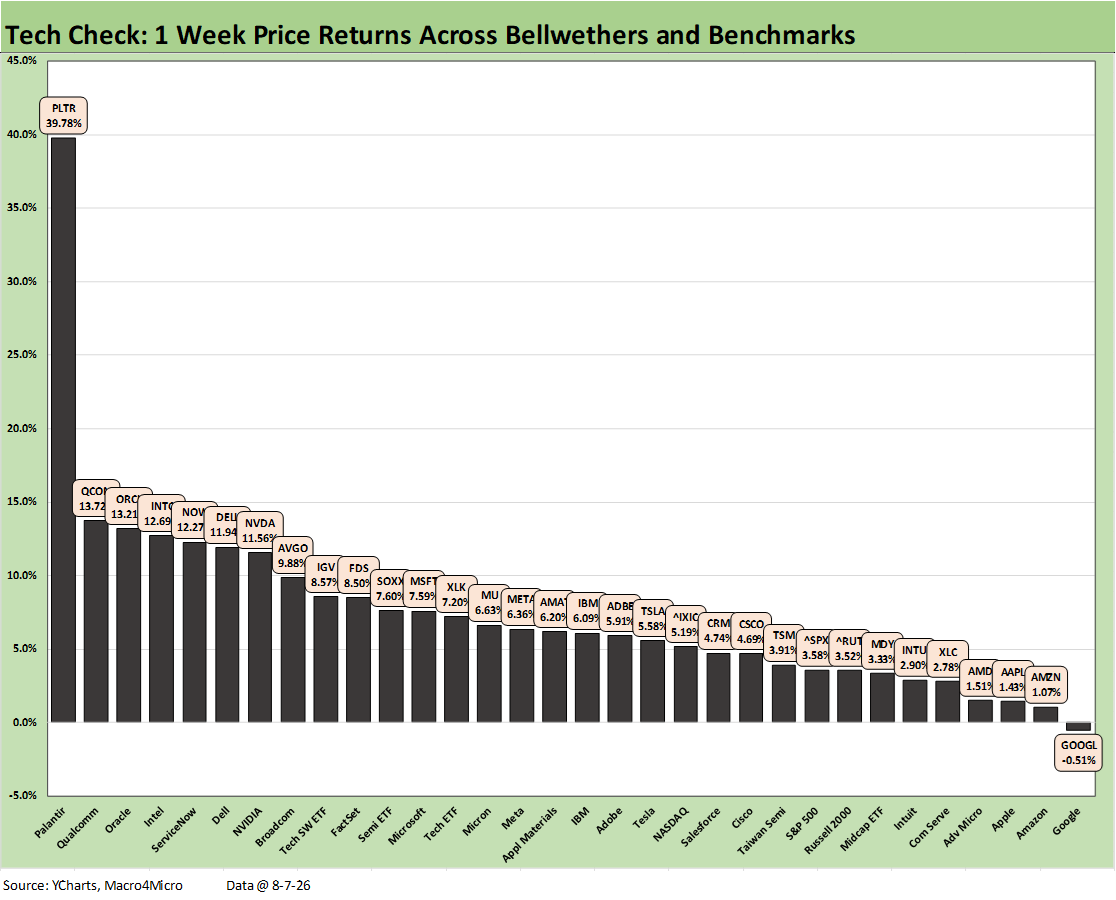
The tech check returns tell an easy story for the mix of the 32 asset lines we monitor. We see a score of 31-1with only Alphabet (GOOGL) slightly in the red on some AI management headlines. The Mag 7 generally have had their struggles with 3 of the 7 (TSLA, META, GOOGL) in the red for the month (chart to follow).
The positive returns across semiconductors, software, and SaaS-based services operators are modestly more commingled this week than some of the stark divergences seen in recent reporting periods.
Qualcomm (QCOM), Intel (INTC), NVIDIA (NVDA), and Broadcom (AVGO) made the top quartile, but the software lineup overall edged out semis on the balance of returns. We see the Software ETF (IGV) at +8.6%, which was ahead of the Semiconductor ETF (SOXX) at 7.6%. Both IGV and SOXX were in the 2nd quartile.
Palantir (PLTR) was the home run hitter on the week with its earnings report and guidance. Oracle was among the top 5 names with some SaaS names less clustered with ServiceNow (NOW) in the top quartile and FactSet in the upper end of the 2nd quartile a few notches ahead of Microsoft (MSFT). MSFT and PLTR lead the group over the trailing 1-month period.
Micron (MU) dropped down the ranks a bit into the lower half of the 2nd quartile with Applied Materials (AMAT). Taiwan Semi (TSM) fell off the pace into the 3rd quartile while Advanced Micro (AMD) dropped into the bottom quartile despite its solid earnings report. The Tech ETF (XLK) was well positioned in the middle of 2nd quartile, but Communications Services (XLC) sat in the bottom quartile.
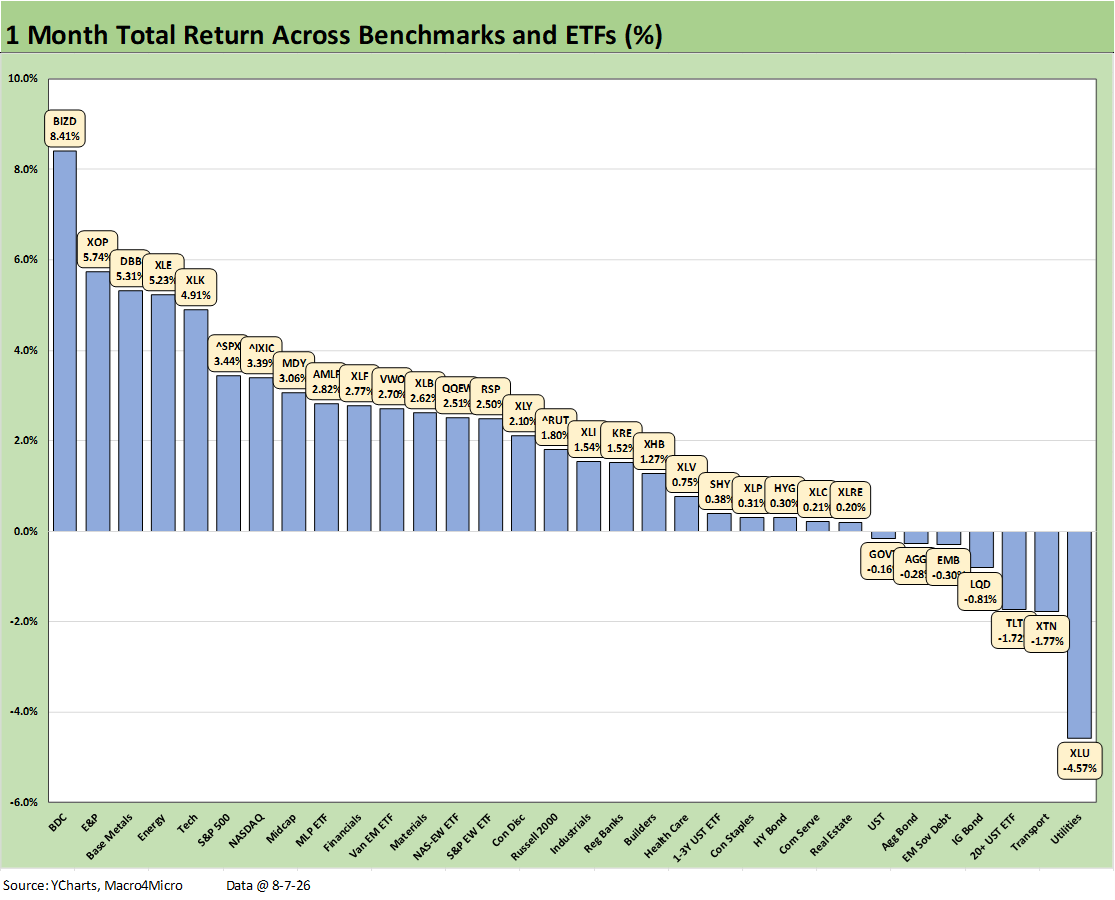
The 1-month return mix posts an impressive 25-7 score with 5 of the 7 negative returns coming from the bond side of the allocation as duration was hit. We see Utilities (XLU) in last place with Transports (XTN) in 2nd to last rounding out the negative returns.
As already covered in the weekly return comments above, a notable anomaly in the mix was the BDC ETF (BIZD) at #1 on the month as well as in the weekly. BIZD was a second quartile performer over the rolling 3 months. The BDCs firmed up despite the justified lingering concerns around the quality of marks (carrying values, reserve adequacy, etc.) and the potential for more strains in asset quality and rising defaults.
One theory on BDCs is the sector was “priced to destruction” and thus overdone and the earnings season – while showing plenty of challenges – was not as bad as the pricing. With the cycle stabilizing and better top-down macro numbers, that added to a better sense of discomfort (rather than heightened fear). That goes under the heading of faint praise tied to value and cash dividend paying ability.
Another angle is that the structural risks of a BDC with its loan/equity portfolio and its relative operating and credit risk are different than a massive private credit fund facing redemption demands. In the end, the manager’s skills in underwriting, the quality mix, and portfolio monitoring are still a key distinction across the various funds. When so many started chasing a somewhat emerging asset class (even if private loans are certainly not new) on the disintermediation path, the tendency to engage in excess is not a new habit (HY bond, subprime RMBS, structured credit broadly).
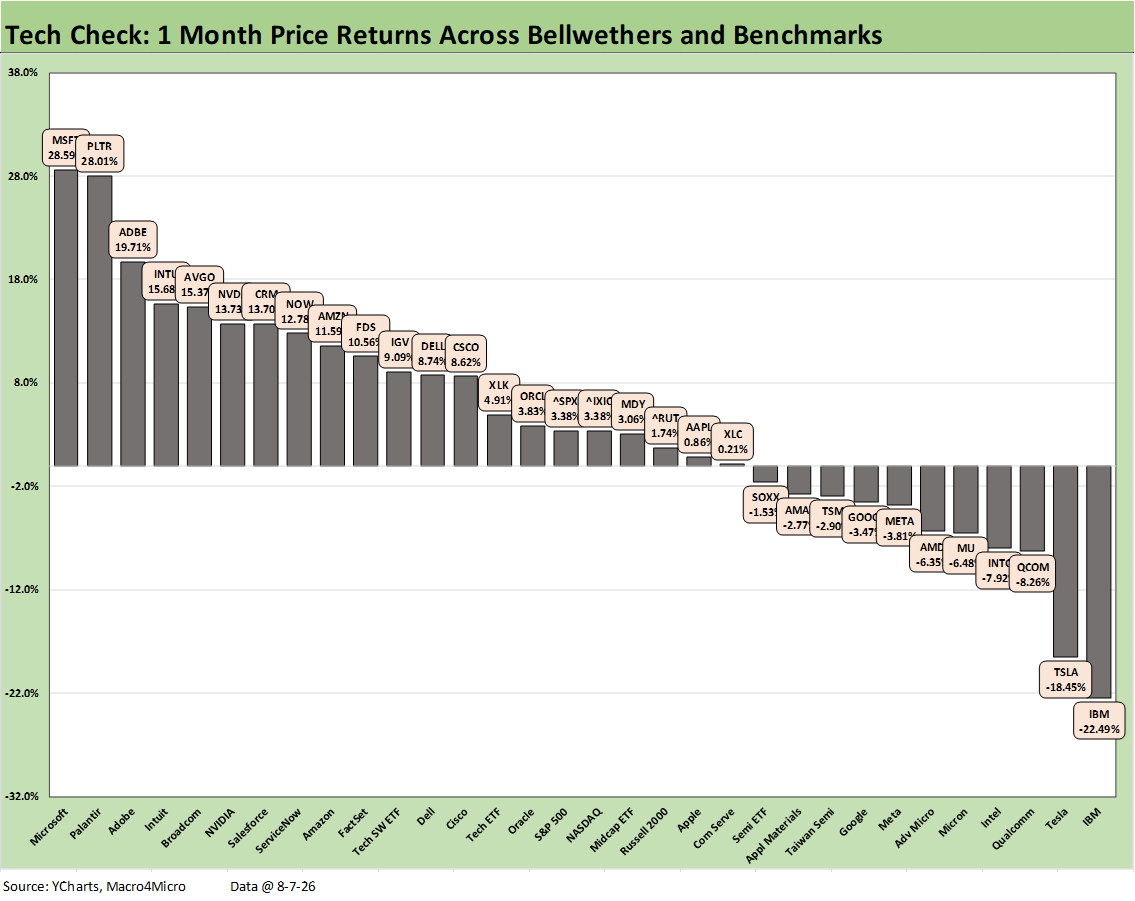
A tumultuous month for semiconductors saw a realignment of relative performance vs. software and SaaS-based service names. The overall score of 21-11 was still favorable, but we see the Semiconductor ETF (SOXX) in the red at -1.53% with the Software ETF at +9.09% for a return differential of 10.6 points on the 1-month period.
Of the 11 line items in negative range, 7 of the 11 were tied to semiconductors, 3 were Mag 7 names (TSLA, META, GOOGL) and the name in last place was legacy multiline tech business IBM at -22.5%.
Software dominated the top quartile with Microsoft (MSFT) #1 at +28.6%, Palantir (PLTR) slightly behind MSFT, Adobe (ADBE) at #3, the long-suffering Intuit (INTU) at #4, and only Broadcom (AVGO) managing to break into the top 5 among the major semiconductor names with NVIDIA right behind it. The remainder of the top quartile included Salesforce (CRM), and ServiceNow (NOW).
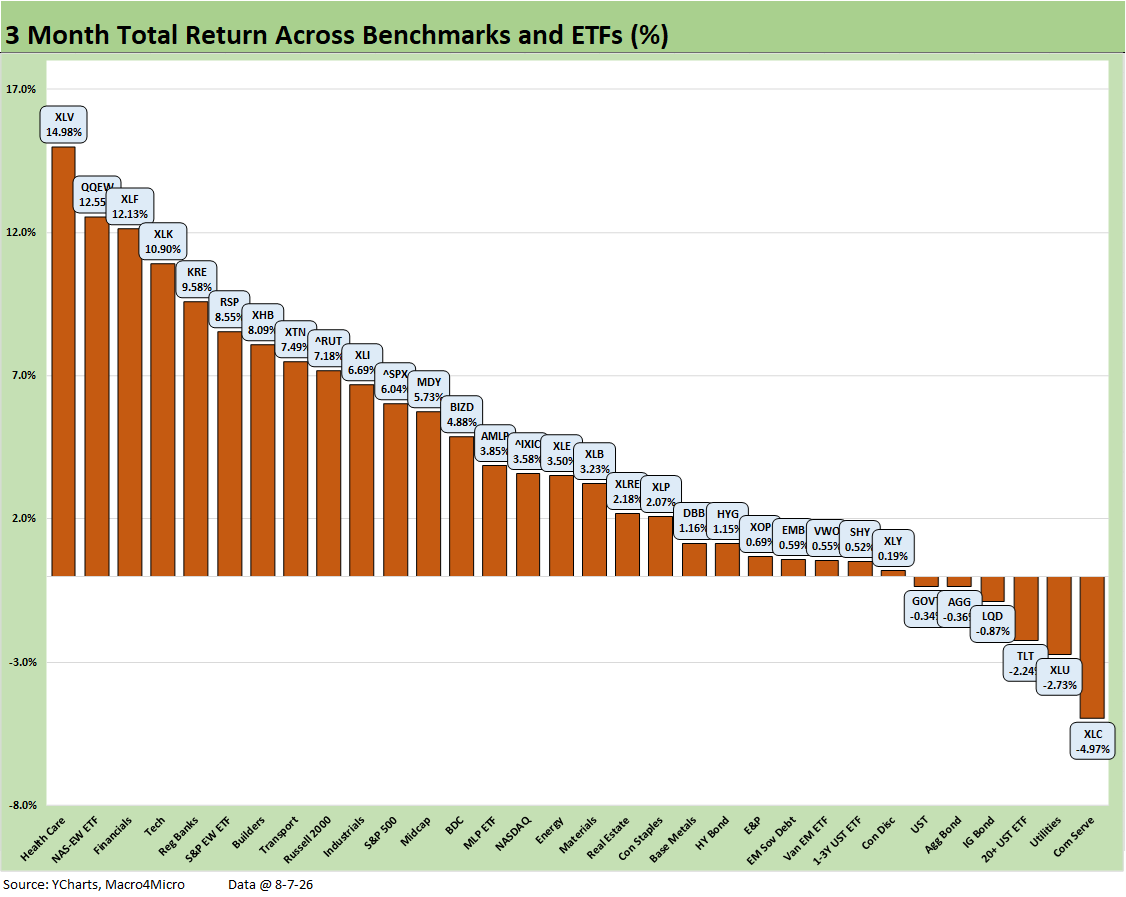
The rolling 3-month returns for the broader group of 32 weighed in with a very solid 26-6 score with 4 of the 6 in negative range from the bond ETF class. We also see Communications Services (XLC) and Utilities (XLU) in the bottom two positions.
The winners in the top quartile reflect a broadly diverse group with Health Care (XLV) at #1 and the top 5 including two tech ETFs with the Equal Weight NASDAQ 100 (QQEW) at #2 and the Tech ETF (XLK) at #4. In a positive sign for the market’s view of curve risks and asset quality and cyclical growth fundamentals, we see Financials (XLF) at #3 and Regional Banks (KRE) at #5. It took a return of 7.49% to make the top quartile with Transports (XTN) just behind Homebuilders (XHB).
Another interesting highlight is the Equal Weight S&P 500 (RSP) at #6 outperformed the S&P 500, the NASDAQ, the Russell 2000, and Midcaps (MDY).
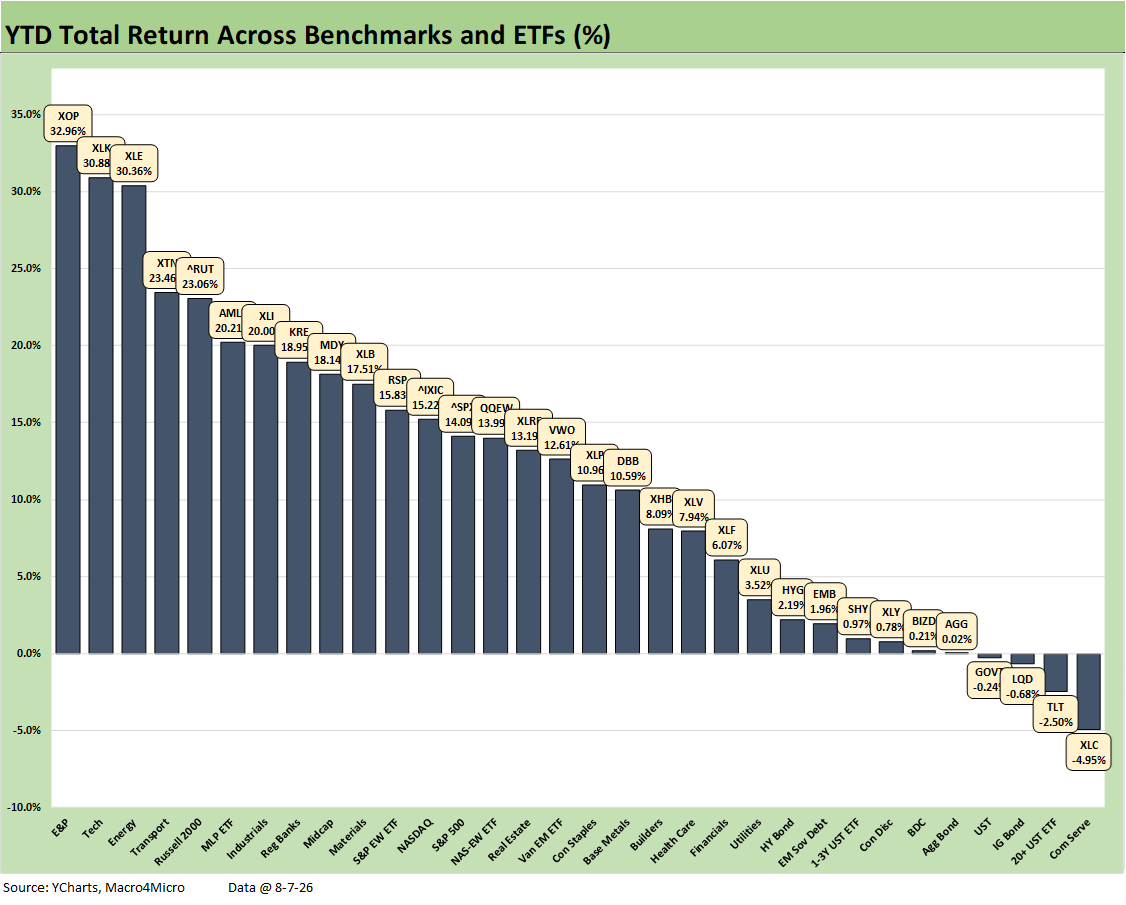
The YTD performance for the broader group of 32 shows a stellar set of results with a score of 28-4 with 3 of the 4 in the red being high quality bond ETFs that were hit by the UST curve shift. Communications Services ETF (XLC) continues to be a laggard with Meta, T-Mobile, Comcast, and Disney among others.
In a sign of a banner year, it took +19.95% (KRE) to make the top tier with E&P (XOP) posting +33% at #1. Other winners in the top tier include Energy (XLE) at #3 and Midstream (AMLP) at #6. We see the Tech ETF (XLK) at #2. The NASDAQ, tech-heavy S&P 500, and Equal Weight NASDAQ 100 were all down in the 2nd quartile. The small cap Russell 2000 made the top quartile. Transports (XTN), Industrials (XLI), and Regional Banks (KRE) are also in the top tier with a favorably diverse mix.
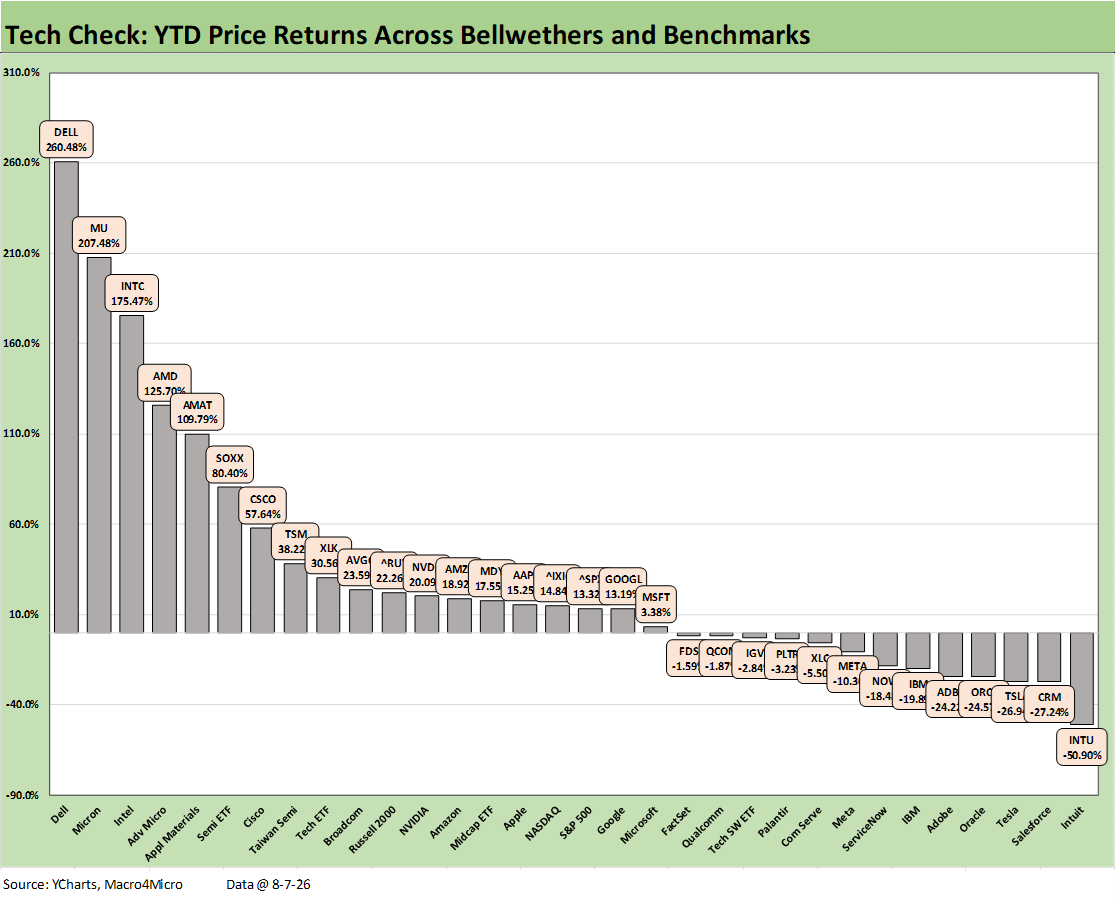
The tech check mix of assets posts a much wider range with the outsized returns and earnings growth of the semiconductor names. This is consistent with the YTD numbers seen in recent months. It took +109.8% (Applied Materials) to make the top 5 and +38.2% (Taiwan Semi) to make the top quartile, which is dominated by semiconductor-related names or others (e.g., Dell) that get swept up in the AI ecosystem including data center equipment.
The bottom quartile has many of the same software and SaaS names we detail each week, but the running YTD negative returns have started to diminish for some in the recent software rally. We see the bottom quartile posting a range from -10.3% Meta (META) down to -50.9% for Intuit (INTU). The bottom quartile has 5 software/SaaS names, 2 Mag 7 (TSLA, META) plus IBM.
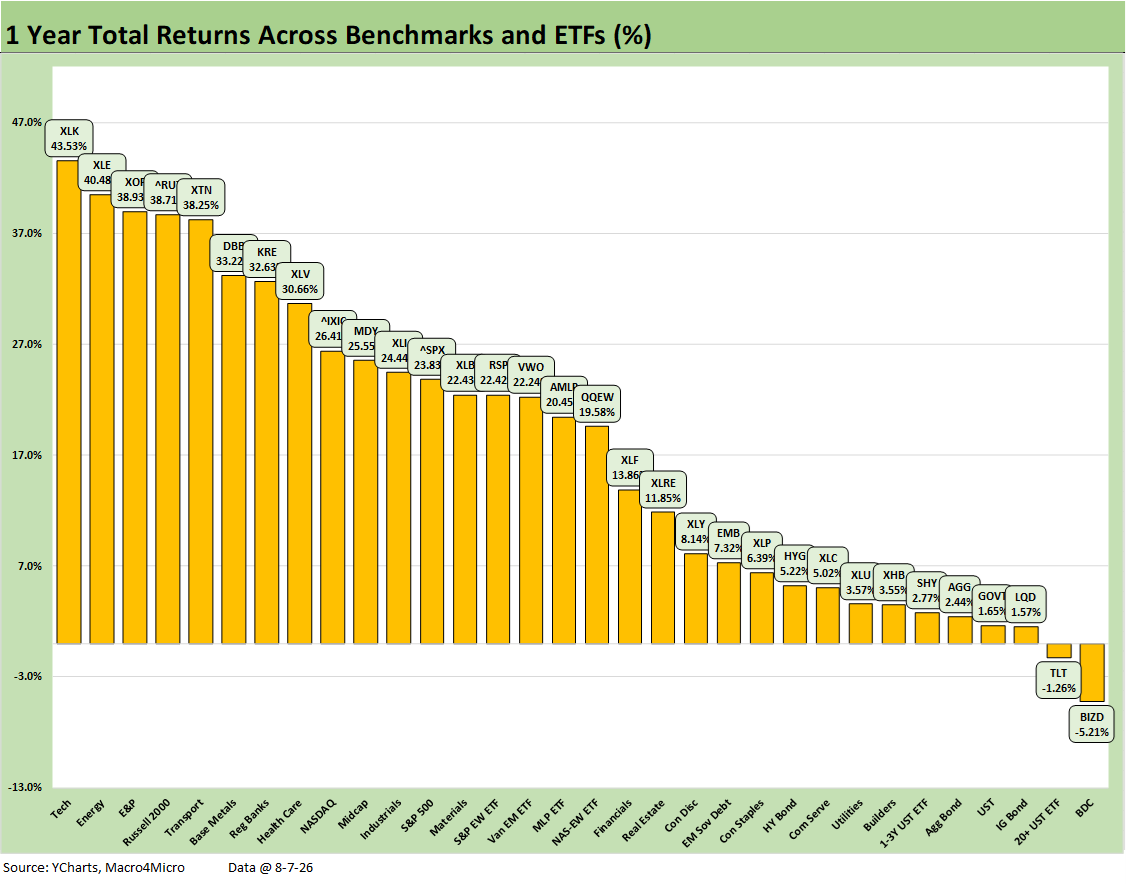
The running 1-year horizon at 30-2 score shows the BDC ETF still in last place but whittling down its negative returns after a good week and month as detailed above. Duration has still been the loser with the long 20+Y UST ETF (TLT) being the only other line posting negative returns. A range of the weakest assets were either bond ETFs or highly sensitive to interest rates (e.g. XHB). Interest rates also hit assets with dividend-heavy profiles (XLU, XLP).
See also:
Market Commentary: The Curve 8-10-26
Payroll Deltas July: Mixed Bag, Mediocre Numbers 8-9-26
The Curve: Steeper, Inflation Anxiety Remains 8-2-26
Employment Cost Index June 2026: Inflation > Wage Growth 7-31-26
June 2026 PCE: Inflation, Income, and Outlays 7-30-26
2Q26 GDP: Good Underlying Numbers Despite Headline 1.5% 7-30-26