


Then again, these are not simple times (FYI: Fonzie supported Ike)
A 3.4% GDP quarter rode a sustained, solid comeback of the consumer in 2Q26 and 3Q26 after an abysmal start to the year in PCE growth when the PCE line weighed in at +0.7%. PCE is almost 68% of GDP. The 3Q26 PCE growth line of 3.8% was boosted by a material increase on the Services line at +4.1% (reminder: Services is more than 2x the Goods line in dollars).
The stock market driver remains the massive fixed investment driven by the AI ecosystem with nonresidential investment at +12.7%. That includes fixed investment at +9.4%. That fixed investment line includes the tech-heavy equipment line at +20.9%, intellectual property at +8.4%, and structures at +5.4%. That is a rare set of numbers in historical context. Residential is still dragging at -3.3%.
Among the quarterly distorters and swing lines in “contribution to % change in GDP,” we see an increase of +1.61% for “change in private inventory” with a GDP haircut of -3.32% for “net exports of good and service” with the export line down slightly and the import line much higher.
The import and export line is where Trump should get a reminder that a strong economy imports a lot of goods – and that includes a massive increase in the Taiwan trade deficit that supports so many other GDP lines (and the stock market). It is no surprise they don’t get asked that question by a docile, cowed media (even CNBC). He would need to admit something.
The Government GDP line also rang up big numbers in changes vs. the preceding period at +5.3% with +15.8% in Federal vs. -0.1% in State and Local. The total contribution to the headline GDP from the Government line was +0.9% (about that ballooning deficit…).
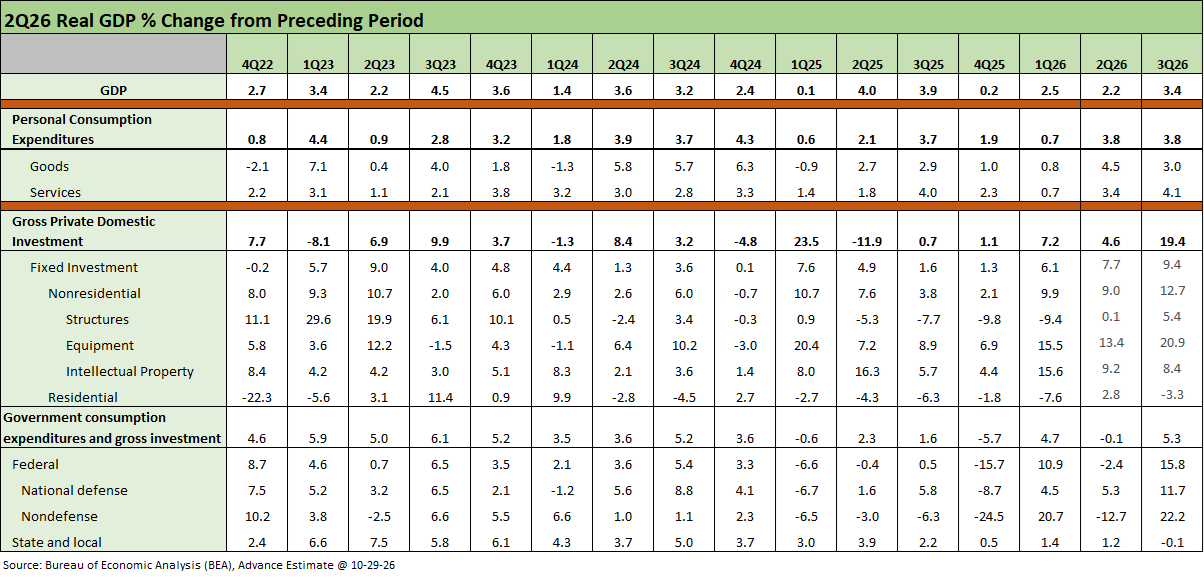
The strong 3Q26 GDP advance estimate story is clear in the numbers.
The GDP table details the breadth of the growth across the consumer and investment lines. The 19.4% in gross private domestic investment (GPDI) remains dominated by the AI ecosystem story and related products.
There are a lot of macro multiplier effects on the other side of the investment lines. As we saw this past week, some of those effects are mass layoffs. That could be a PCE risk factor in later quarters.
In PCE, Goods performed well at +3.0%, but the growth rate was down sequentially from 2Q24’s +4.5%. Nondurables are much larger than Durables. And Nondurables posted +3.4% vs. +2.3% for Durables.
Services rang up +4.1% for highest rate presented in the timeline with 3Q25 2nd highest in the timeline at +4.0%.
Investment lines remain the capital markets headline story even if PCE is almost 68% of GDP. Information and processing equipment has been a major factor, including in trade.
The Personal Consumption Expenditure release is also out today, and we get a more granular breakdown on inflation, which remains a serious problem and rising across numerous product buckets. The PCE release reveals the “what” of the consumer outlays mix and how the price pressure and affordability challenge is leaning on savings rates. Inflation is still running ahead of hourly wage growth, and that means negative real wage growth. We look at that in a separate commentary.
See also:
GDP 2Q26: Bullish Final Revisions 9-30-26
2Q26 GDP: 2nd Estimate 8-26-26
2Q26 GDP: Good Underlying Numbers Despite Headline 1.5% 7-30-26
GDP 1Q26 Final: PCE Growth Plunge 6-25-26
GDP 1Q26 Second Estimate: Shrunk in the Dryer 5-28-26
1Q26 GDP Advance Estimate: Consumer Fade, Investment Boom 4-30-26
4Q25 GDP: More Adverse Revisions in the Golden Year 4-9-26
Some “distortion” stories of past GDP reports:
3Q25 GDP: Morning After Variables to Ponder 12-27-25
2Q25 GDP: Second Estimate, Updated Distortion Lines 8-28-25
2Q25 GDP: First Cut of Another Distorted Quarter 7-30-25
1Q25 GDP Advance Estimate: Roll Your Own Distortions 4-30-25