
PCE Prices, Income and Consumption: Goals and Assists
More good news on inflation goals with a recent assist from consumer moderation.


The market sees more sustained improvement in headline PCE inflation (+2.6%) and Core PCE (+3.2%) with Nov 2023 even generating a negative monthly headline PCE number at -0.1% after a 0.0% in Oct and Core PCE for the month at only +0.1%.
PCE price progress comes on top of the favorable revisions cited in the final 3Q23 GDP and shows improvement alongside favorable economic indicators.
The handicapping of Fed cuts for 2024 is getting into one-upmanship mode on UST decline forecasts even as some Fed members push back and get noisy.
Favorable income trends remain in place, while the savings rate ticked higher to 4.1% from a revised 4.0% in Oct and 3.8% in Sept.
The PCE inflation drill this month is easier than usual since so much of it is already in expectations. The final 3Q23 GDP this week showed more favorable revisions to PCE (see 3Q23 GDP Final Cut: Swing and a Miss on 5%, Good Contact on PCE Prices 12-21-23).
For the month, the PCE price monthly line at -0.1% rolls up from deflation on the Goods line at -0.7% with Durables at -0.4% and Nondurables at -0.9% while the important Services line weighed in at +0.2%. Many are citing annualized 3-month and 6-month numbers that help the bulls get even more bullish on the cable shows. They certainly make good points on inflation progress.
Away from PCE over in the world of CPI, the CPI ex-shelter line at +1.4% for Nov is on the same page as PCE even if the dominant shelter lines generate less compelling overall CPI numbers and cause some Services inflation stickiness (see November CPI: The Big 5 and Add-Ons 12-12-23).
The inflation battle is now framing up as a tenuous victory, but the battle will continue with geopolitical risk already flowing into potential disruptions in supplier chains (Red Sea, spiking shipping rates, time lags to delivery, etc.). That said, there is also the chance of a change in OPEC (read Saudi) behavior to recapture market share in 2024. That would support inflation declines even more while still offering an economic tax cut to the consumer.
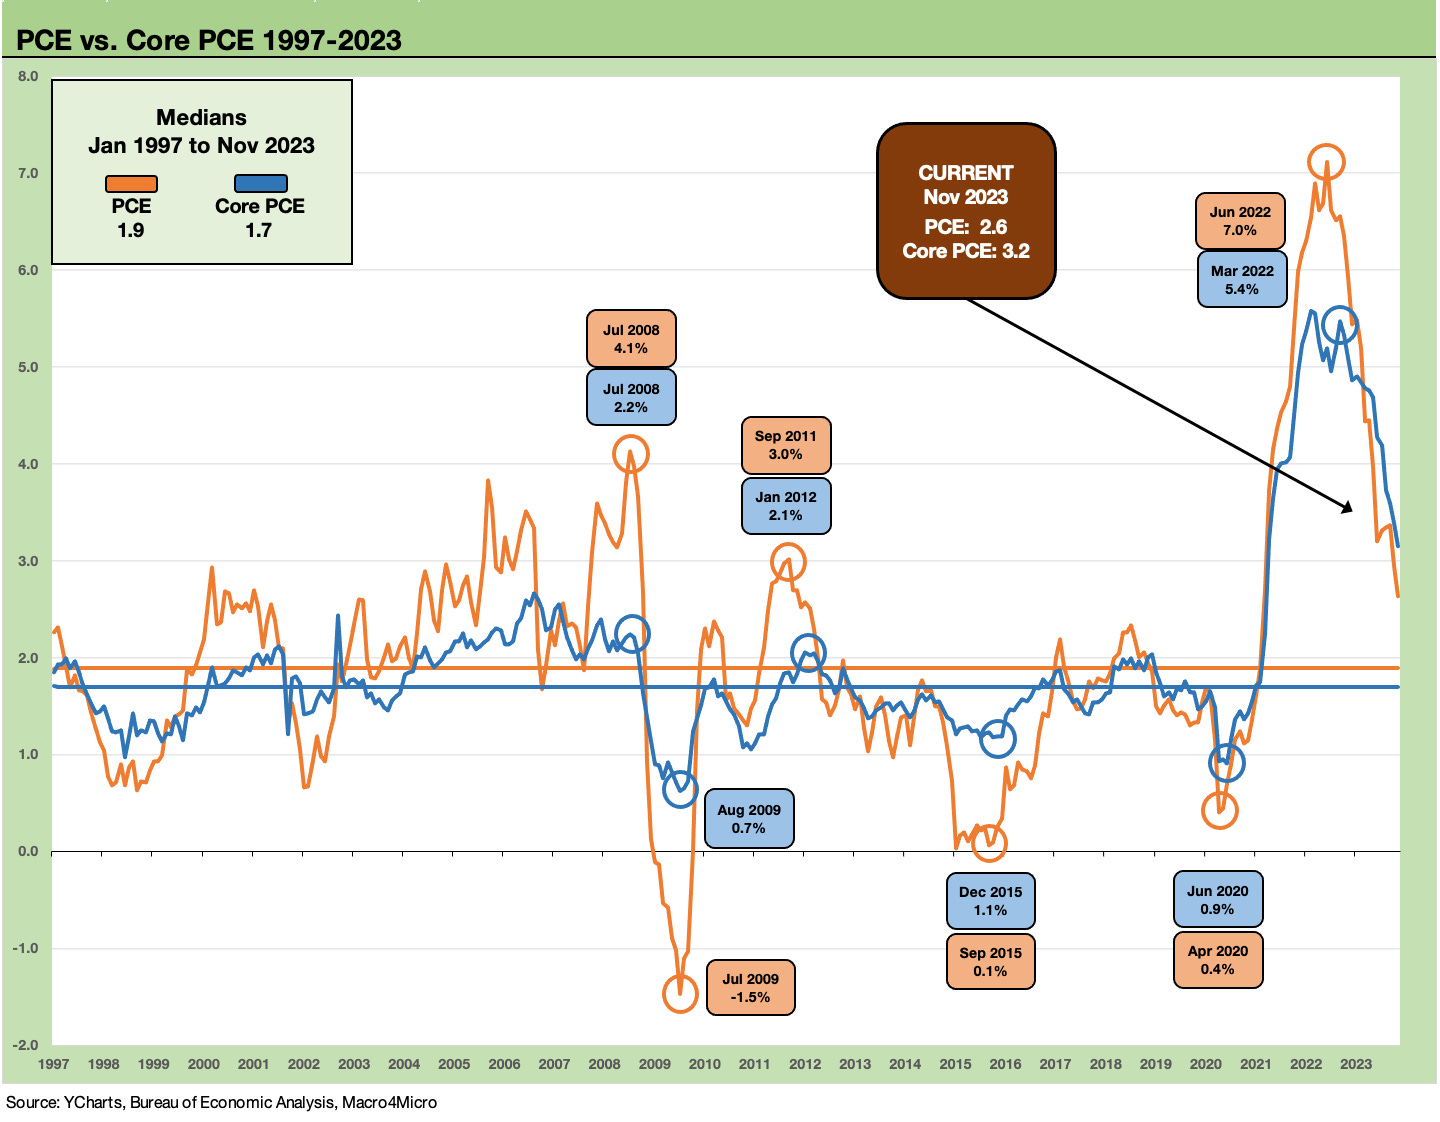
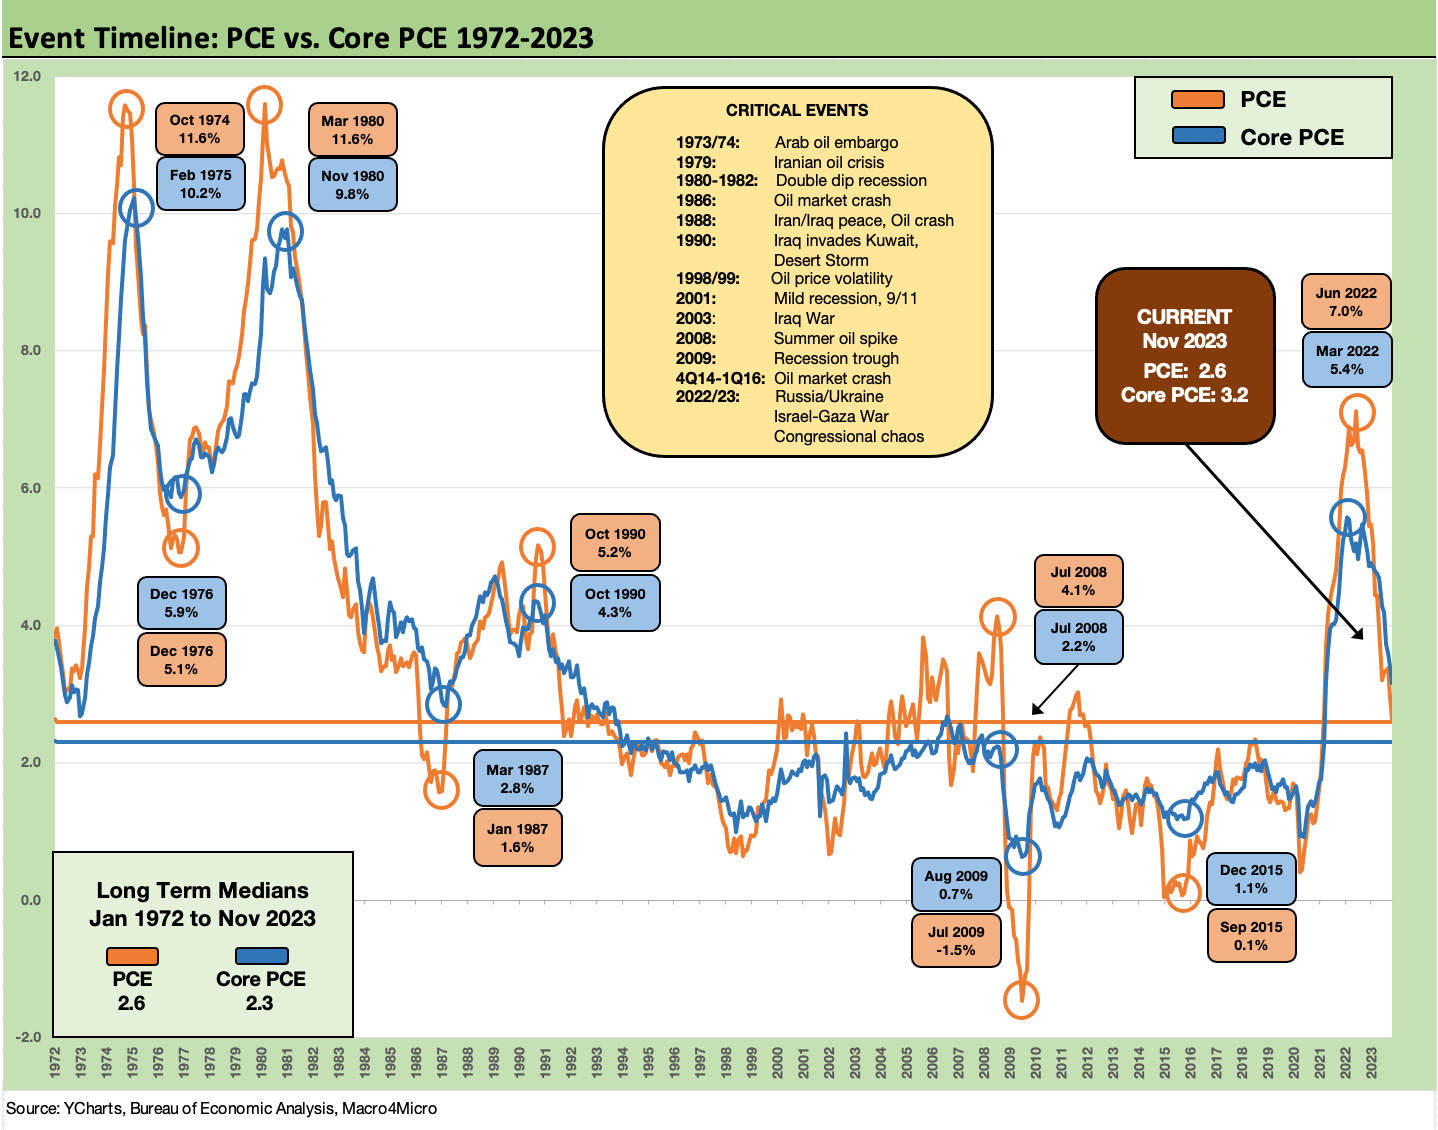
The above chart tracks the timeline of PCE and Core PCE across a shorter timeline of cycles from 1997 to current days. It is easy enough to see where the 2.0% Fed PCE target comes from when you carve out the 1970s and 1980s, where the medians run higher to 2% handles.
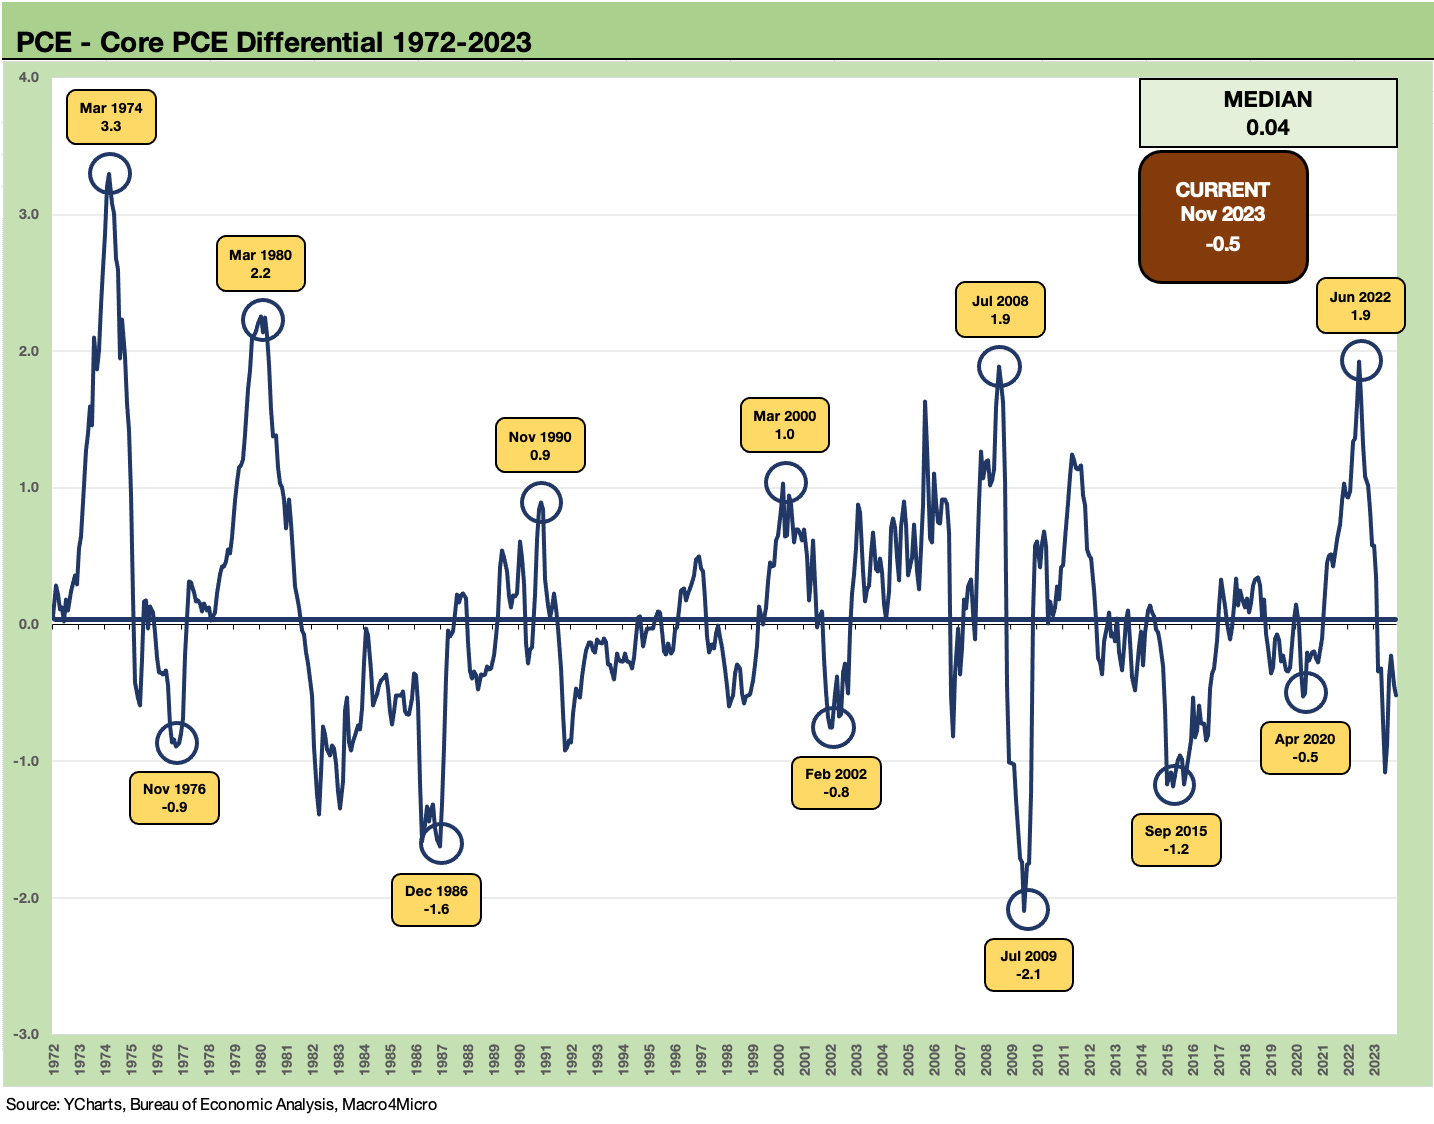
The above chart plots the differentials of headline and PCE across time with the biggest swings tied to the highly volatile energy price X-factor and the role of OPEC in global oil. We currently see headline PCE minus Core PCE back in the negative zone. When the Ukraine-Russia war broke out that popped higher to +1.9 points. Now we see headline and core both declining but PCE – Core in negative range.
With the shale revolution and rise of unconventional drilling, the structural risks to the US are dramatically lower in terms of OPEC-driven macro risks than in past cycles. Investments in LNG projects and record oil exports also create a different set of conditions for headline inflation risk with the bias lower.
With record oil production and record natural gas and liquids production in the US, the “drill drill drill” theme of the “Dictator Day 1 speech” together with Saudi displeasure on oil price and supply quota discipline would appear to bias inflation expectations lower over the intermediate term.
The factually anorexic “lack of energy independence” political campaign theme has been quieter of late since there is so little empirical support to the case with the word “record” attached to so many aspects of oil and gas production including exports.
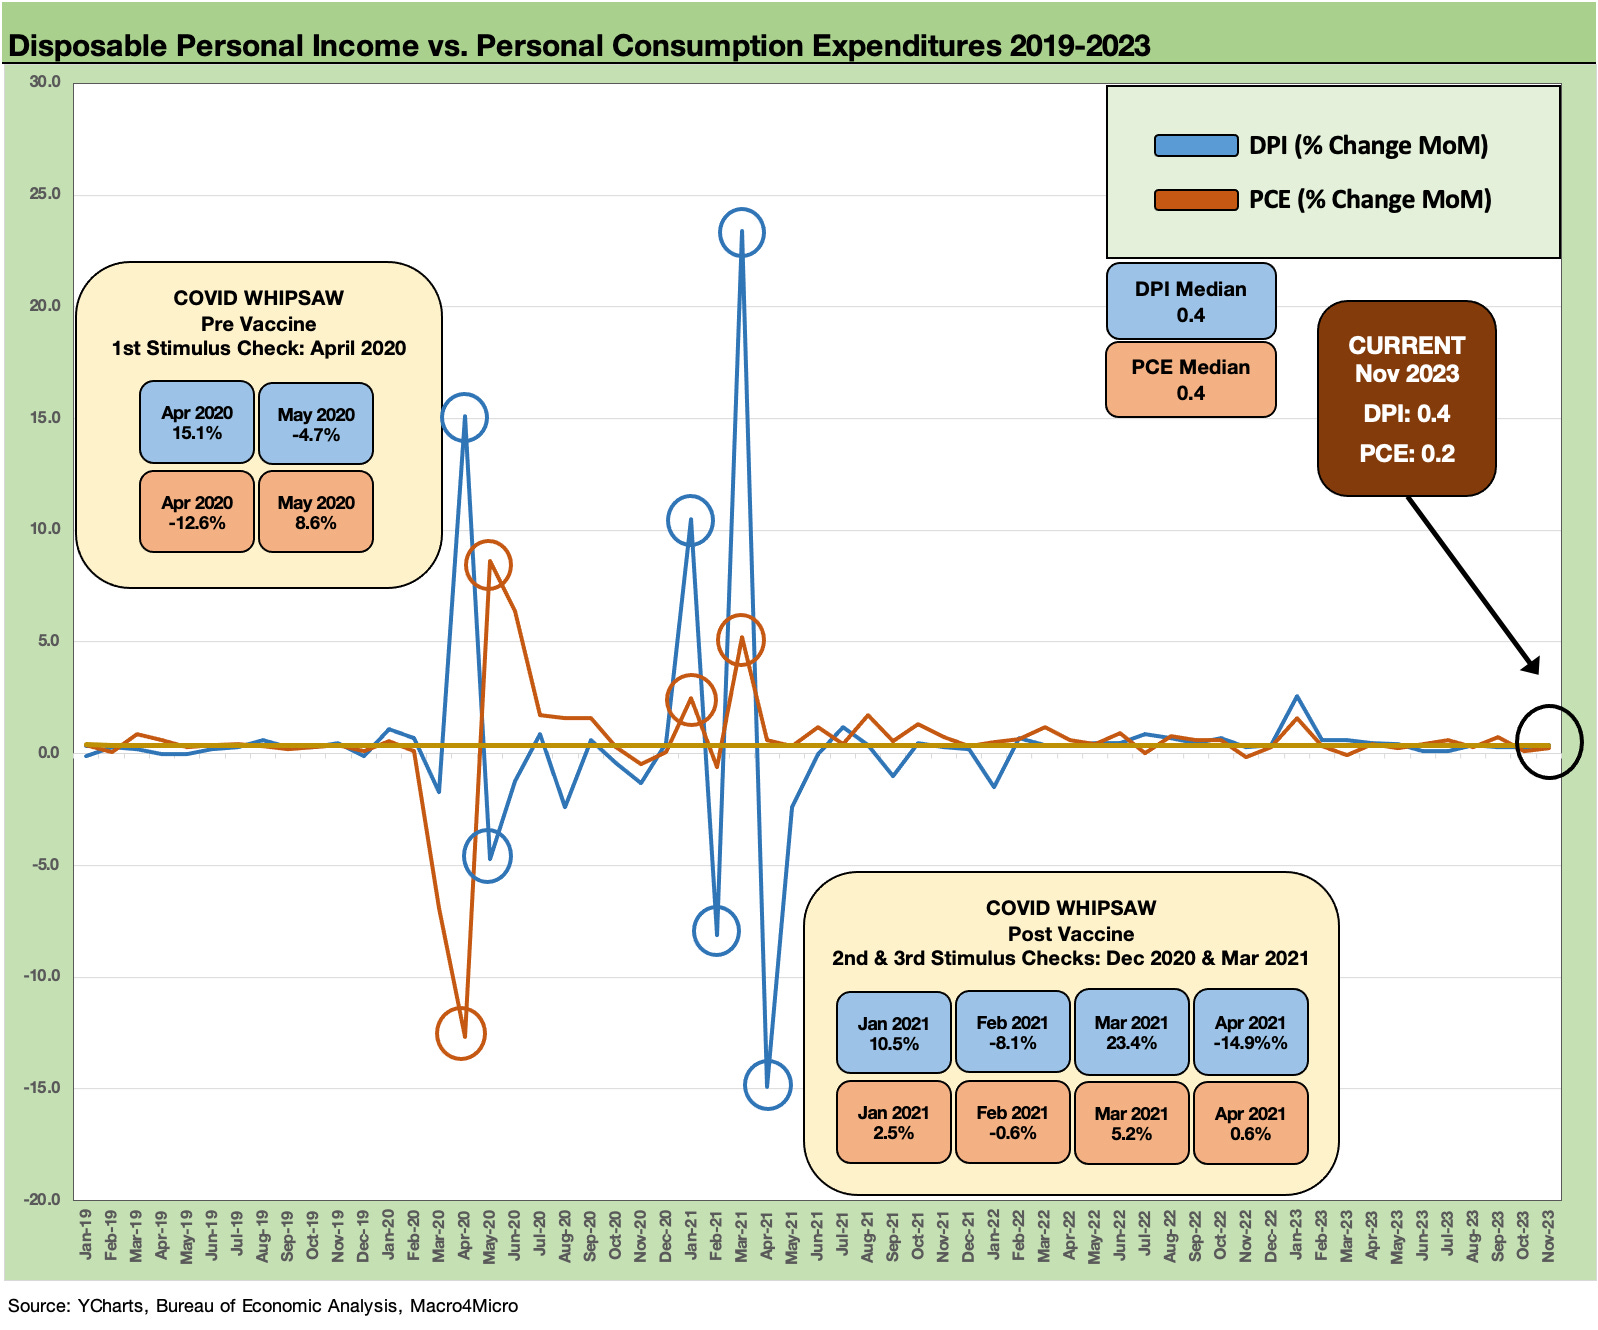
The above chart plots the Disposable Personal Income against consumption, and we see the volatility of the COVID and stimulus period has materially calmed down. The relationship between DPI and PCE has pulled back from the wild swings across the COVID period and is looking more like 2019.
We have looked at that strange period of income spikes on government payments in more detail since there tends to be a lot of political trash talking on policy action and the links to inflation (see Inflation Rorschach Test: Looking at Relief and Stimulus 2-7-23). The cause and effect mechanism just touches on one small aspect of a very complex set of factors. It is more political spin and extrapolation running conceptually naked in the streets.
The main area of disagreement on inflation is on what causes it. For Washington, the reason is “the other party’s fault” but the layers of complexity in the inflation picture go way beyond deficit-funded distributions by Trump and Biden (funny how some only cite Biden’s!).
COVID-driven supplier chain imbalances at a time when legislation and the Fed were looking to drive demand higher all were part of a laundry list of supply-demand shock and side effects. Earlier tariff programs that continued under Biden did not help.
Record profits for shipping companies tell a story. Many freight and logistics operators posted record profits that were significant multiples of prior records. That had to flow into price, and the supply-demand relationships allowed that to happen. COVID and shutdowns in China did not help.
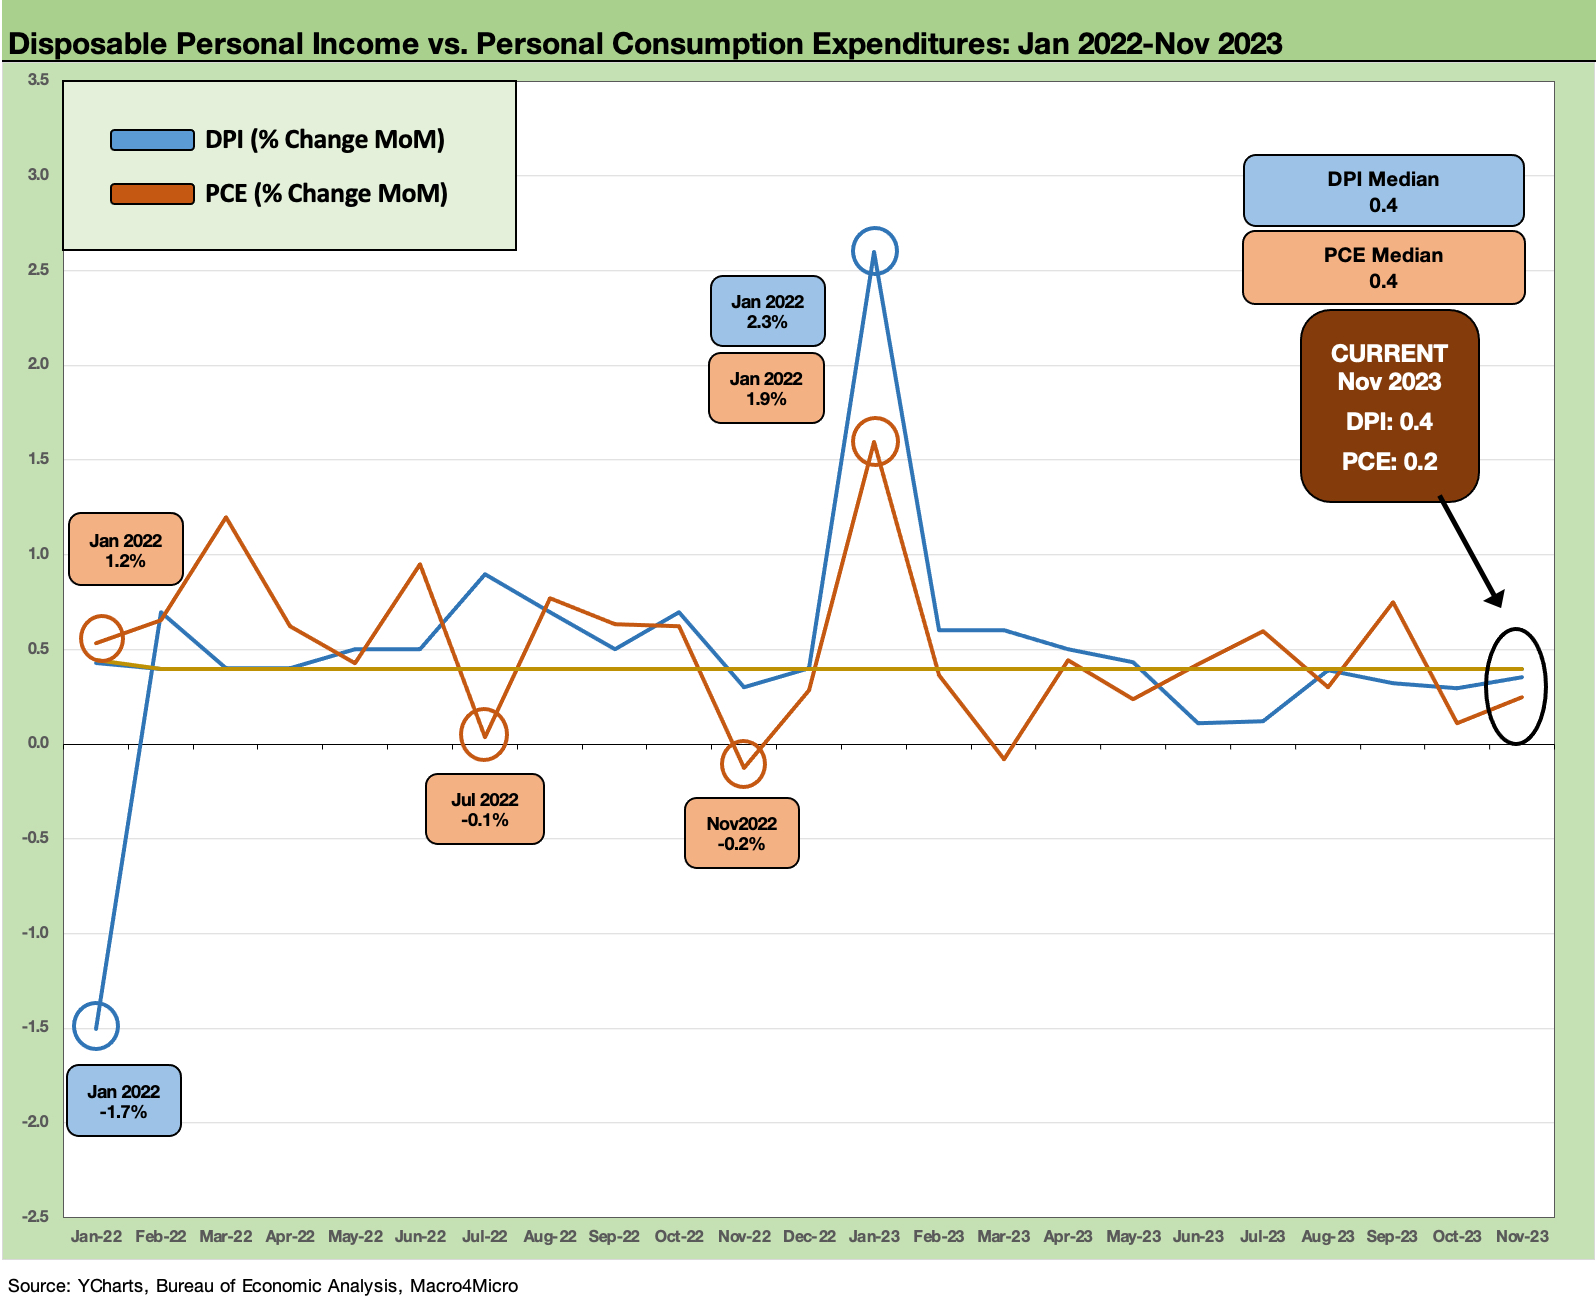
The above chart shortens the time horizon to the tightening cycle. DPI and PCE are now running at the same median, down slightly from recent months. Since the summer, income levels have been solid and steady while PCE has been mixed with the past two months low after the market was rattled by a big spending month in September (see PCE Sept 2023: Consumption Strong, Inflation Steady 10-27-23, Retail Sales: The Consumer is Alive and Well 10-17-23).
We would score this month’s DPI vs. PCE comparison as favorable for the Goldilocks crowd with decent income growth and modest PCE growth for Nov 2023. The inflation numbers already covered that effect.
Tracking the consumer DPI vs. PCE will remain a major part of the exercise heading into 2024. The UST has repriced lower with plenty of questions of what comes next on the front end and short duration segments of the UST curve where a lot of the consumer finance debt is incurred (e.g., autos).
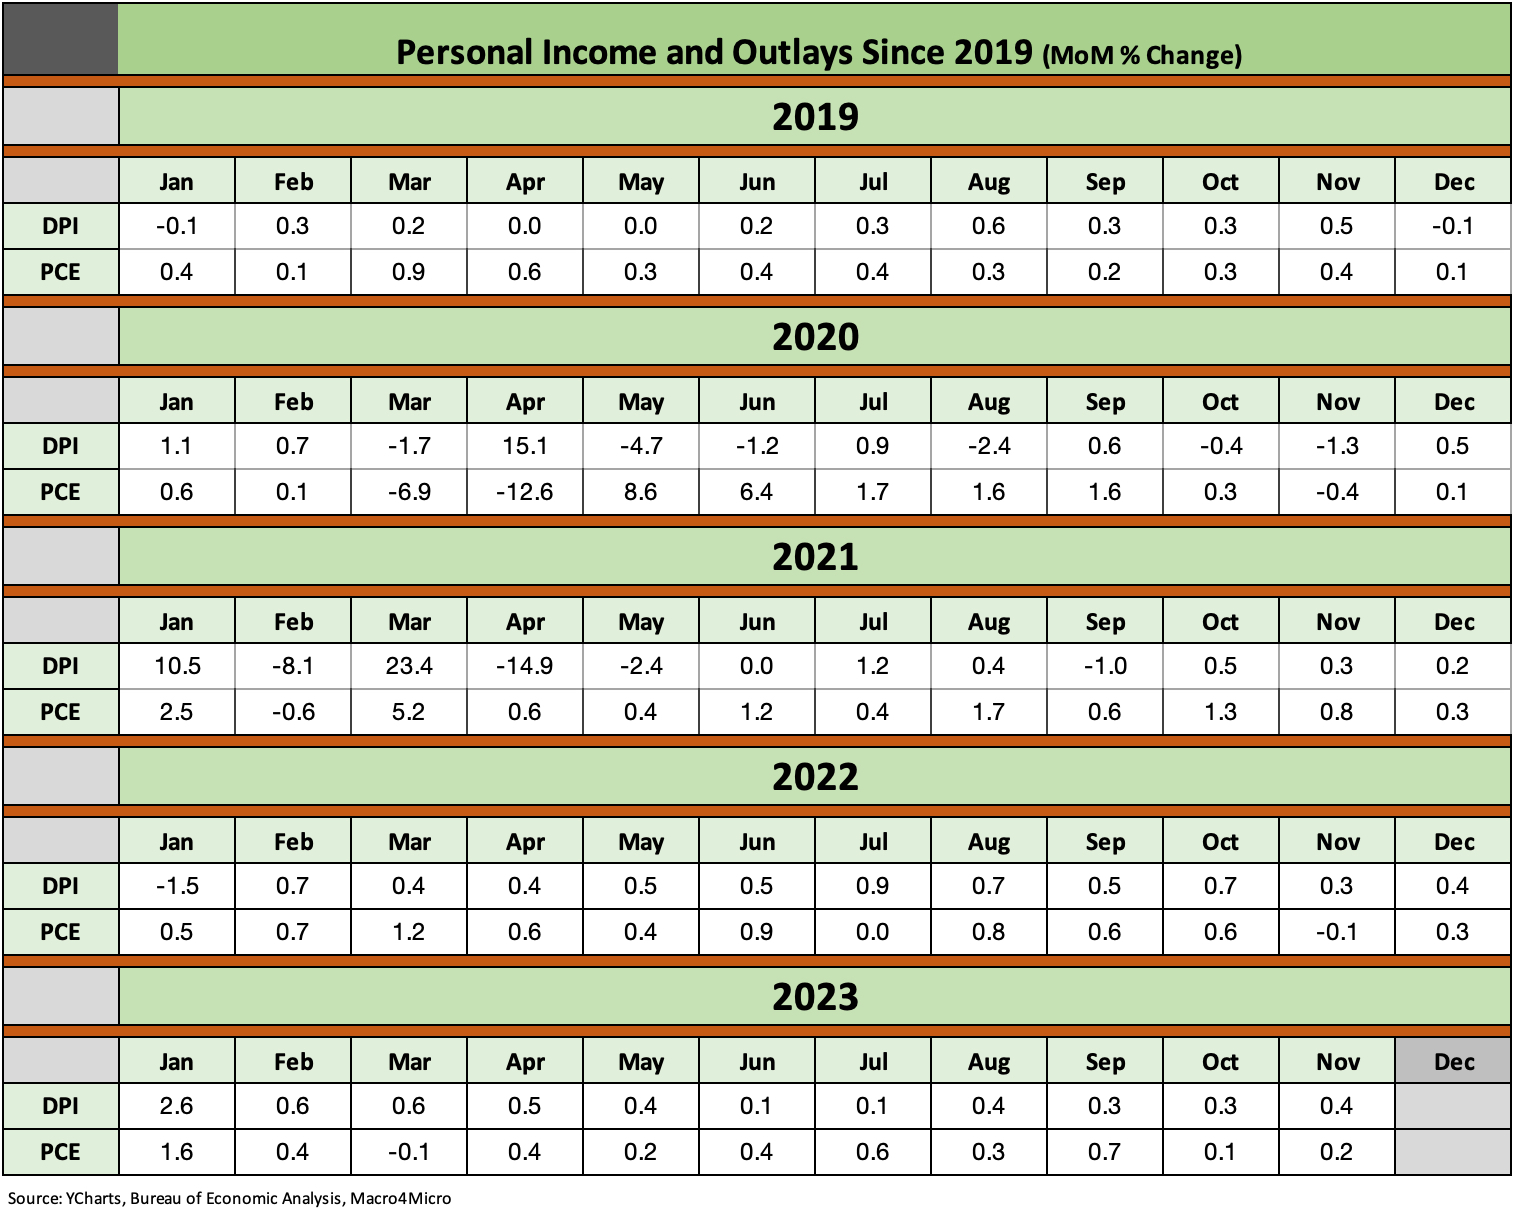
For frame of reference from pre-COVID to current times, the above table breaks out the monthly DPI and PCE.
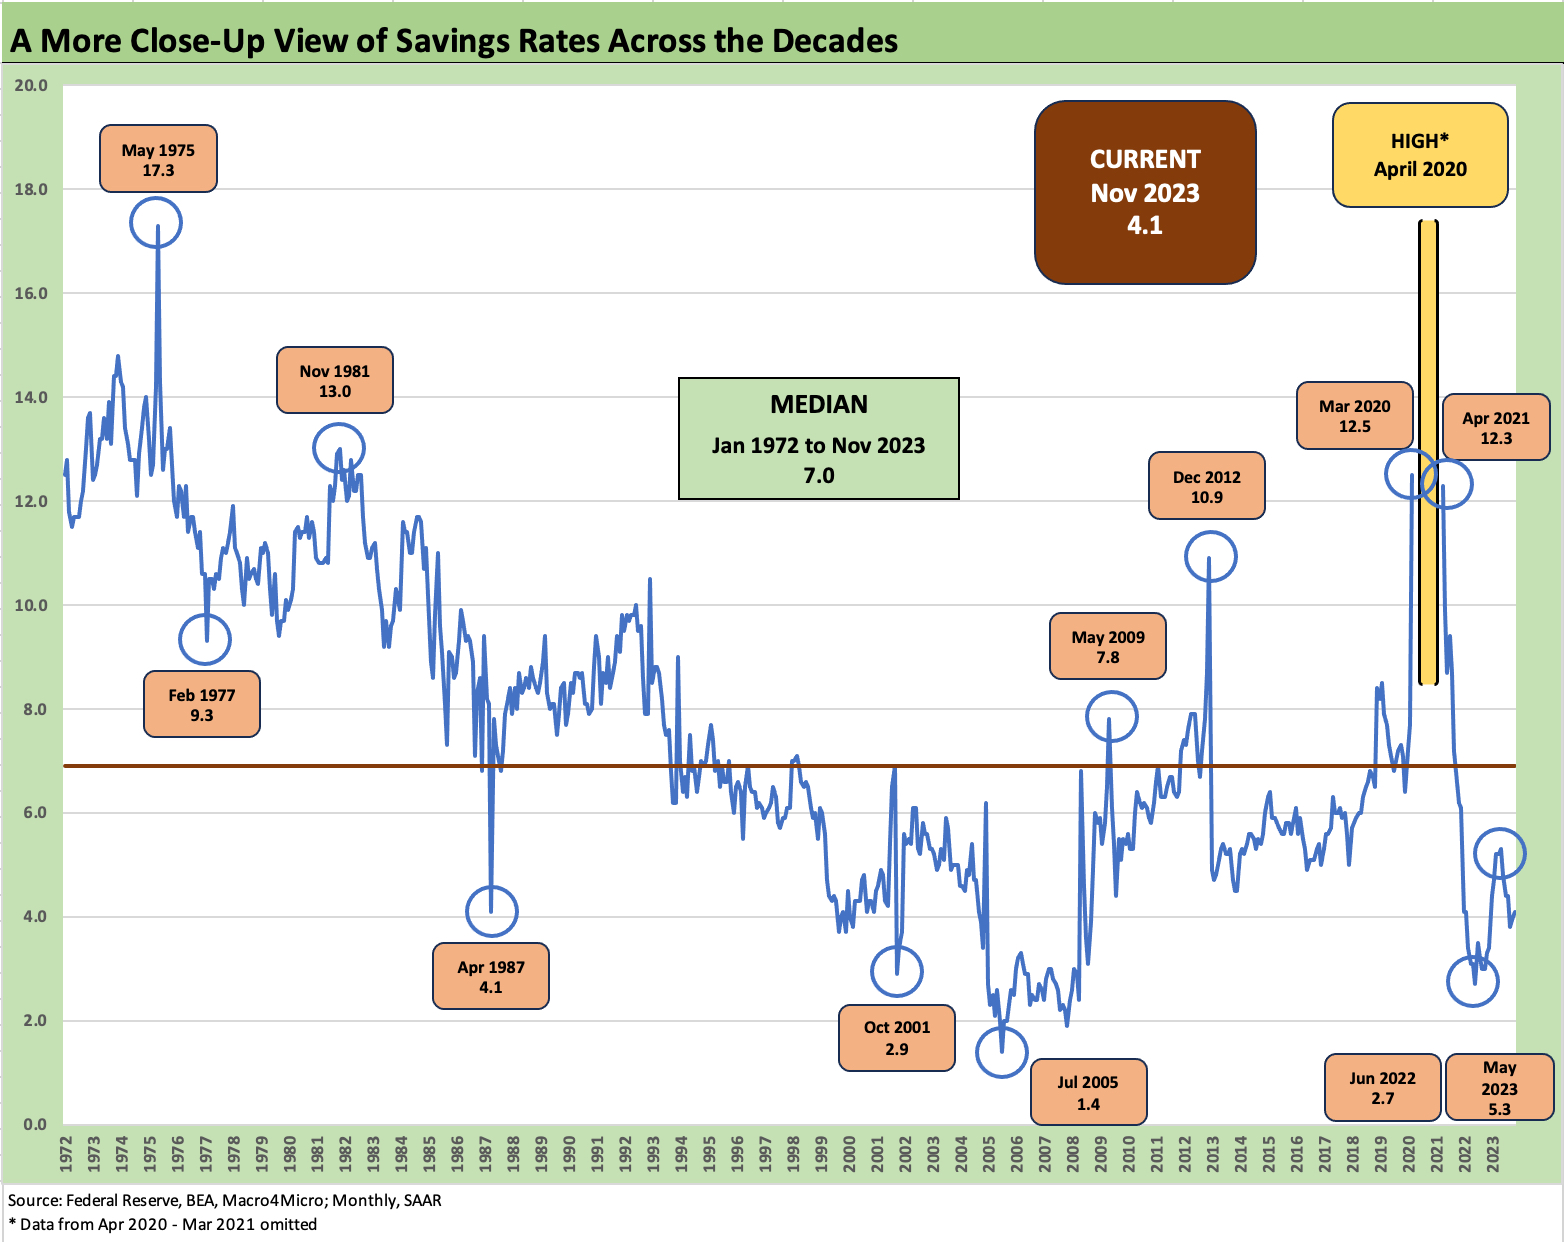
The above chart updates the savings rate trend we have been spending some time on recently (see Savings Rates: Context Across the Cycles 10-27-23). We see a rise in the savings rate this month, and that is a sign of PCE restraint but also supports household financial health. We remove the more extreme move of savings rates during COVID from the chart to get better optics on the other periods. The next chart drops in the full spike during COVID.
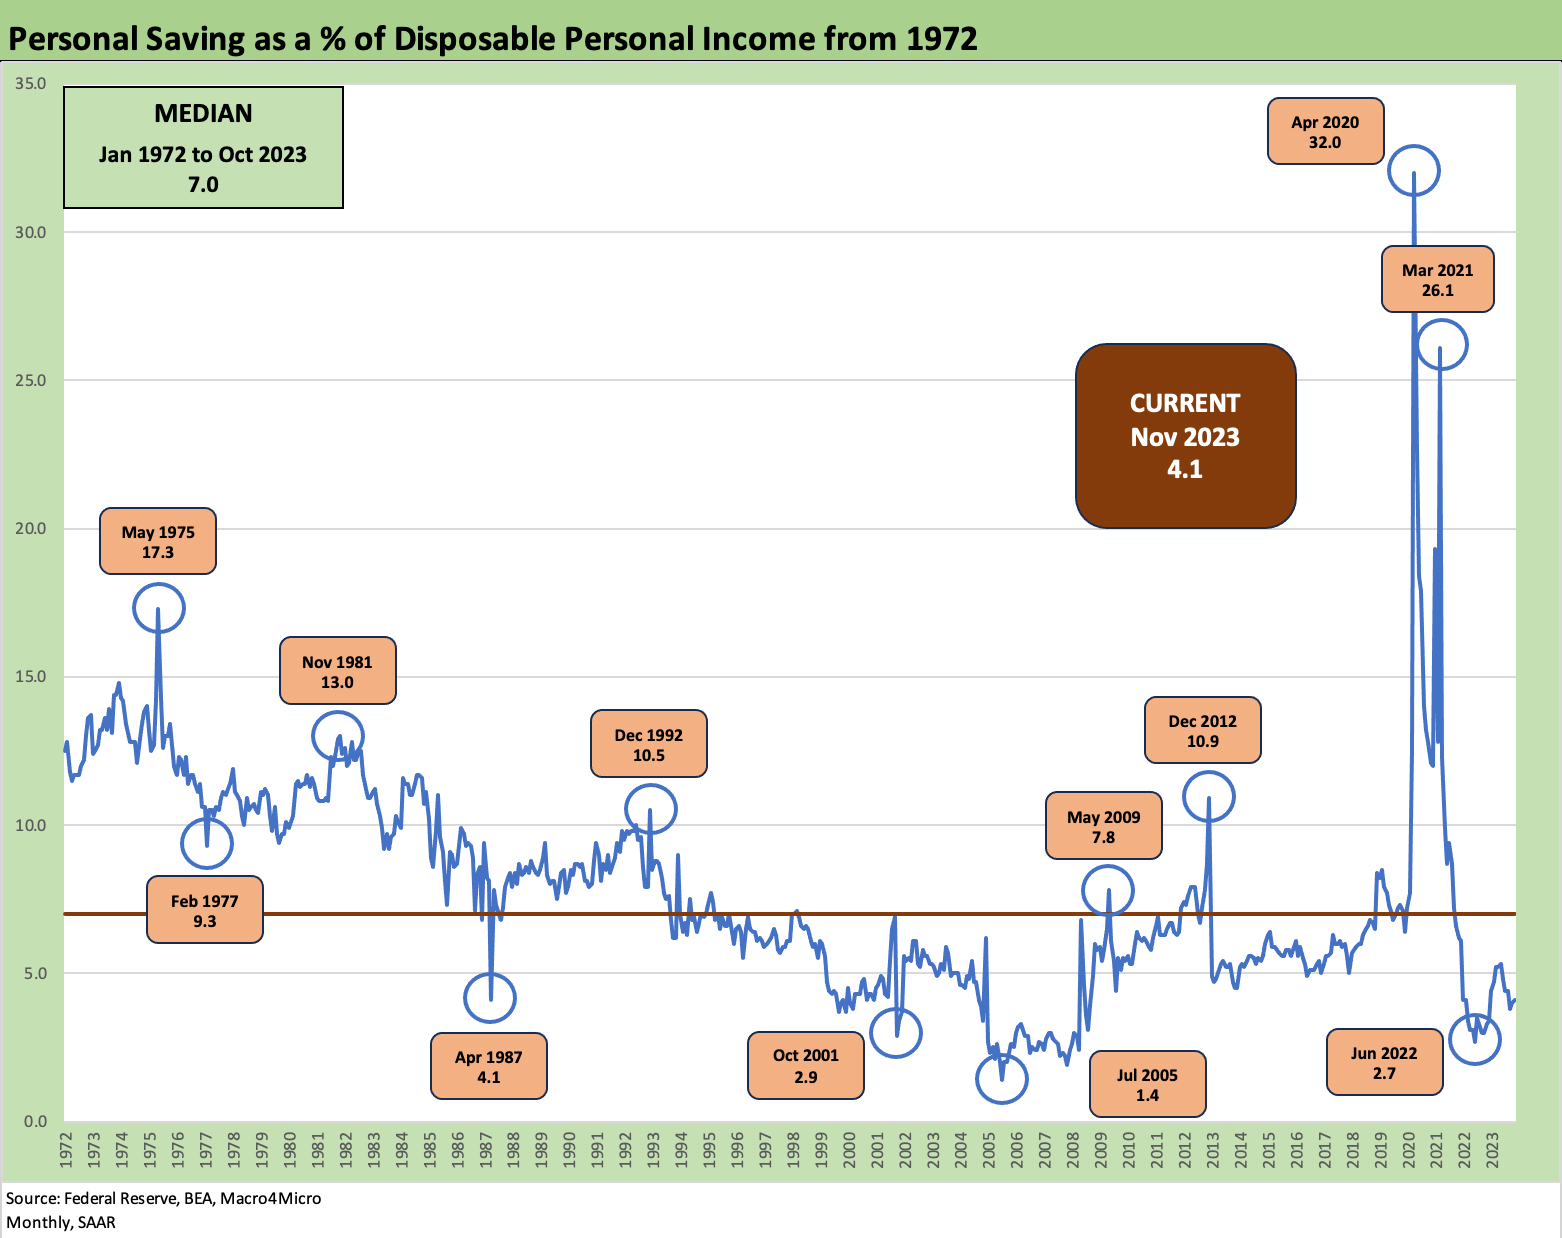
The above chart shows the spike during COVID and another outsized move when income rose sharply with COVID stimulus payments that drove material distortions in savings rates. The current 4.1% is still well below the long-term median of 7.0%.
The PCE news overall shows a healthy consumer and continued success in inflation fighting. Goldilocks will be heading out for a holiday party with the bulls and the bears and looks forward to the new year.