


The new taste test: Semiconductors vs. Software. Sip or Gulp?
The broad benchmark and ETF mix of results was favorable overall with the “tech check” list we monitor showing rebounds and sell-offs in bellwether semiconductor names. Software and SaaS services overall are showing some recoveries from the abysmal YTD returns that remain heavily weighted toward negative returns YTD.
The UST saw a 5Y to 30Y bear steepener that hurt bond returns while the CPI and PPI readings did not derail equities. Retail sales did not tell much of a story with the “current dollar” metric weaker but partially laid off on gasoline and Amazon Prime effects. The month of July does not appear to be showing weak PCE growth that will look more like the troubled 1Q26 period before the 2Q26 rebound. Those July PCE numbers come out later this month (see PPI July: When Lower is Better but Still Bad 8-13-26, CPI July 2026: Slight Breeze, No Chill 8-12-26).
A fresh round of heightened oil price pressure (WTI up over $4 per bbl from last Friday) will keep investors on edge around energy pressures flowing into inflation for the next release. This week brings a critical deadline in the US-Canada trade clash and what that could entail in terms of any Canadian retaliatory response at the resource level (export taxes?) or more tariff retaliation. The energy sector naturally posted up another very strong week in equities.
This week brings a lighter economic release schedule, but it is jam packed with major retailer releases that will help tell a consumer story. The “K recovery” may be getting worn out, but retailer earnings season might shine some light on the extent that the upper part of the K is still driving the PCE themes and whether the lower section of the K is holding up under the strain. Among bellwethers, earnings include Walmart (WMT), BJ’s (BJ), Target (TGT), TJX (TJX), Home Depot (HD), and Lowe’s (LOW). On a separate note, Deere (DE) earnings could offer updated color on the critical ag sector and how the farm belt is holding up.
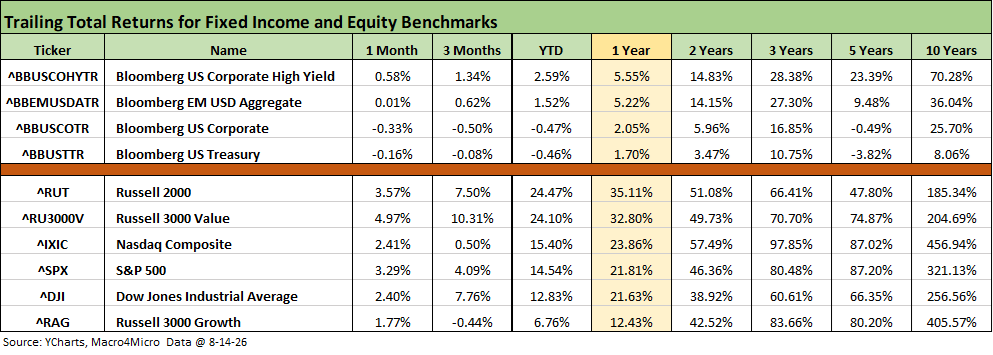
The above table updates the timeline return for the benchmark debt and equity indexes we monitor. We still see duration and high quality bonds under pressure with the UST and IG Bond Index negative for the running 1-month, 3-months and YTD periods. The Aggregate index posted minimal positive returns for 1 month and 3 months and only +1.52% YTD. We look at the UST deltas separately. The Iran war has been unkind to bonds since late the Feb 2026 bombing started.
Equities had another steady rolling 1-month period while the 3-month period has been undermined by tech and growth with value and the broader market benchmarks performing well. For the YTD period, only the Russell 3000 Growth did not generate a double-digit return YTD.
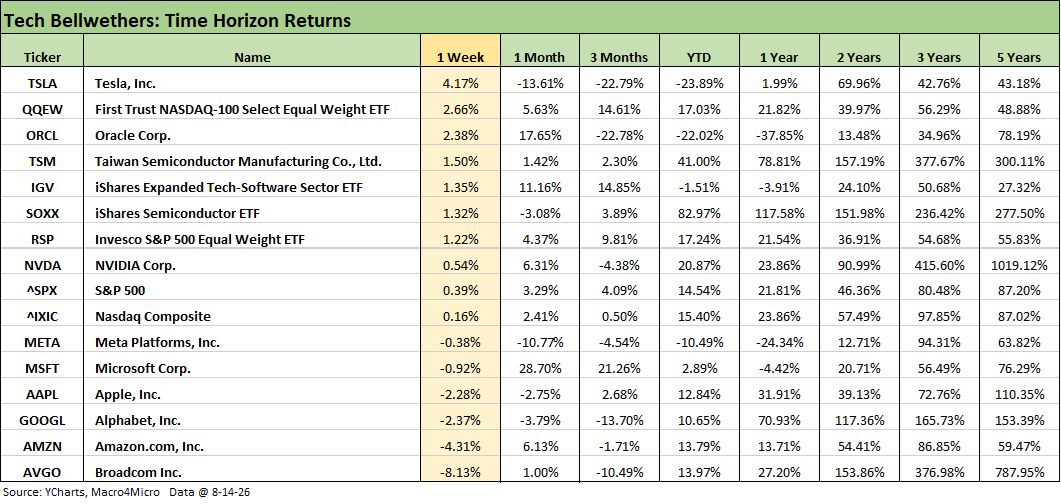
The tech bellwethers were mixed on the week with 5 of the Mag 7 in the red and only Tesla (TSLA) at #1 and NVIDIA (NVDA) generating a positive week. TSLA at +4.17% does not erase the negative running return posted by TSLA over 1-month, 3 months, and YTD periods with a minimal positive return of 1.99% over the trailing 1-year.
This comment on 1-week returns a modified cut-and past of a Saturday LinkedIn post:
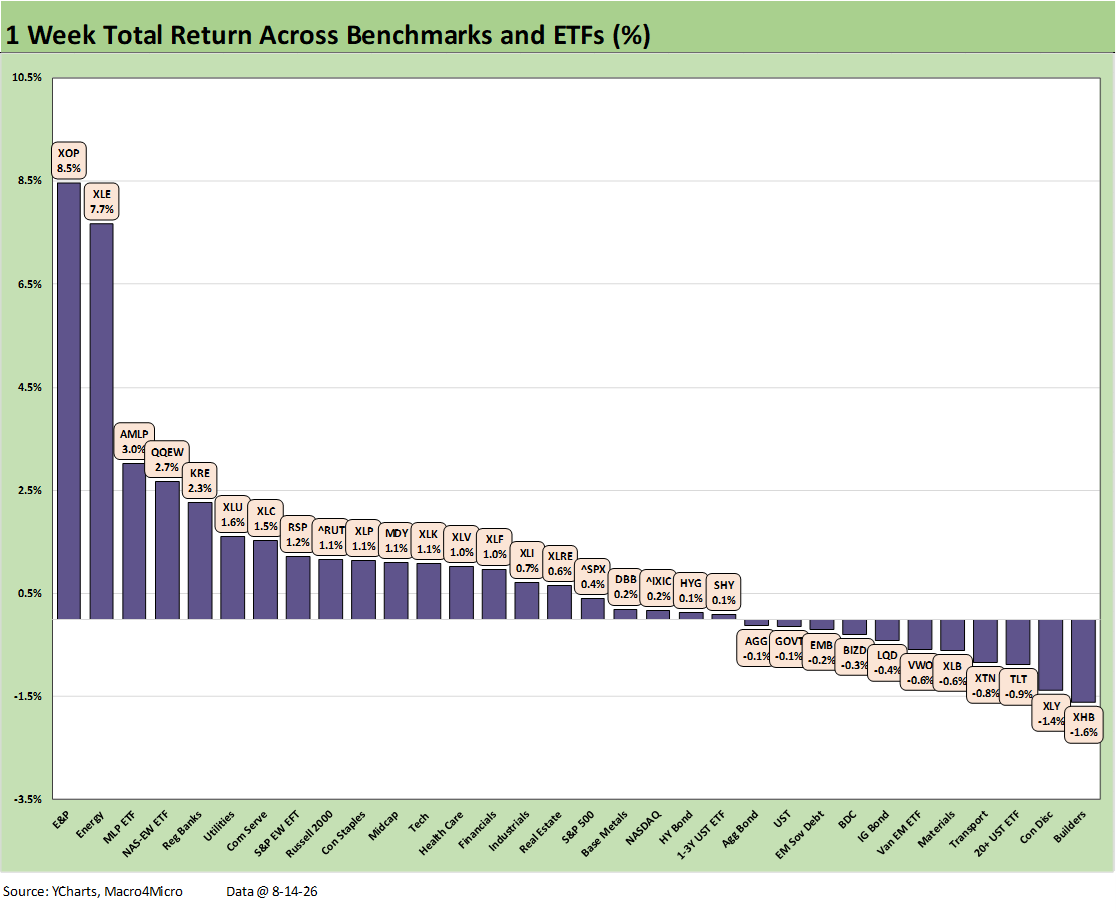
The chart updates returns for our 32 benchmarks and ETFs with a score of 21-11. The S&P 500 and NASDAQ were positive but only ranked the 3rd quartile with the Russell 2000 and Midcaps in the upper half of the 2nd quartile. Of the 11 S&P 500 sectors, we saw 8 positive and 3 negative.
Iran tension sent E&P (XOP), Energy (XLE), and Midstream (AMLP) into the top 3 with Equal Weight NASDAQ 100 ETF (QQEW) and Equal Weight S&P 500 also in the top quartile. The profile of returns overall is a good week and especially when Regional Banks (KRE) get a vote of confidence in the top quartile after CPI and PPI releases.
Bond ETFs saw 5 of 7 in negative return zone. The UST curve saw little reason to celebrate the CPI and PPI release even if the headline, core and numerous critical lines did not bring much new to worry about. We looked at the CPI and PPI numbers separately.
The rising US budget deficit rapidly moving toward $40 trillion offers a constant reminder that UST supply will require record demand at a time when some major holders around the world are much less fond of the US as a nation and question where the UST curve is headed. Headlines highlight that borrowing on the long end hit a 25 year high for the 30Y UST auction at 5.22%. The 10-month run rate for the US deficit hit $1.8 trillion. That is quite a sovereign credit bleed rate.
UST supply pressure runs alongside Trump announcing the Strait of Hormuz was a US territory. That might not help petrodollar UST demand whether by offending Gulf region “allies” or by assuring a perpetual state of war with Iran, who in turn will be targeting those same regional “allies.”
Another troubling screen item this week was the Jane Street losses on exposure to the Situational Awareness AI-heavy hedge fund given Jane Street’s role as an investor. Funds “blowing up” when there are concentrated leveraged bets on anything from companies to industries to commodities to currencies is not new, but it offers a reminder that counterparty exposure lurks out there whether on securities lending or in derivative trades.
When there is high leverage and extreme moves in the underlying, bad things can happen. There are always over-the-wall concentrations that do not see disclosure until it is “too late.” I have seen my share in past roles as Chief Credit Officer or credit risk manager on the sell side over the decades. Big swings bring big wins and big losses and sometimes big trouble. A catchy headline was in MarketWatch on the “Hindenburg Omen” in equities that crops up when there are signs of “extreme dispersion” within indexes. Traders love that, but credit risk comes with it.
The valuations, massive debt issuance to fund AI infrastructure, and a lot of leveraged investing will keep life interesting if FedWatch odds of 1 or 2 hike by Dec 2026 are accurate. As we go to print, FedWatch posts odd of 44.6% of 1 hike by the Dec 2026 FOMC meeting and 18.6% of 2 hikes. Along the way, the ugliest midterm election since the Civil War period will have taken place unless someone cancels them or later rejects them (Then brace for impact).
This comment on 1-week returns a modified cut-and past of a Saturday LinkedIn post:
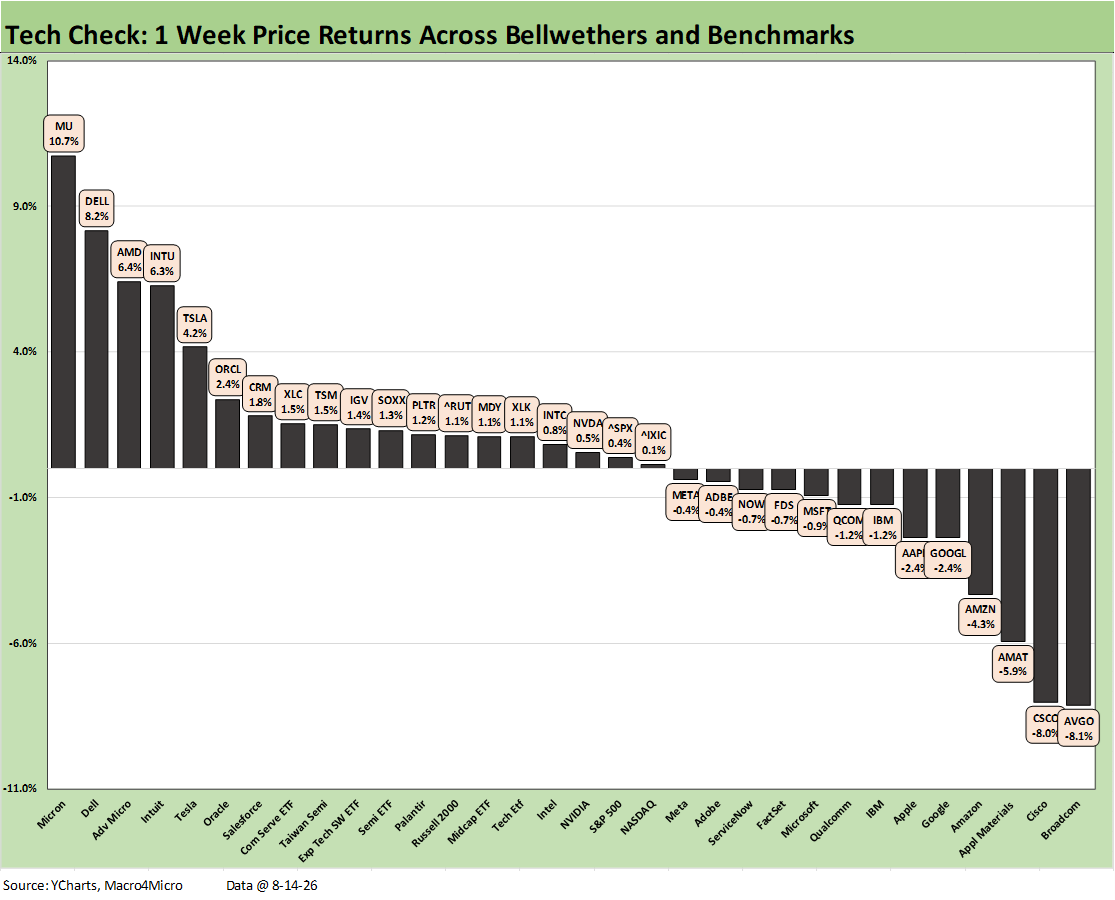
The “Tech Check” mix this week posted a 19-13 score with a slightly more blended and balanced profile across semiconductors vs. software/SaaS names on balance. The Software ETF (IGV) at +1.4% edged out the Semiconductor ETF (SOXX) at +1.3% in a near tie. We see 5 of the Mag 7 in the red with NVIDIA (NVDA) positive at the top of the 3rd quartile and Tesla (TSLA) making it into the top 5.
The NASDAQ and tech-heavy S&P 500 lagged the Tech ETF (XLK) this week and trailed the Semi ETF (SOXX) and the Software ETF (IGV). The small cap Russell 2000 also ran ahead of the NASDAQ and S&P 500.
Among some of the software and SaaS-based services companies that have struggled badly YTD in the “SaaS-pocalypse,” we see Intuit (INTU) and Salesforce (CRM) in the top quartile along with Oracle (ORCL). Those 3 names have posted negative returns YTD and rank in the bottom 5. As we cover further below in the YTD return chart, INTU is sitting in last place YTD with -47.8% and CRM 2nd to last at -25.9% with ORCL at -22.8% in the bottom tier.
We see Micron (MU) back on top with a double-digit week with Advanced Micro (AMD) in the top 5 while the bottom 5 features Broadcom (AVGO) on the bottom with Applied Materials (AMAT) in the bottom 5. AMAT is riding the semi capex cycle, reported banner earnings, and still sold off. That pattern has been seen at various other AI infrastructure and semi names along the way while also showing big swings on small questions around growth rates and guidance targets. AMAT is in the top 5 in YTD returns at over +97% as the leader in the semi equipment space.
The YTD mix shows the top quartile comprised of semi or AI ecosystem names with legacy leaders in their space such as Dell and Cisco.
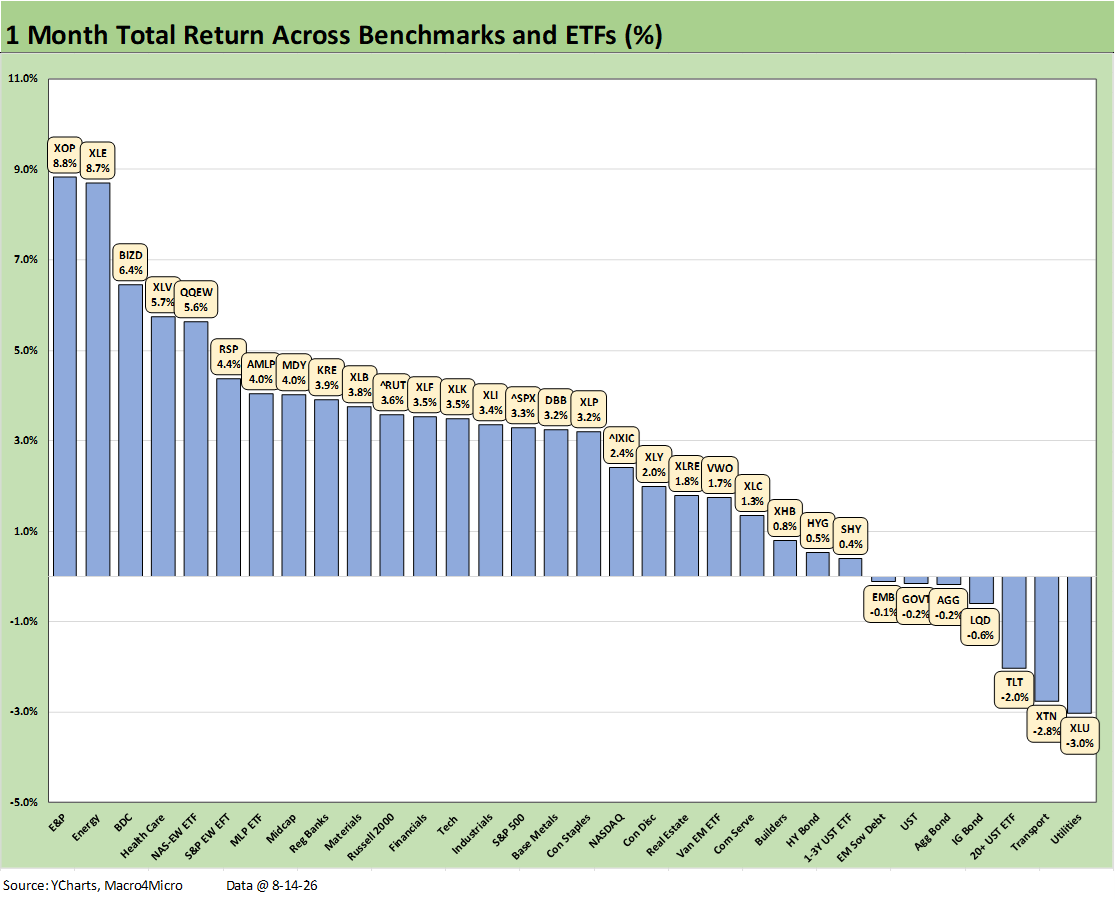
The trailing 1-month period marks the 5 ½ month timeline of the US-Iran War. The benchmarks and ETFs post a favorable score of 25-7 with energy the clear winner and numerous interest rate sensitive assets the clear losers. 5 of the 7 lines in the red are bond ETFs. We cover the UST deltas separately, but the rise on the long end of the curve is tough on housing (mortgage rates) and undermines any valuation metric that needs to consider appropriate discount rates.
The overall results reflect a geopolitically chaotic market that is largely wrapped around a challenge of reality vs. rhetoric evident in the US-Iran War policy actions and confusion tied to waves of misinformation. It is easier to lie about elections than to pretend you can cow a nation of over 90 million controlled by radical religious extremists who are not afraid to die. The only easy call was they would not back down and would close the Strait.
Something did not compute in handicapping the outcome of a war that was destined to fail without boots on the ground. That “boots” scenario was not going to happen politically. So the result was evident to many (most) except a few calling the shots outside the constitutional order.
To this point, the war and government policy broadly has spiked the deficit to $40 trillion and sent the defense budget up by 50% without including the war costs and collateral economic and interest expense damage. The war has repriced the “household basket” yet again after a brutal 2022 was still being felt, and the war and rising inflation over 2025-2026 (from 2.9% in Dec 2024) has sent wage growth into negative range with savings rates sharply lower even as consumers keep spending.
The good news is that fixed investment is soaring in the AI ecosystem with all its multiplier effects and consumers in aggregate picked up the pace in 2Q26 vs. 1Q26. That keeps speculation high on what additional tariff damages the consumer might face in what is a toxic election year with more trade clashes heating up.
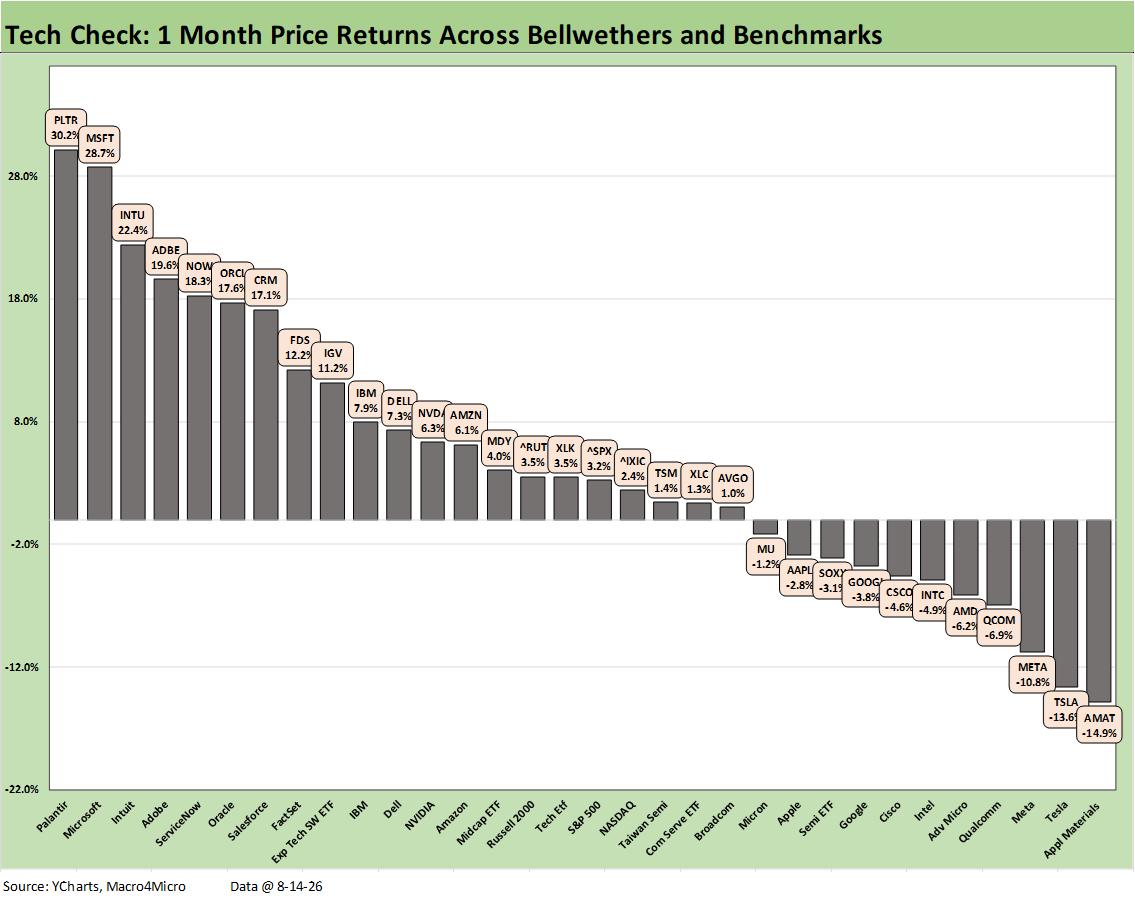
The tech check mix for the 1-month period shows the recovery of the software and SaaS players after what has generally been a YTD beatdown characterized by soaring stocks in semiconductors and anything in the AI ecosystem other than a more troubled Mag 7.
For the 1-month timeline, the top quartile is comprised of software and related in a “whose who” of the Software ETF (IGV), which posted +11.2% for the month vs. -3.1% for the Semiconductor ETF (SOXX). That was a return point spread of over 14 points.
Sitting on the bottom for the month was Applied Materials (AMAT) at -14.9% which was joined in the bottom quartile by 3 Mag 7 names (TSLA, META, GOOGL), 3 semis (QCOM, AMD, INTC) along with another AI ecosystem legacy name Cisco (CSCO).
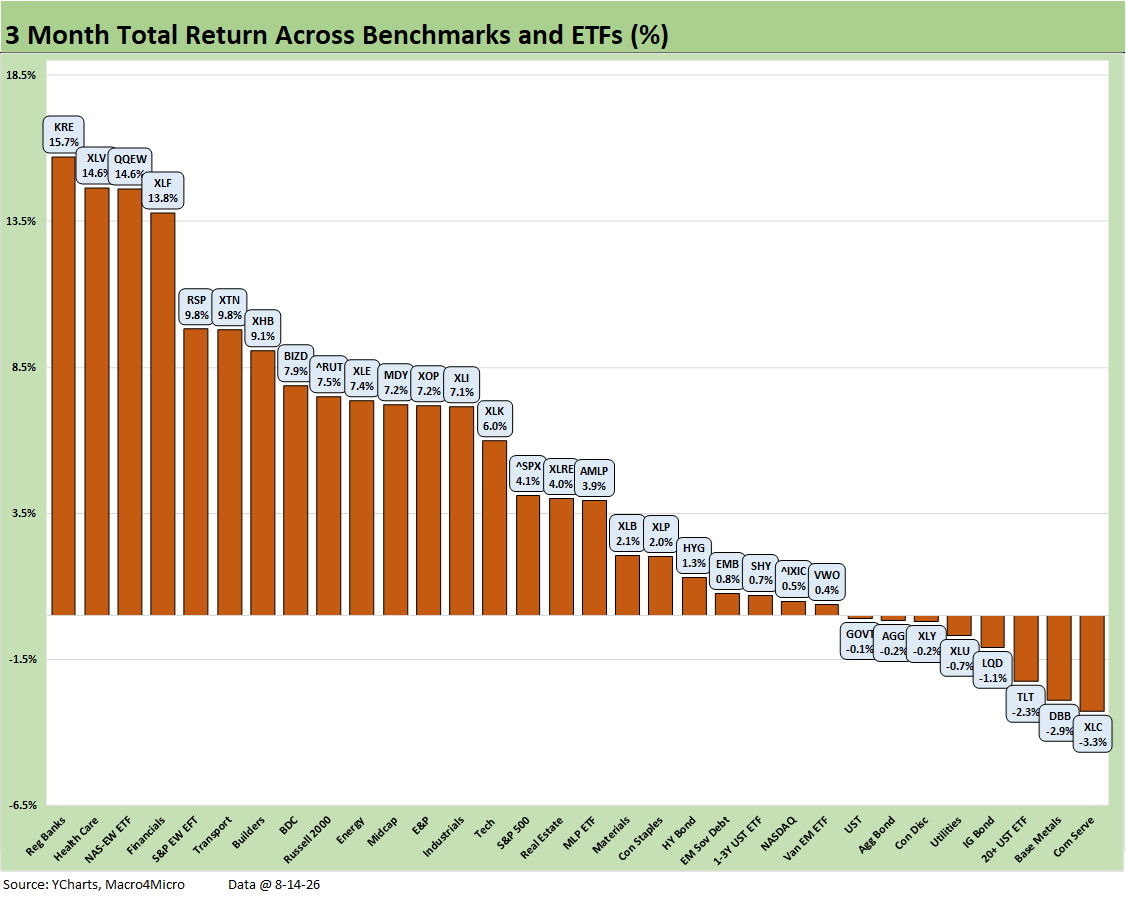
The 3-month timeline for the broad mix of 32 benchmarks and ETFs weighed in with a 24-8 score including 4 bond ETFs in the red. We also see Base Metals (DBB) in 2nd to last after a spike in some key metals in March with the Strait disruptions. Communications Services ETF (XLC) has struggled over 3 months with Meta (META) and Alphabet (GOOGL) material underperformers during that period.
The top quartile sees a diverse mix of winners with Regional Banks (KRE) on top, Financials (XLF) at #4 and even the BDC ETF (BIZD) at #8 all making the top tier. Those 3 names in the top tier offer a constructive vote on financial system health and asset quality even with some high-profile headaches in private credit. Solid equity markets tend to be supportive of refinancing risk market perception for more stretched credits in need of refi and extension financing.
The top tier also includes Health Care (XLV), the Equal Weight NASDAQ 100 (QQEW), Transports (XTN), and Homebuilders (XHB). The Equal Weight S&P 500 (RSP) was in the top tier. The Russell 2000, Midcaps (MDY), and S&P 500 were in the 2nd quartile and NASDAQ in the 3rd.
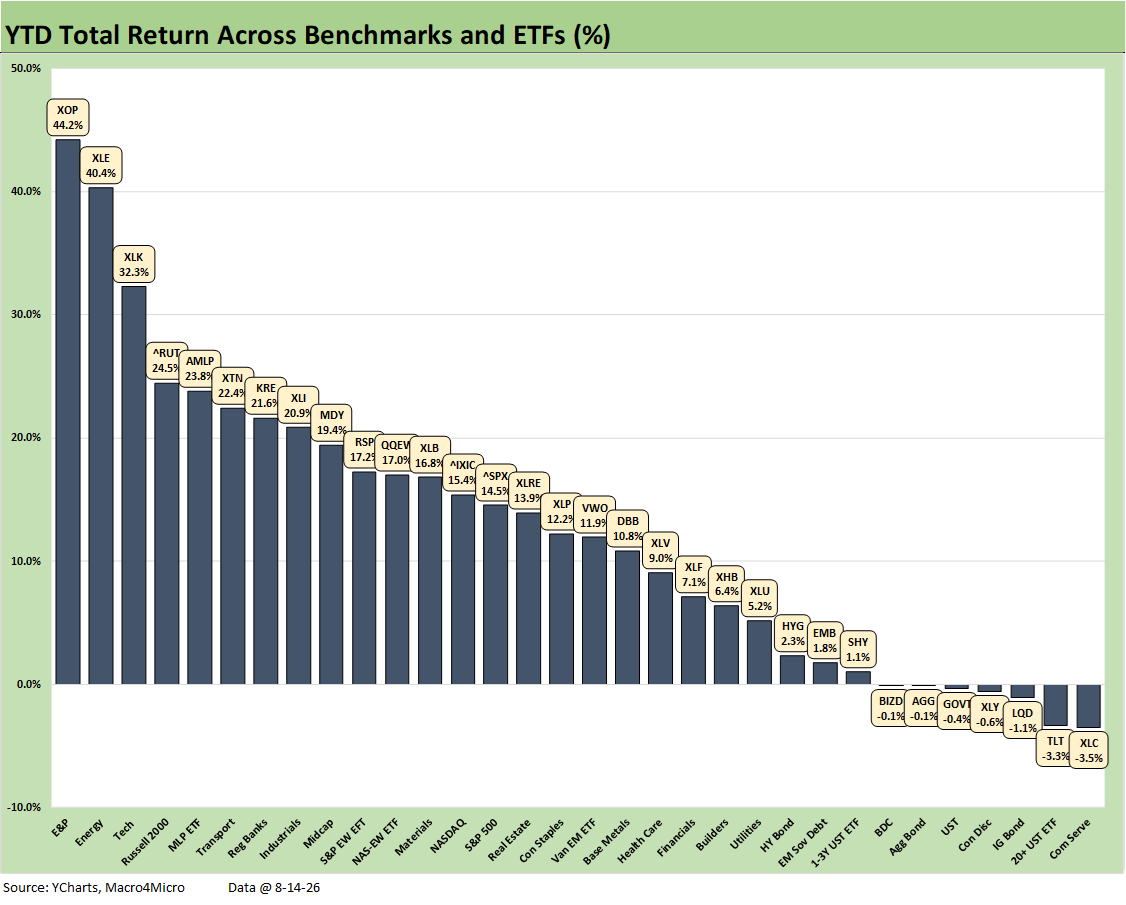
The YTD score for the broader group of 32 weighed in at 25-7. The winner included some of the obvious ETFs such as E&P (XOP), Energy (XLE), Midstream (AMLP), and Tech (XLK). Reassuring assets in the top tier included Regional Banks (KRE), Industrials (XLI), Transports (XTN), and Russell 2000 small caps.
The 7 with negative returns included 4 bond ETFs with the Communications Services ETF (XLC) on the bottom. Those were joined by Consumer Discretionary (XLY) and the BDCs ETF (BIZD). We already addressed the recent BIZD recovery in other commentary. The XLY mix was dispersed with Tesla being the worst of the concentration with a YTD return of almost -24%. McDonald’s (MCD) and Lowe’s (LOW) were also notably weak. XLC was dragged down by Meta (META), T-Mobile (TMUS), Disney (DIS) and Comcast (CMCSA) among others.
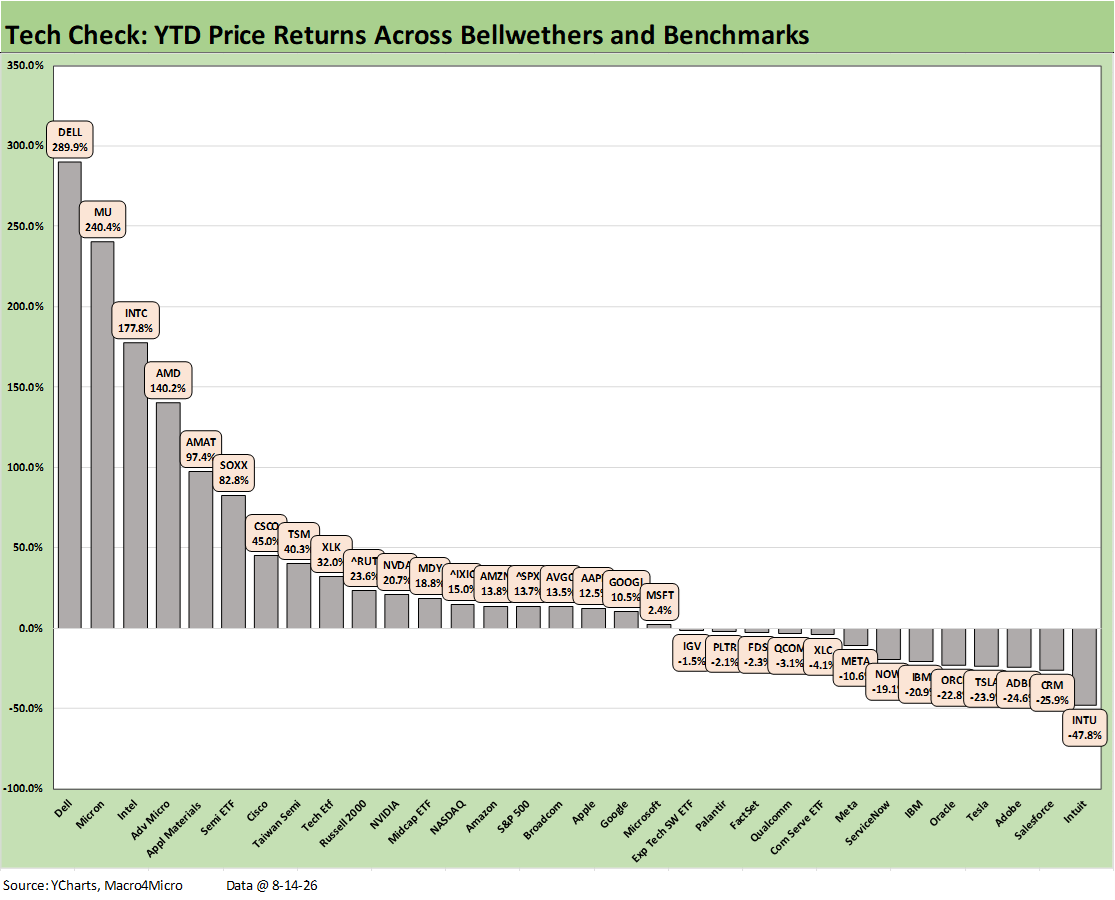
The tech check mix over the YTD period posted a score of 19-13. The obvious trend could be summarized as “semiconductors win, software and SaaS loses.” The Semiconductor ETF (SOXX) posted +82.8% YTD vs. the Software ETF (-1.5%) for over an 84 point price return differential.
By number of asset lines, we could reframe it as “AI ecosystem wins” since that would capture some of the more diverse tech names delivering the pieces of the AI and data center demand spike (Dell, Cisco). We see Dell at #1 with 290% as it took +97.5% to make the top 5 with Applied Materials (AMAT). It took +40.3% to make the top quartile with Taiwan Semiconductor (TSM).
The 13 negative return lines include 5 of the Mag 7 (ex-NVDA, AMZN) along with a slew of software and SaaS-based services operators. We see 8 names with double-digit negative returns running from META at -10.6% down to Intuit (INTU) at -47.8%.
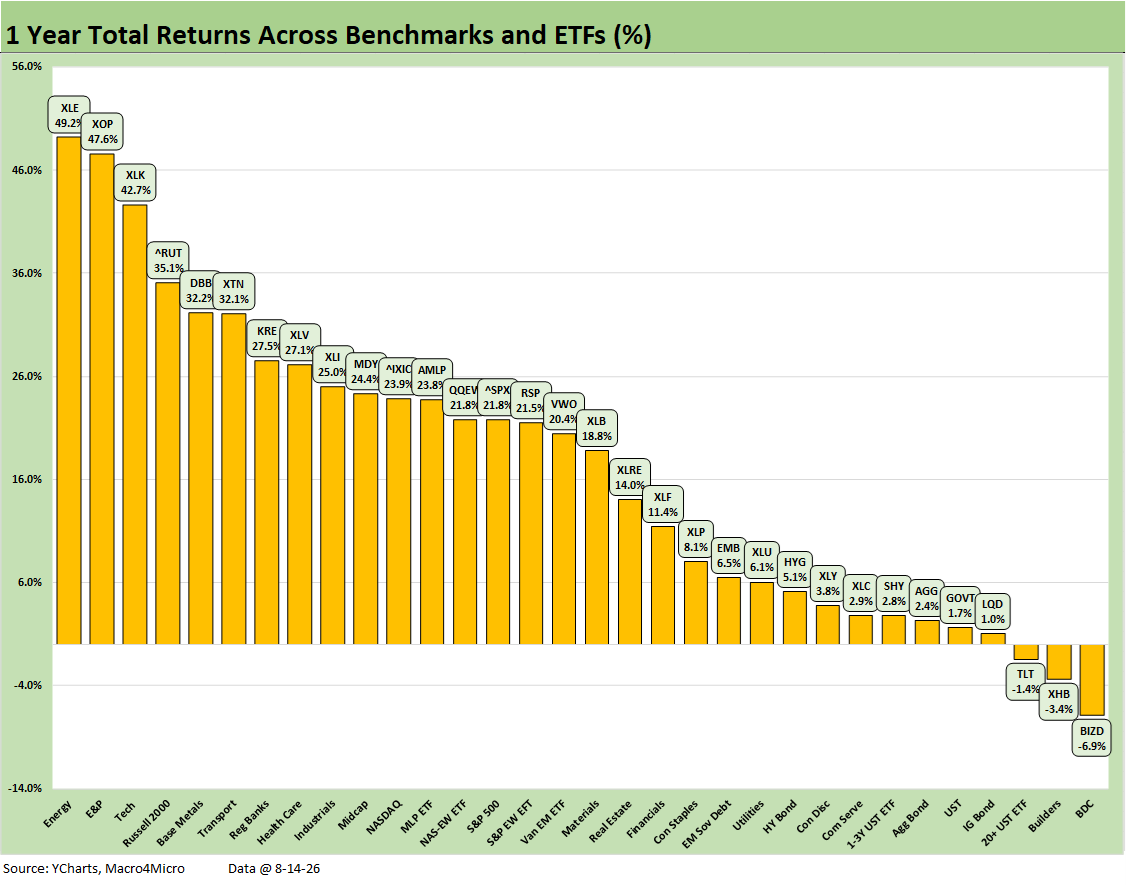
The running 1-year horizon at 29-3 score shows the BDC ETF still in last place but at least down into single digits. Duration has still been the loser with the long duration 20+Y UST ETF (TLT) being one of the two other lines posting negative returns with Homebuilders (XHB). We see 5 of the 8 in the bottom quartile are comprised of bond ETFs. Only HY (HYG) and EM Sovereigns (EMB) edged into the lower half of the 3rd quartile.
See also:
PPI July: When Lower is Better but Still Bad 8-13-26
CPI July 2026: Slight Breeze, No Chill 8-12-26
The ChatGPT Living Wage Test 8-11-26
Market Commentary: Asset Returns 8-11-26
Existing Home Sales July 2026: Slow Row 8-11-26
Market Commentary: The Curve 8-10-26
Payroll Deltas July: Mixed Bag, Mediocre Numbers 8-9-26
The Curve: Steeper, Inflation Anxiety Remains 8-2-26
Employment Cost Index June 2026: Inflation > Wage Growth 7-31-26
June 2026 PCE: Inflation, Income, and Outlays 7-30-26
2Q26 GDP: Good Underlying Numbers Despite Headline 1.5% 7-30-26