


High PPI is like running uphill even if the economy has found its stride.
The 4.7% PPI for July is a favorable trend from 5.5% in June, 5.9% in May, and 5.7% in April, but it is still a demanding walk from 2.7% in August 2025. The long-term median from 2010 is +2.1% with the most recent cyclical low +0.3% in June 2023 after a cyclical high of +11.7% in March 2022 after the Russian invasion of Ukraine in late Feb 2022.
The 0% sequential MoM move for Total Final Demand in July follows -0.1% in June and is down sharply from +1.1% in April and +0.8% in March. That is good news. Final demand for Energy goods posted two sharp MoM declines in July at -3.1% and -6.5% for June after +8.2% in May, +7.2% in April, and +10.5% in March. Those running numbers are still working their way through cost lines, producer pricing decisions and working capital cycles.
The PPI metric and various “slices and dices” are reasonably viewed as a leading indicator to where CPI and PCE inflation are headed, so it will take more relief than what we see to this point to make markets more confident on FOMC and fed fuds and the threat of UST steepening risks. Negative real wage growth is undermining the consumer, more disarray in the Middle East remains a risk, and potential chaos in trade and tariffs (notably with Canada in coming days) add some wildcards.
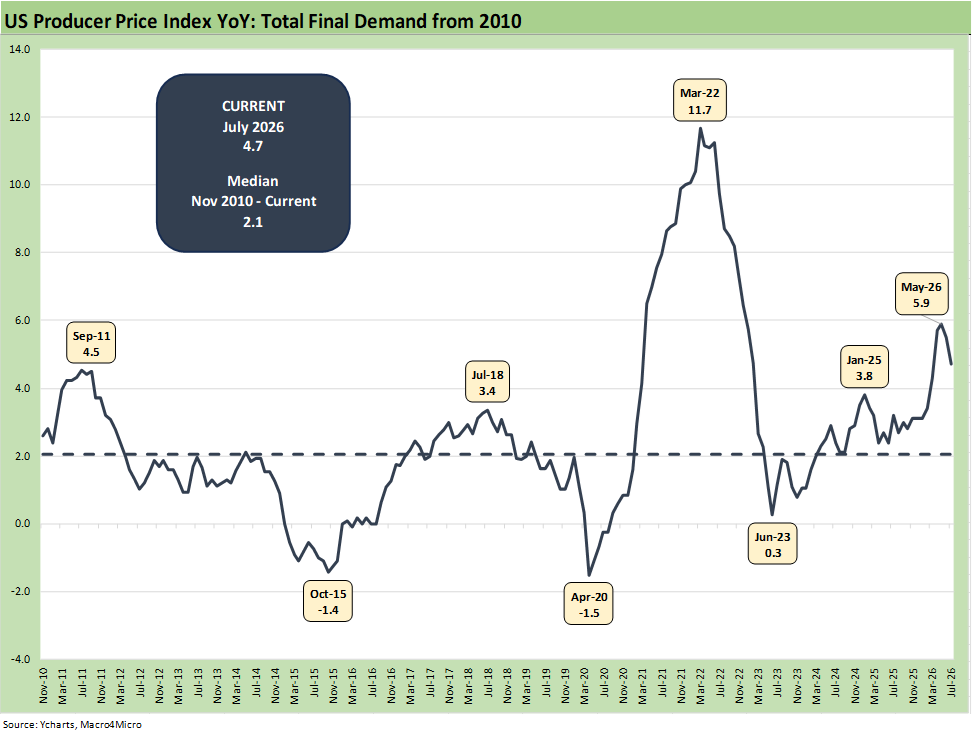
The above time series updates the running PPI line for “Total Final Demand.” The current total of 4.7% is down from 5.5% in June and down from 5.9% in May when it was basically triple the median since 2010.
There is no hiding from the reality of Iran as energy costs have so many effects on prices and costs directly or indirectly via secondary and tertiary effects. That will include raw materials across the supplier chains and the pricing pressure at the end of those chains. That includes freight and logistics costs to inventory costs. The energy trade rags are constantly framing supply-demand balances from China in the crude markets to painful supply-demand imbalances in downstream products such as diesel.
To what extent tariffs might flow into goods and services pricing will be influenced by trade partner reactions that must still play out at a lag. Trade partners will need to respond to the latest barrage of Trump tariffs and likely attacks by Trump on the Canada and Mexico and recurring tension with the EU.
Trump’s threat to cancel the USMCA and assign Smoot Hawley 1930 (Section 338) tariffs are among myriad possible decision points that tie more into geopolitical posturing than rational economic decision making. There is a scenario where Trump could drive a fresh round of military escalation with Iran (despite the recent “low-keying it”) and end in trade battles with Canada, Mexico and the EU. China ignoring new sanctions could be another trade war game scenario.
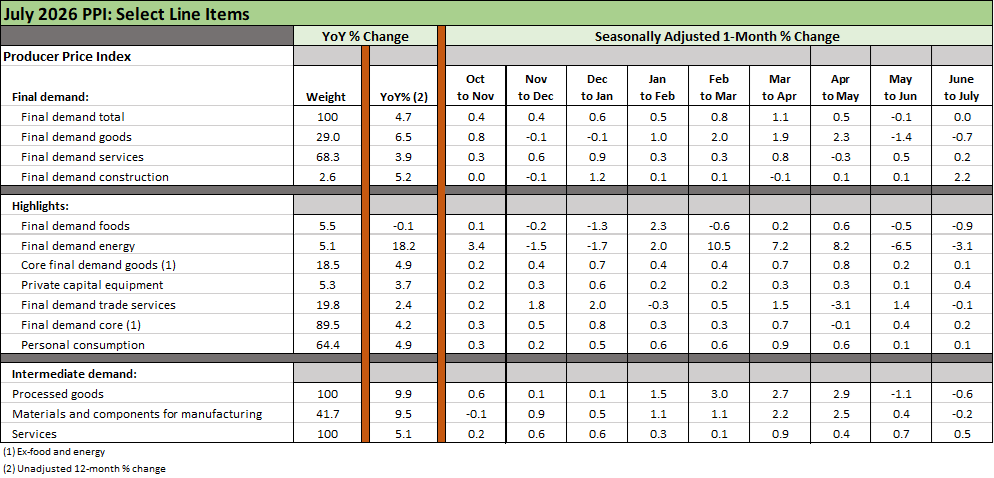
The above table breaks out some of the important PPI metrics that we monitor plus a few smaller line items we like to watch (Construction, Private Capital Equipment). The PPI release provides an extensive and lengthy range of metrics across over 20 pages in the release tables.
Even with improvement, PPI is elevated.
The YoY column (2nd column) tells a story of deteriorating inflation trends in 2026 even if the energy adjustments have flowed into improved sequential trends. The easing of Iran escalation and less daunting scenario-spinning brought some relief. The Strait is still closed, Iran is still blockaded, refined products are still a major macro problem, and the trade tension is going back up again. That flows into plenty of product lines if it gets worse.
We now have a backdrop where the flow-through of the cost pressures could still lead to higher prices and/or costs at various lag times. The potential for a USMCA tariff meltdown puts PPI trends at risk given the resource-heavy nature of Canadian imports and how Canada reacts to the 50% tariff threat. Whether Canada or Mexico will push back is highly uncertain given the tendency of both former NAFTA partners to retreat. High PPI plus more tariffs means either higher prices or narrowing margins.
See also:
CPI July 2026: Slight Breeze, No Chill 8-12-26
The ChatGPT Living Wage Test 8-11-26
Market Commentary: Asset Returns 8-11-26
Existing Home Sales July 2026: Slow Row 8-11-26
Market Commentary: The Curve 8-10-26
Payroll Deltas July: Mixed Bag, Mediocre Numbers 8-9-26
The Curve: Steeper, Inflation Anxiety Remains 8-2-26
Employment Cost Index June 2026: Inflation > Wage Growth 7-31-26
June 2026 PCE: Inflation, Income, and Outlays 7-30-26
2Q26 GDP: Good Underlying Numbers Despite Headline 1.5% 7-30-26