Footnotes & Flashbacks: State of Yields 7-23-23
We look back at a muted UST curve shift ahead of what promises to be a more eventful week with the FOMC, PCE, and a slew of earnings.
The past week was relatively uneventful along the UST curve as the market awaits the FOMC, the PCE inflation release, and advance read on 2Q23 GDP.
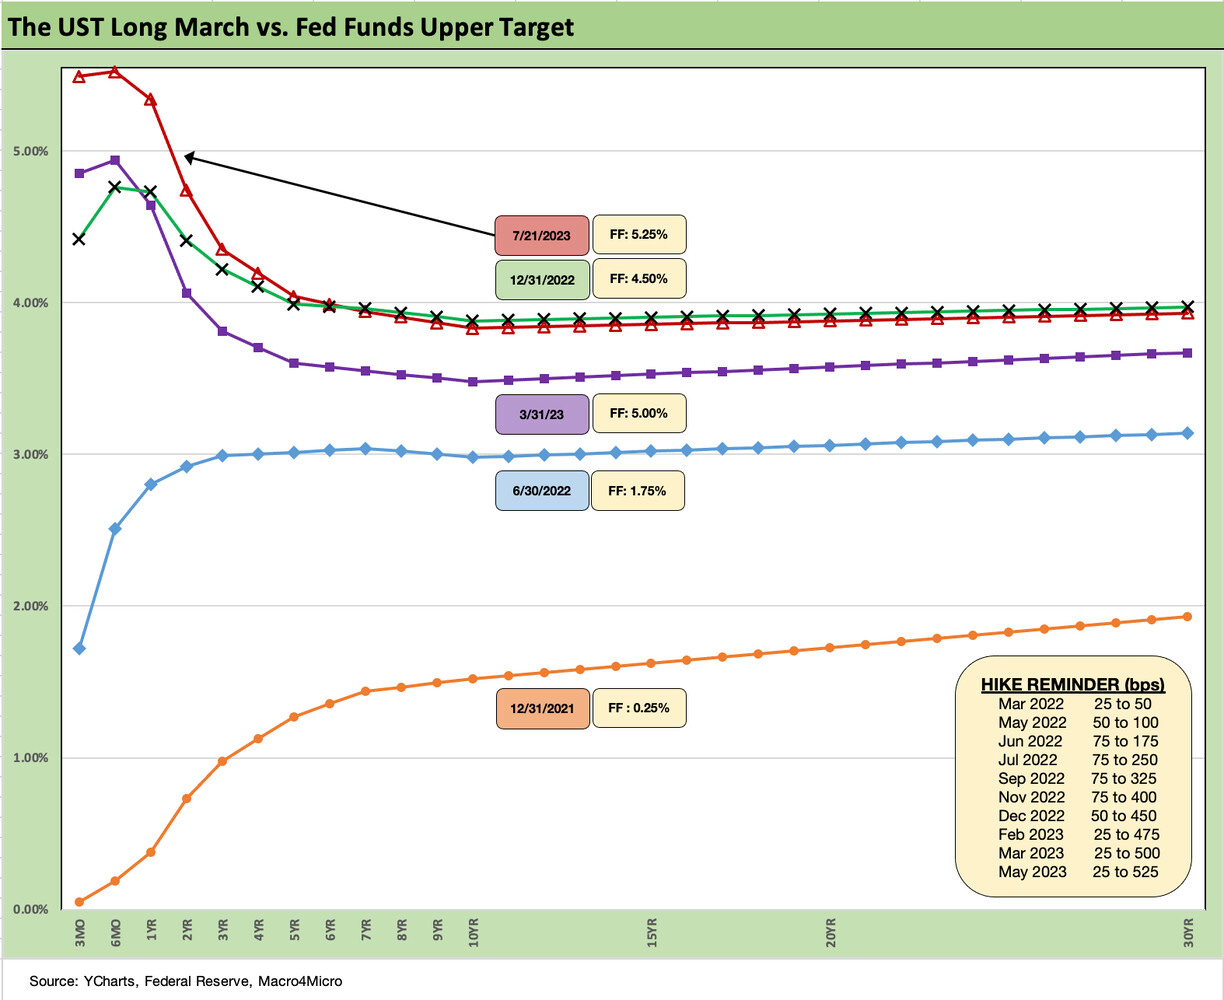
With the 3M to 10Y UST inversion near a high, the yield journey from 3M extending out the curve makes the income vs. duration trade-offs a tough decision point on timing.
With 5% handles from 1M to 1Y UST, 4% from 2Y to 5Y and then rolling down to 3% handles in the 7Y to 30Y range, hanging around in cash allows some time to gain confidence in the cyclical, inflation, and FOMC wildcards.
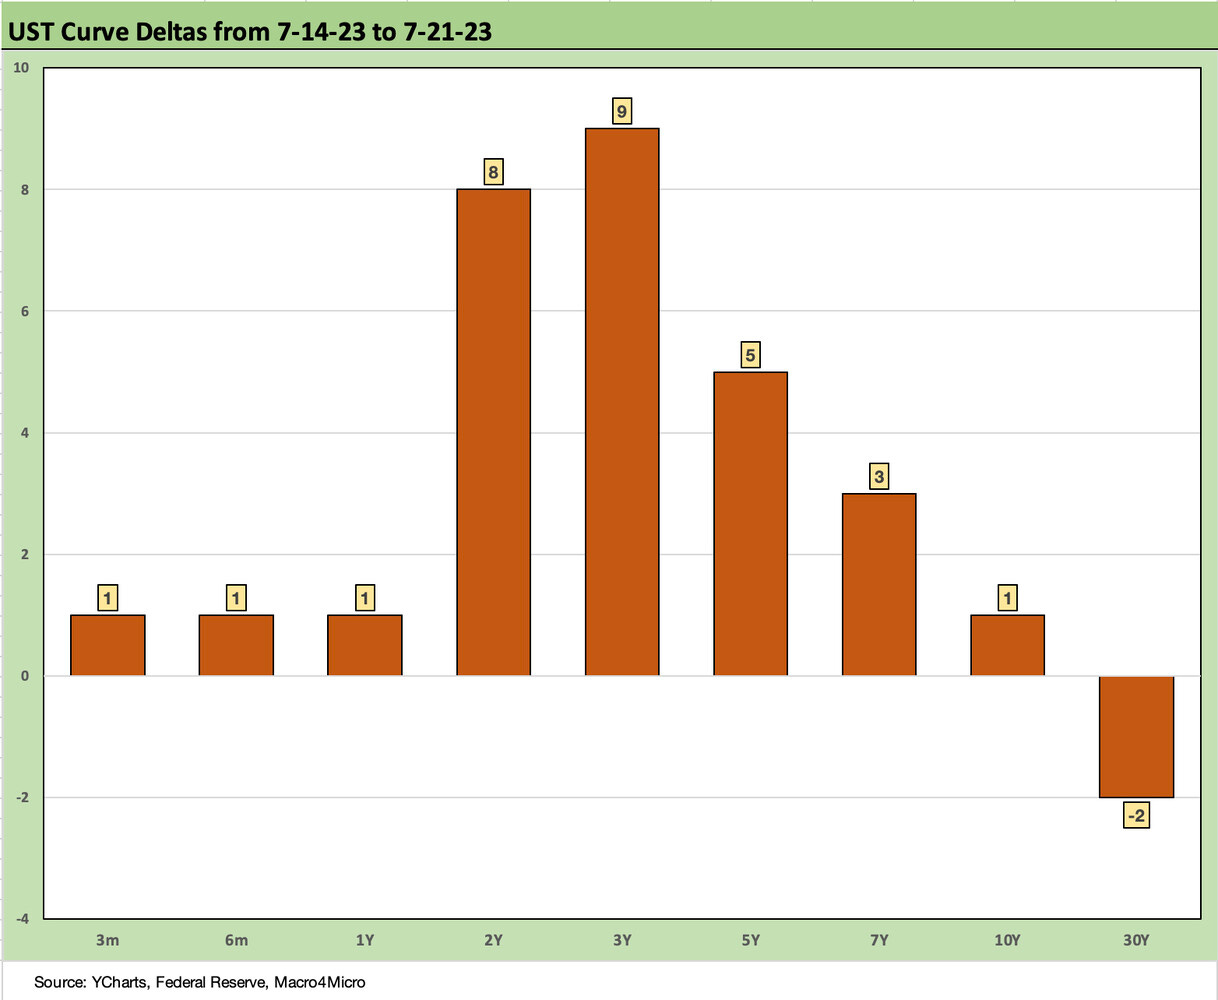
As we detail in the charts herein, the market had a milder week in UST migration patterns than we had been experiencing of late even if the move was higher in that 2Y to 5Y range. The FOMC is teed up for its 2-day meeting and what is expected to be another 25 bps this week. Then the usual word parsing will come in the aftermath. With some major and regional bank earnings now factored into the mix and a handful of industry bellwethers reporting the past week and more to come this week, Powell and the FOMC will be armed from the micro level as well.
The PCE price index information also rolls out to end the week and will be accompanied by the quarterly Employment Cost Index (see Employment Cost Index: Slow Motion 4-28-23). The PCE price metric is the Fed’s favorite, so everyone has to pay attention.
The headline PCE is where the 2% target lives but the Core PCE has been more stubborn and the Services part of PCE will be in focus (see Good (Mixed) News: Sub-4% PCE Wins 6-30-23). Goods have been well in check in pricing benchmarks, but the US lives in a Services world right now that is also driving some of the tight labor fears.
We also get the advance numbers on 2Q23 GDP this week on Tuesday after the FOMC but before PCE. The headline GDP number tends to dominate the dialogue with more than a few axes to grind by both sides on the political front. Our first move is always to look at Personal Consumption Expenditure lines and the fixed asset investment lines to see what is happening there (see 1Q23 GDP: Facts Matter 6-29-23, GDP 1Q23: Devils and Details 4-27-23).
Then the next move is to immediately look at what private inventory changes and trade did to distort the headline numbers. In a low annual growth market like the US GDP posted across both Obama and Trump (3 years pre-COVID as well as 4 years), a swing in inventory and trade can take growth to zero with ease (see 3Q22 GDP: It’s the Big Little Things 10-27-22).
There is not much question at this point that the consumer rules (in GDP accounting, PCE always rules), but the employment numbers and tight labor variables weigh on the FOMC debating points in their smoke-filled room. Labor, hiring, and capex influence what the leaders of the Fed say in their numerous exercises. While much of the time they are “speechifying” (I picked up that word watching a Davy Crockett TV movies as a kid. Footnote to Fess Parker), they need to pay close attention to what is going on in the trenches in industry-level guidance.
The above chart shows the UST deltas on the past week’s timeline. These are small moves and can shift quickly. We would expect more action along the curve from day to day given the FOMC meeting and other items cited earlier.
The earnings calendar this week is about as massive a stretch of earnings as an FOMC member can handle, so we hope they have their economists putting together some Cliff Notes for them. The banks have already weighed in from large cap to small cap. This week brings some of the Magnificent 7 (e.g., MSFT, META, Google) but a valuable cyclical read will come from a range of major manufacturers and basic industries reporting on the week.
Manufacturing earnings will include GE and three major Auto OEMs in GM, Ford, and Stellantis. We also have some more auto retail this week. We see rails, metals/steels, some major chemicals, and prime defense contractors including Boeing with its combined commercial aero and defense operations. We will also see more top homebuilders (Pulte, NVR), construction materials, and then Big Oil weigh in as well. That is a big week.
This week should influence perceptions of the economy and the cycle if the FOMC chooses to come down from the clouds.
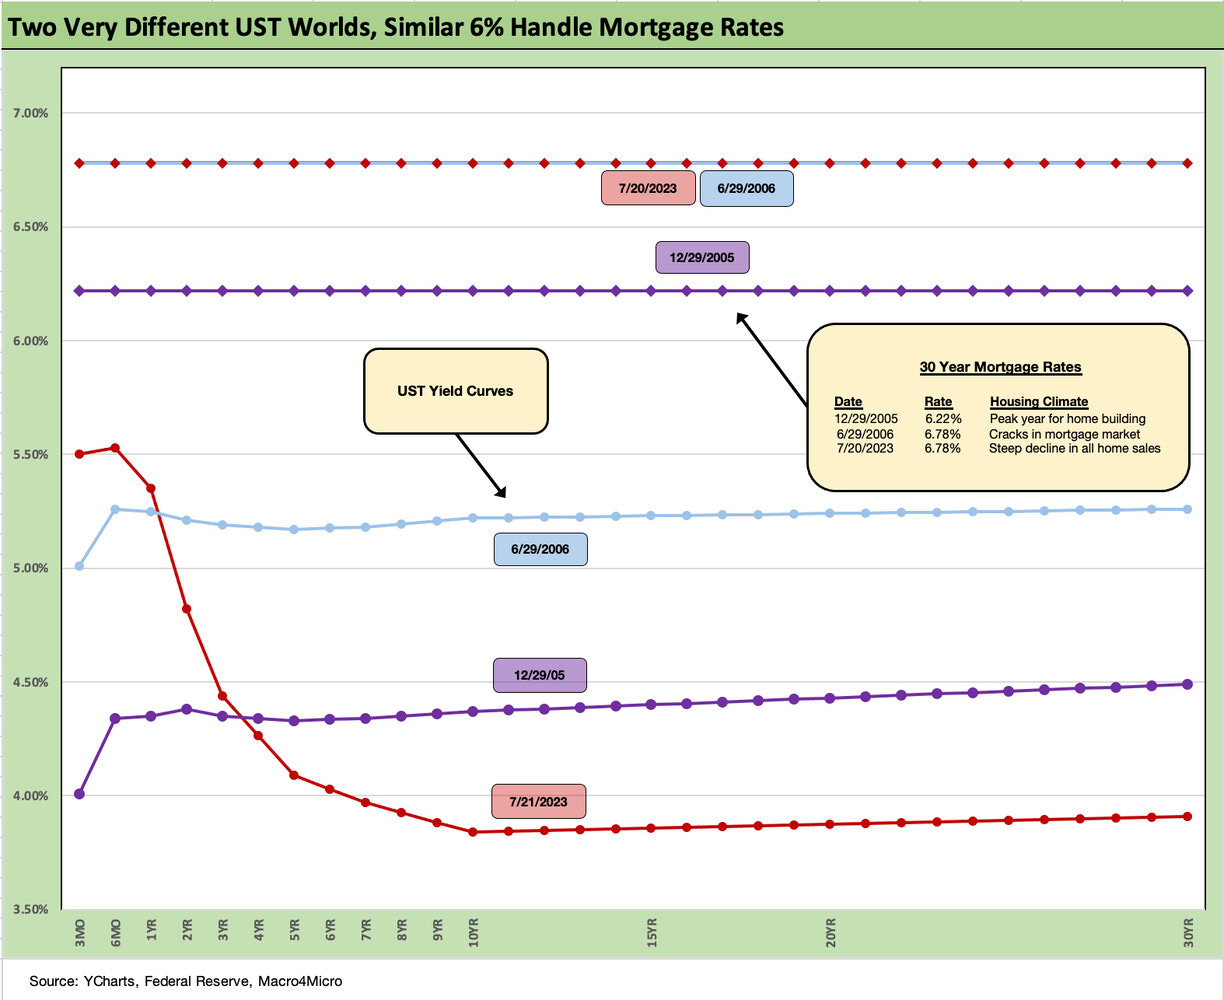
The above chart updates where the market stands on 30Y mortgages and revisits the stark contrast around where today’s UST curve stands vs. the housing bubble period and what mortgage rates look like. The 30Y mortgage line for mid-2006 is sitting right on top of the current mortgage line for 30Y. That contrasts with how the UST curve for the past week compares to the mid-2006 period UST curve as shown in the chart.
As we addressed in the housing starts note this past week (see Housing Starts: Multifamily Moonwalk 7-19-23) and in the existing home sales release (see Existing Home Sales: Bare Cupboards, Hungry Crowd 7-20-23), more homebuyers are getting accustomed to 6% handle mortgage rates. That said, the monthly payment differentials for the seller refinancing is enough of a shock to inspire a waiting game for those pondering to cash out their home equity winnings in this market. That has tightened up inventory and kept home sales prices firm as the second highest median home price was seen for existing home sales.
We saw some strong results the past week from industry leader D.R. Horton, and we will see #3 Pulte report this week as well as NVR, who also ranks in the Top 5 homebuilders in equity market cap. Builders have been very strong performers in the equity markets in recent weeks, months, and YTD. The combination of auto guidance and builder guidance this coming week should offer some value-added inputs on consumer intel.
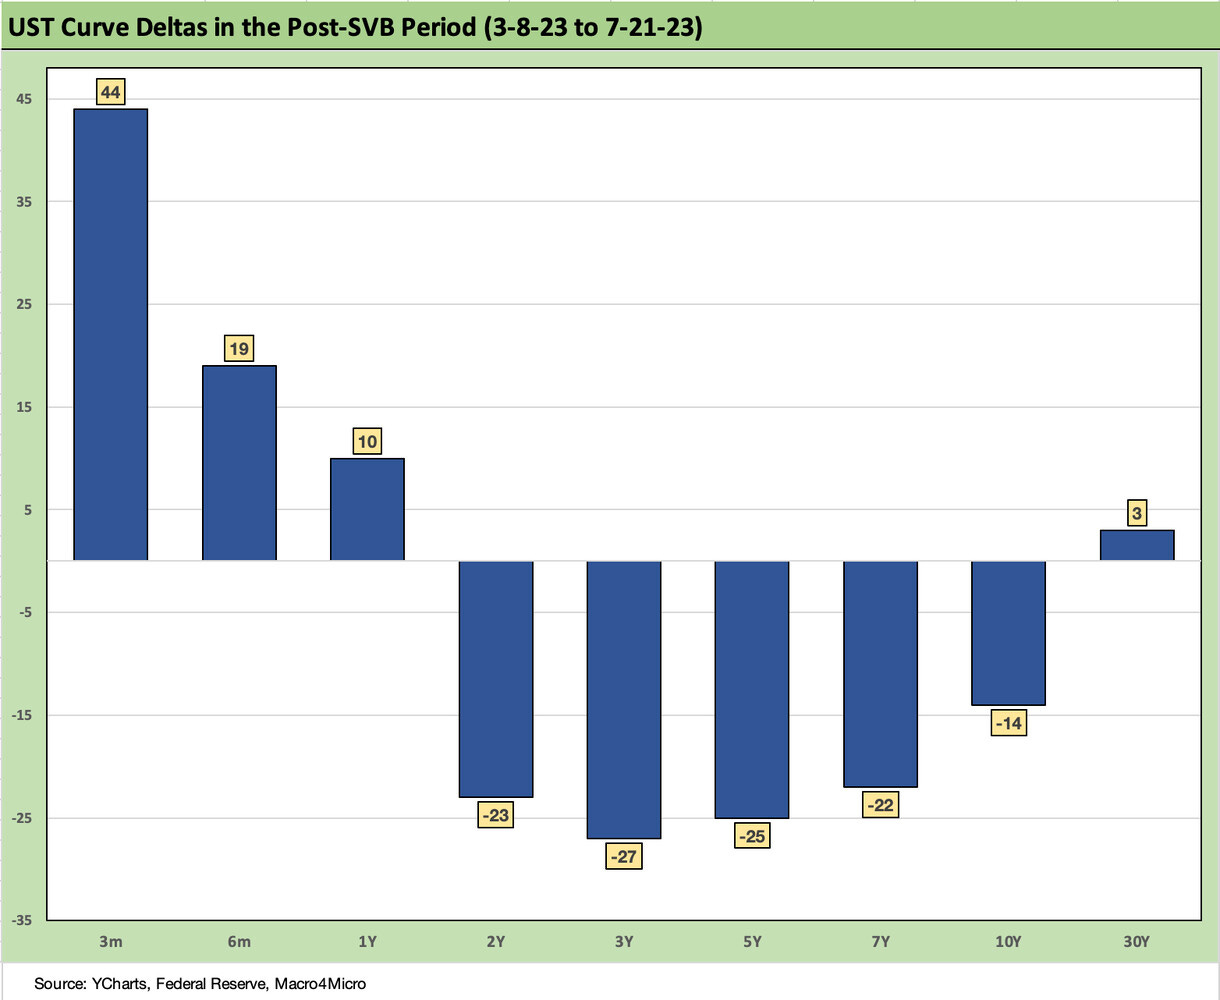
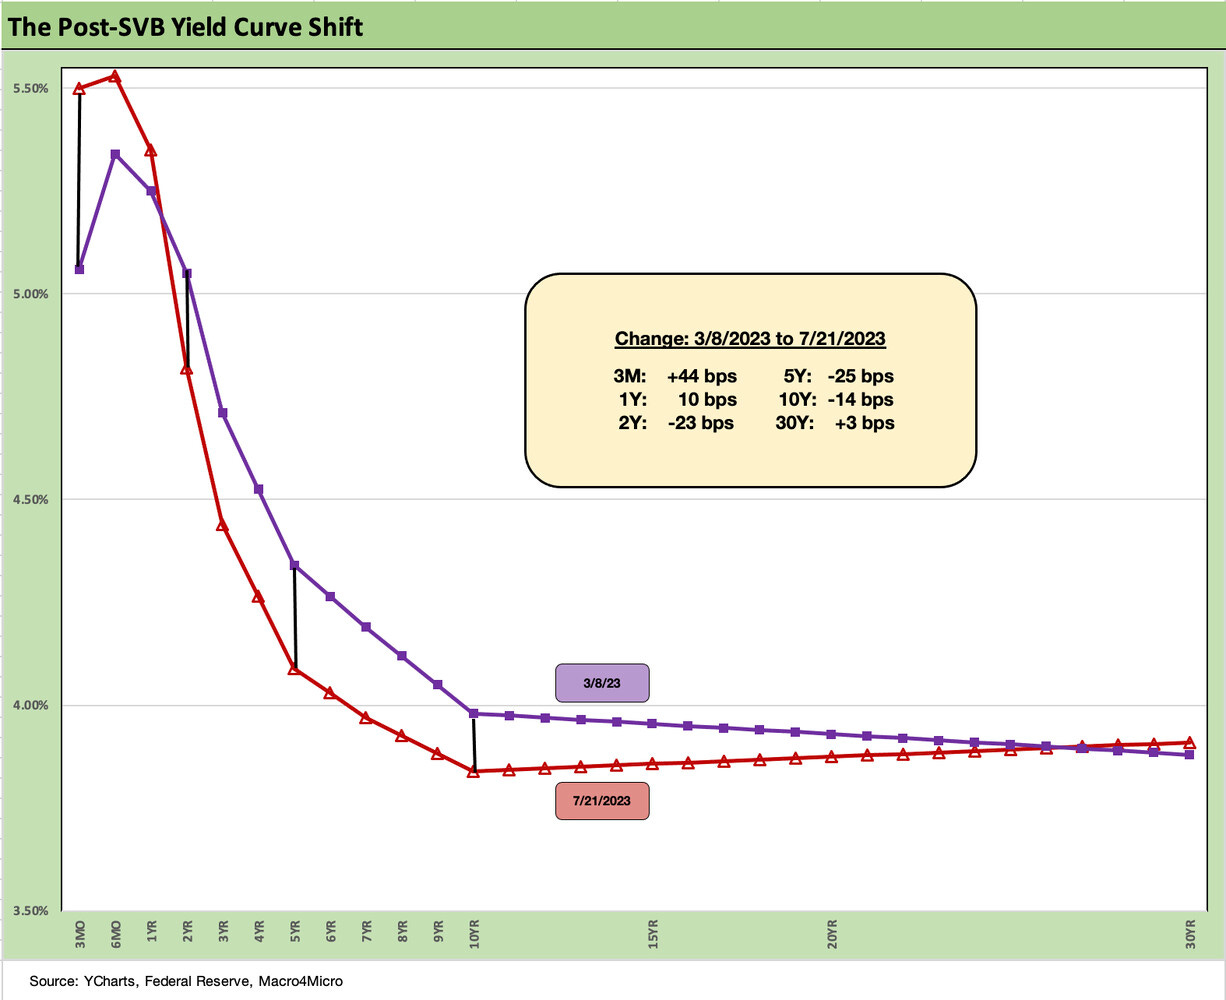
The above chart updates the UST curve deltas since the regional bank shock in early March (we use 3-8-23 as the last “clean” pre-SVB date). The UST curve still shows a modest downward shift in the 2Y to 10Y part of the curve that has fed the steepening.
The above chart gives a yield curve visual post-SVB from the prior chart that frames the inversion on the front-end hikes and the downdraft out through 10Y UST. The fear of those starting to extend on duration is that the UST curve gets back into a steepener mode in a move back toward flat and punishes the extension trade if the news gets even better into the fall season.
If the economy stays in growth mode, the economy bears see the FOMC then taking aggressive actions that could bring the sound of a large crack and steep market sell-off in equities that also brings a rally out the UST curve. The softening of manufacturing is one angle that the bears have focused on since employment and consumer resilience have not been helping them out.
Further, we have a view on consumer systemic debt that tells a constructive story on the ability of the consumer to keep on spending (see Consumer Debt in Systemic Context 7-13-23). We still expect the consumer to hang tough in 2H23.
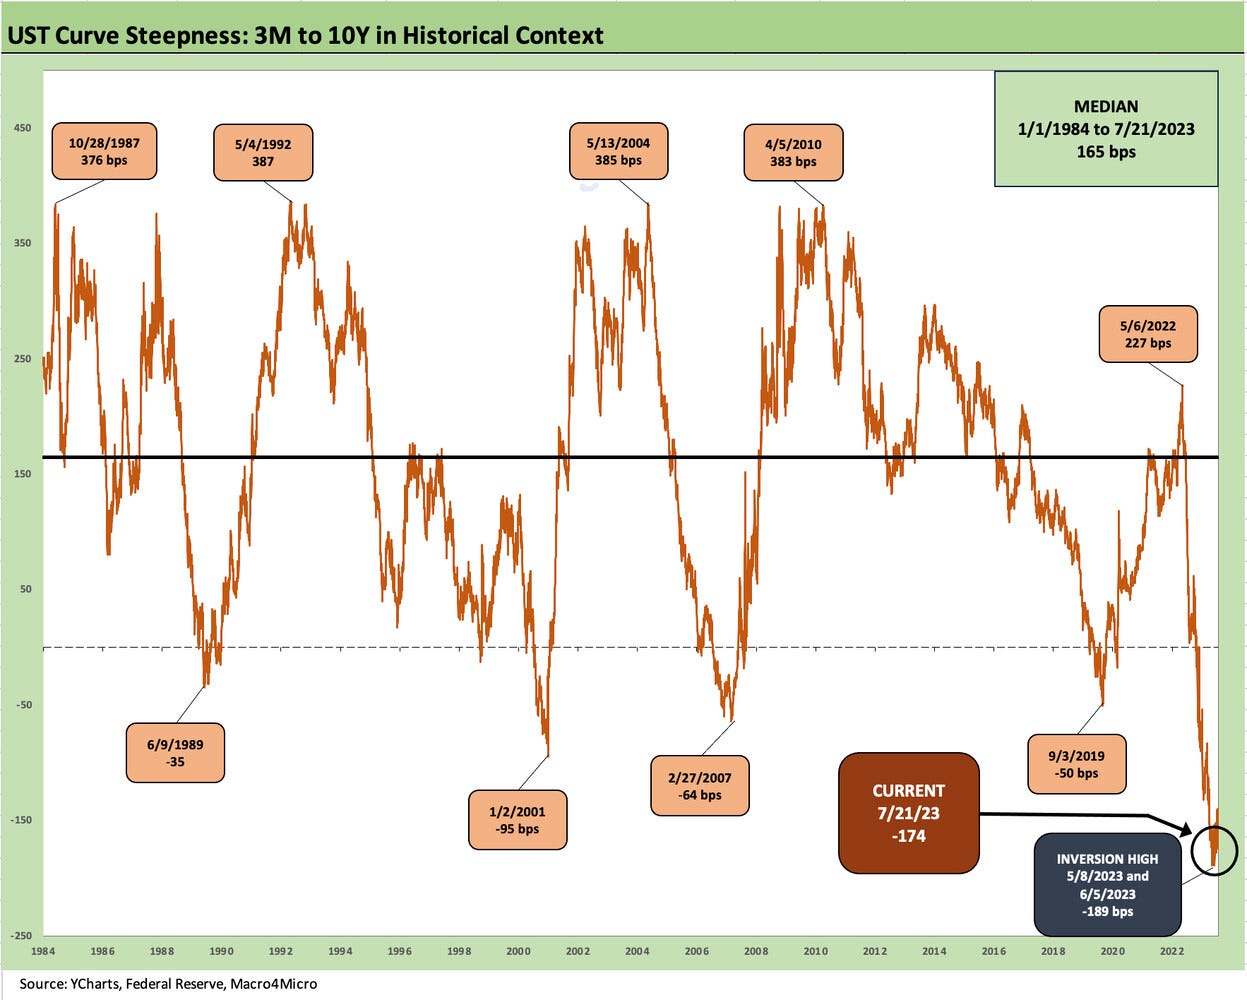
The above chart updates the 3M to 10Y UST slope and the inversion to end the past week. We see the -174 bps inversion only slightly inside the peak inversion of -189 bps on 6-5-23. The recent inversions in 3M to 10Y UST dwarf prior cyclical peaks.
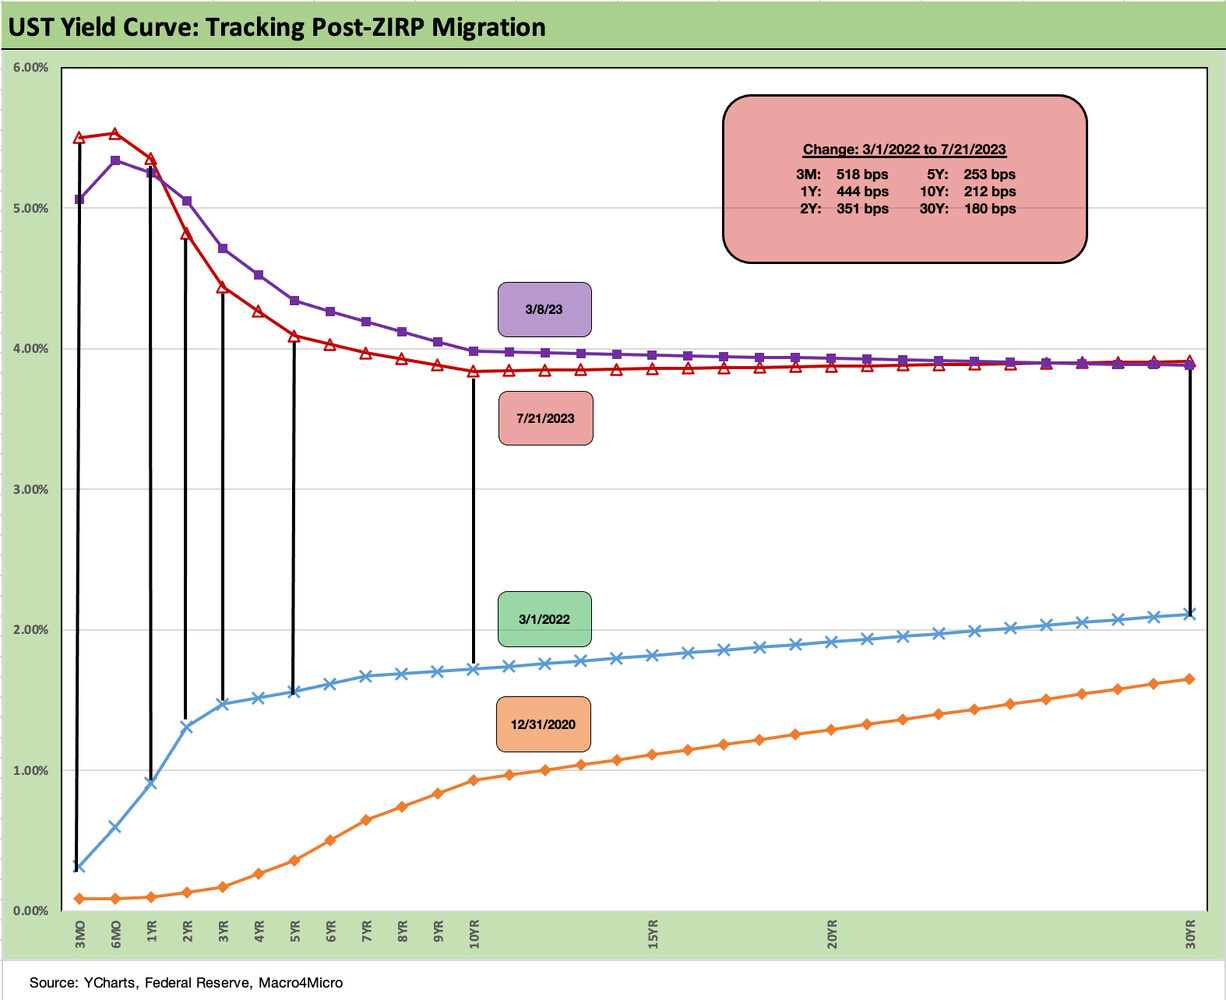
We wrap the yield curve update with the running migration chart from 3-1-22 as the Fed moved from ZIRP that month into a steady and aggressive tightening cycle. As aggressive as it was, fed funds only recently moved above inflation into a positive real fed funds mode (see Fed Funds – Inflation Differentials: Strange History 7-1-23). All eyes on services inflation this week and all ears on the Fed tone.
See also:
Footnotes & Flashbacks: Asset Returns 7-23-23
Industrial Production, Capacity Utilization: A Mild Fade 7-18-23
Retail Sales: Canary Syndrome 7-18-23
June CPI: Big 5 and Add-Ons…A Big Win 7-12-23
Employment: BLS Gongs ADP 7-7-23
Fed Funds – Inflation Differentials: Strange History 7-1-23
Good (Mixed) News: Sub-4% PCE Wins 6-30-23
FOMC: Hit Squad or Suicide Squad 6-14-23


