
Existing Home Sales: Bare Cupboards, Hungry Crowd
The tight inventory theme continues as we look at how mortgage rates have had different effects on existing homes sales vs. new homes.


The painfully low inventory levels (especially painful for brokers) continue to benefit homebuilders as availability supports builder prices and reduces inventory risks in peak selling season.
Volumes declined materially in June 2023 at -18.9% YoY with the two largest markets (South and West) both down substantially YoY.
The June median price of $410.2K is the third median above $400K since records started in 1999 with May and June 2022 being the first two.
The net takeaway is that the peak selling season is well positioned to sell down the higher base of spec inventory (completed or under construction) seen at many builders this year, with resilient pricing power being the prevailing reality despite high mortgage rates.

The chart above plots the existing inventory units since NAR started collecting the data. Considering the demographics of demand (favorable) and mortgage rates that are high but hardly unprecedented, it should not be a shock that prices have not been as battered as some of the more bearish may have predicted. High employment and the need for housing are strong economic forces.
Try as some may, it is very hard to get away from supply and demand. Those old school Econ 101 dynamics have dominated the supplier chain challenges broadly in the economy and set off inflation cause-and-effect realities. The same is true for home prices right now with so much in demand relative to what is available to buy (existing + new home inventory).
The economic effects are mixed. Those homeowners not interested in selling their homes are winners on the firm valuation of their property and the home equity resilience. That translates into good news for homeowners who were worried about what the effects of inflation, Fed tightening, and an onerous upward shift in the UST curve might mean.
In mortgages, we have seen periodic moves above 7% for 30Y rates. There is an important factor to keep in mind when considering mortgage rates. We often see warning labels around mortgage rates since the up-front points and fees often distort the rate lower. For example, the benchmark Freddie index is lower than many other quotes based on the up-front costs. Less fees can mean higher quoted rates depending on who is quoting. We use Freddie since it is the embraced benchmark.
Homebuilders are winners also since they can pick their spots on where to fill the supply void. The relative market share of home sales captured by the homebuilders helps them keep prices high and fund incentives where needed. We look at the builder share of all home sales further below.
Existing home price trends for June 2023 posted YoY declines vs. June 2022, but that is set against a month (June 2022) when existing home sales prices peaked at $413.8K. Volume also benefited last year from contracts in place that had lag effects on builder margins into 2H22.
It is no coincidence that homebuilding industry leader D.R. Horton (DHI) posted a banner quarter today at a time when existing home sales inventory remains down around multicycle lows. That is in a market where very strong demand has kept the supply-demand imbalance favoring those who can build new homes and can build houses at the right all-in cost for the pricing structure in any given regional or metro market.
We have looked at some of the major builders in more depth to gauge their ability to navigate this market, one a national leader D.R. Horton: Credit Profile 4-4-23 and the other a name with heavy California exposure (see KB Home: Credit Profile 6-24-23). The stories are good ones.
Gross margins have been squeezed somewhat for many builders, but actions on SG&A have helped mitigate some profitability headwinds while improving efficiencies, input costs, and a gradual shortening of building cycle times have all been part of providing a cushion for builder earnings. Some of the same supplier chain disruptions (notably appliances and fixtures) are evident in a range of industries. For most industries, those supplier chain problems have improved but are not gone.
The mortgage effect dichotomy for existing home sales vs. new home sales…
Before we get to the other monthly updates on the state of existing home sales coming out of June, the next two charts plot 30Y mortgage rates vs. existing home sales and new home sales. The mixed effects on “existing vs. new” in this market is extraordinary and ties into the oft-cited golden handcuffs of extremely low mortgage rates that are encumbering the refinancing economics for potential sellers in a post-tightening mortgage market where rates are hanging around 7%.
The effects are that homebuilders are picking up share in a market where demand is high and availability is pushing more buyers to the new home mix out of necessity.
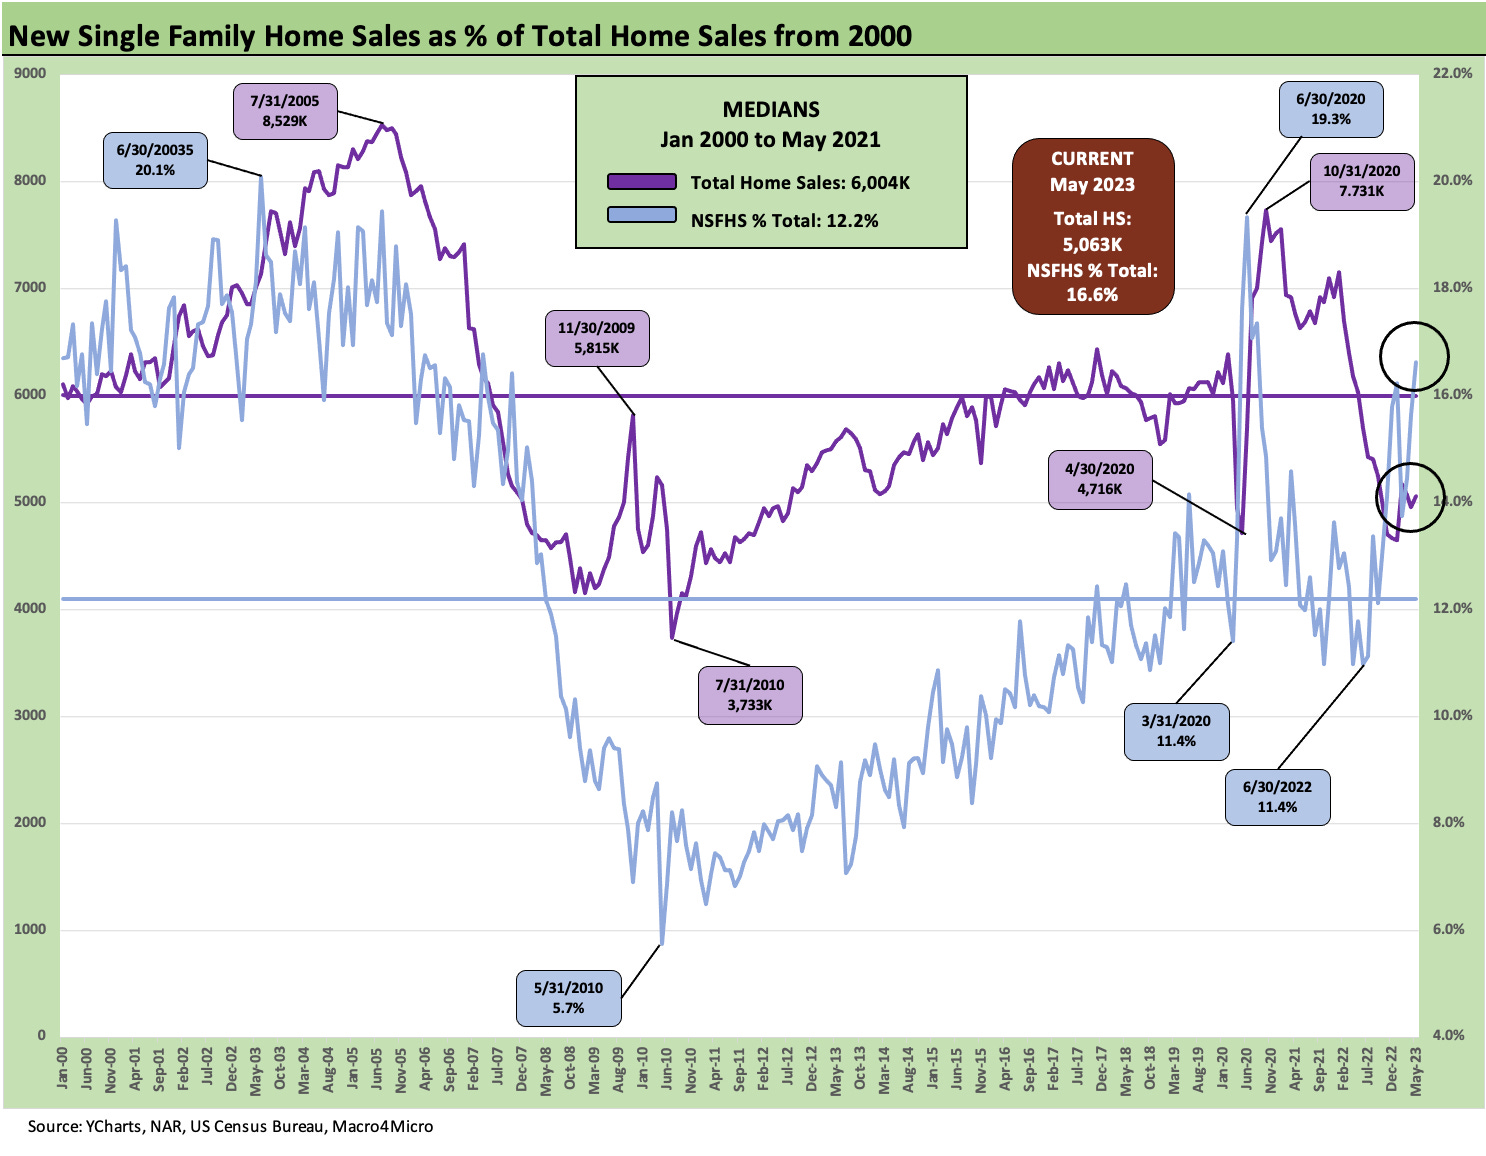
The above chart plots the total home sales numbers by units (existing home sales units + new home sales units) with the “new home sales” share plotted in % terms.
For May 2023 (new home sales get reported next week for June), the share is just under 18%. We see a low under 6% in 2010 and a median of 12.2% for the post-1999 timeline. The relative share for the builders shows wide swings from the housing bubble through the lows of the post-crisis period and then on to the swings of the post-pandemic period and later mortgage spike.

The above chart connects some more of the dots as we plot 30Y mortgage rates against existing home sales. The plunge to the brief lows of May 2020 on COVID shutdowns saw a spike and then an ensuing plunge into 2023 on the mortgage spike. We still see worse numbers back in the credit crisis for obvious reasons. The lenders were in dire straits, unemployment had spiked, and many houses were underwater with negative equity.

The above chart plots the 30Y mortgage vs. new home sales as a frame of reference. Nothing rivals the lag effects of the housing bubble implosion and credit crisis as builders lost credit access and many had a hard enough time finishing some projects as more than a few developers and subcontractors collapsed as well.
The impressive performance of the new home trend line in a market like 2023 stands out. Whether one sees pure demand vs. limited supply as the main event or the fact that there is record payroll and steady valuations in home values, the new home advantage in this market is evident.

The above chart updates the run rates of existing home sales vs. new home sales as reported each month. The new home sales data lags by a week and will be released next week on Wednesday (July 26).
The builders had to turn to more “spec building” this year to have move-in ready homes that could shorten the distance from the order to funding/closing. Some builders that were married to a “build to order” approach changed their stripes given the need to build inventory. The direction of cancellation rates during the mortgage spike needed a strategic response. The builders have worked around mortgage approval challenges for many potential homebuyers as we discuss in the builder single name research we do.
Builders have been very transparent in their strategies. The builder could come armed with mortgage buydowns, price flexibility, or fee-based incentives and make the process go more smoothly for buyers. For existing home sales, the concerns of what might lie on the other side of the sale in terms of new monthly payments or barriers to a seller’s “move-up” plans have been headwinds for 2023 and given an edge to builders. We have heard about these topics on builder earnings calls.
The builder’s role as beneficiary has been showing up in homebuilder equity price action and the solid numbers reported by builders. We will see more earnings releases dead ahead beyond DHI’s today.

The above chart frames the time series for total existing home sales (including single family, townhouses, condos, and coops) vs. existing single family homes. It is just another twist on the same broad theme.
Low, lower, lowest for monthly volumes in 2023…
The chart below goes back across a period that has been characterized by low inventory in 2021, 2022, and to date in 2023. The earlier low of May 2020 came during the peak of the COVID constraints before the vaccine (Nov 2020). The numbers since then show “how far we have not come in 2023.” One would expect higher given the strength of the consumer sector and demonstrated demand tailwinds. The supply is just not there. For some, the credit approval is not there.

The silver lining for the frustrated potential home seller is that the price action for new and existing home sales alike in this seasonal peak period show historically high price tags.
If mortgages hold up in the mid to high 6% range for a protracted period into 2024, the positive home equity balances look set to hold in well. We looked at some of these positive home equity topics and systemic debt questions in a recent commentary (see Consumer Debt in Systemic Context 7-13-23).

The above chart wraps the monthly look at existing home sales with a breakdown of the volume declines by price tiers of the single family sales mix. We also detail the % share of the market held by each price tier.
The sweet spot of the market is the $250-$500K range at almost 45% of the market. That tier is down by slightly over -13%. That is in line with the $1M+ tier, which marks a major change from earlier months such as March 2023 when the $1M+ segment was more than -29% lower and the $750K-$1M range was over -27% lower.
Whether it is the market psychologically adjusting, builders being more creative, a more bullish view on economic stability, or easier comps vs. 2022, the change in mix is material. The higher prices are seeing the relative declines shrinking.
See also:
Housing Starts: Multifamily Moonwalk 7-19-23
New Home Sales: Riding Higher, Steady Elevation 6-27-23