June CPI: Big 5 and Add-Ons…A Big Win
The June CPI numbers were very positive despite the sticky services number as CPI ex-shelter YoY of +0.7% is one worth pondering.
We run through the Big 5 CPI metrics and the Add-Ons that account for almost 86% of the CPI index with its very favorable headline level of 3.0% and Core CPI at 4.8%.
“All Items Less Shelter” at only +0.7% YoY is significant given the numerous asterisks attached to the quality and relevance of the Shelter line as it has been designed since the early 1980s makeover.
Services stays sticky at 5.7% with “Services Less Rent of Shelter” at 3.2% and some major skeptics on the quality of the Shelter CPI line at 7.8% and comprising just under 35% of the CPI index.
Fed funds is now above Headline CPI and Core CPI in line with historic norms.
The CPI line-up will get bandied back and forth on the bull side (3.0% headline, sub-1% less shelter) and the bear side (lingering Services inflation well above 5% and tight labor), but “a win is a win” even if an ugly win. The handicapping of the Fed on hikes gets another notch in the one hike column even if some will scream for no hikes. After the late July FOMC meeting, the debate on “how much higher and for how much longer” will get back in high gear but with a few weeks of earnings and guidance under the market’s belt.
Labor and wages will remain a focal point with the collective bargaining front and center into the fall with UAW on the front burner. The more recent jobs confusion between ADP and the BLS (see Employment: BLS Gongs ADP 7-7-23) leaves some room to expect better conformity in July numbers between the two and the same for the next round of JOLTS data on openings and separations (see Jobs: Mild JOLT for May Trumped by June ADP Shock 7-6-23).
Old school Fed policy has not encountered a wage-price spiral risk like the current one since he early 1980s (and most of the 1970s), so that connection will remain under intensive Fed scrutiny. Collective bargaining deals will carry some headlines to drive home the wage issues.
A quick run through the Big 5 and Add-Ons…
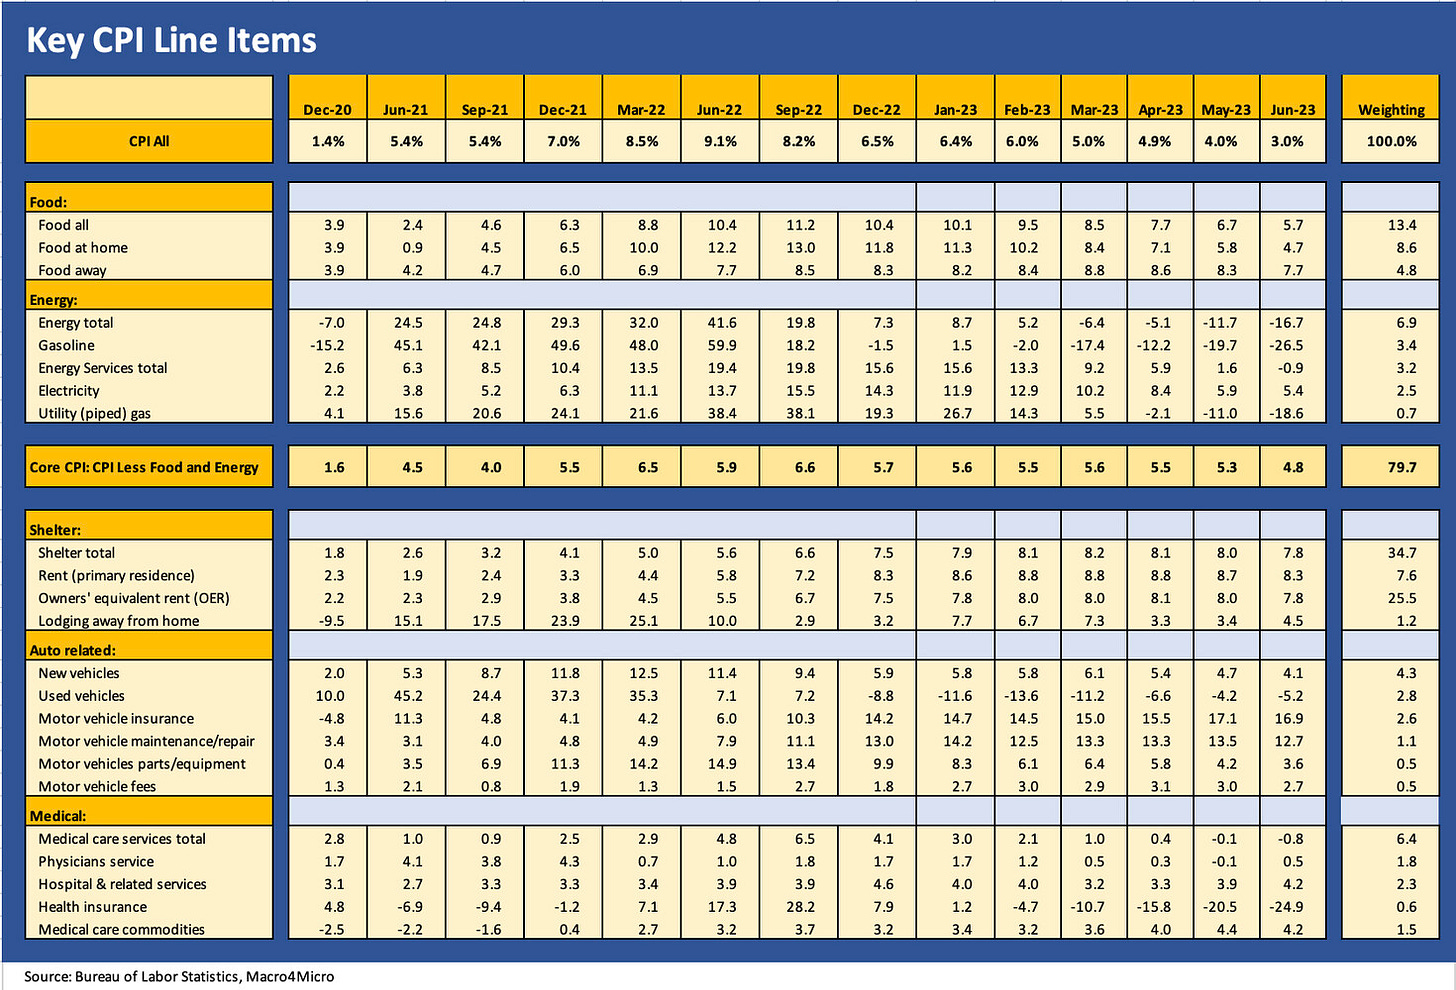
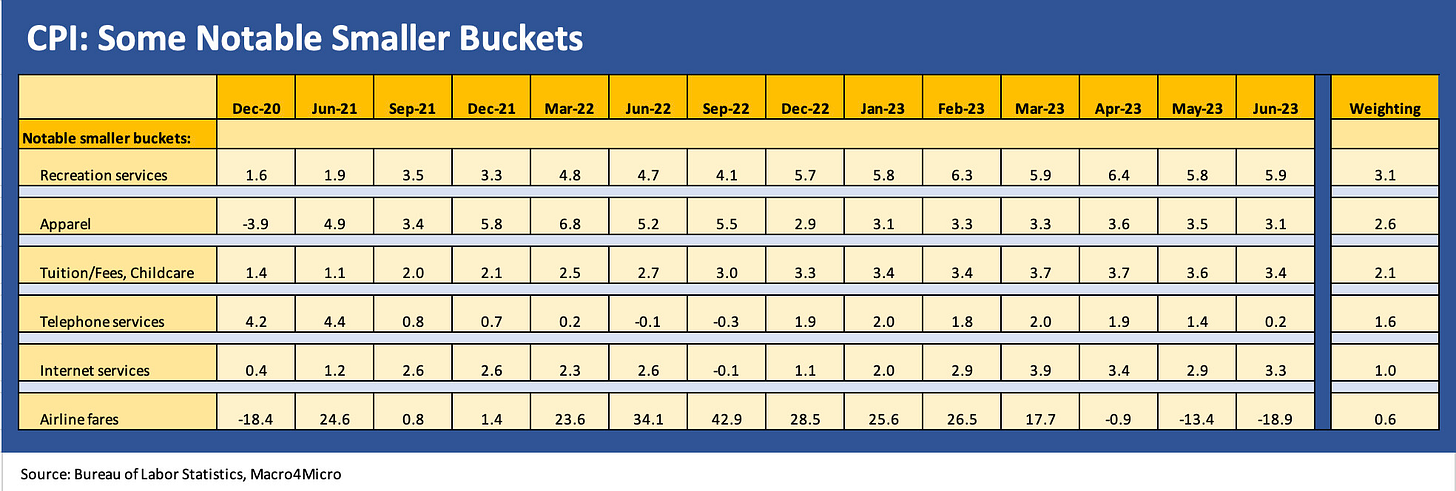
In the chart below, we do our usual monthly exercise of breaking out the trend lines for the largest 5 CPI sector groupings across Food, Energy, Shelter, Automotive, and Medical. These total almost 75% of the CPI index. We then follow with the Add-Ons that we selected since they are near and dear to many a household. Those total around 11% of the CPI index each month.
Looking at the Food and Energy, we see a decline even if Food is still too high. The cumulative effect of the inflationary period has eaten into a large share of the household budget at the grocery store. Lower inflation is still not actual price cuts after all this time of battering the consumer. Food inflation is still running well ahead of wage increases. That is the reality and on the way into an election cycle.
Energy keeps on the deflation trend line in both oil and gas and that flows into Energy Services at a lag as we finally see a negative price month YoY for the Energy Services line. Gasoline deflation was well timed for peak driving season and piped gas has headed lower with the natural gas weakness seen in the markets. Electricity is still on the rise above wages, which is a number that does not help those seeking to ban gas stoves.
We will not replay our view of the Shelter metric in the inflation picture, but the overall Shelter effect encourages an ex-Shelter view of the world. The “Rent of Primary Residence” CPI of +8.3% has very little semblance to reality in the markets and it carries little connection to the rental pricing trends that can be seen from so many different sources.
The “Owners’ Equivalent Rent” CPI of 7.8% with its 25.5% CPI weighting is a theoretical measure that bears negligible resemblance to the household cash flow life of the current homeowner with no mortgage or with a mortgage locked in at a 3% handle. It is a “Blue Book” question (dating myself there) that you need to get right in intro economics to make the Professor happy, but it does not connect to the reality of the consumer’s cash in, cash out existence. The All Items ex-Shelter CPI of +0.7% YoY unadjusted is supposed to make you feel good about where inflation is right now.
Overall, the automotive inflation trends have been positive on new and used vehicles with six categories lower in June than May. Our automotive CPI collection underscores how owning a car is an expensive proposition in its totality. The focus on new and used vehicles had at times neglected the other twists in the auto inflation story line (see Automotive Inflation: More than Meets the Eye 10-17-22). The trend line in auto insurance is brutal at a time when average transaction prices are rising for new vehicles and the financing costs of owning a vehicle (new and used) is rising in the absence of financing incentives.
We also recently took a look at used vehicle trends through the lens of CarMax as by far the #1 player in the space (see CarMax: Credit Profile 7-9-23). Contract rates in financing are rising, insurance is rising, so even if used car prices are down from peaks, the car ownership cost issue remains a household burden. Maintenance and repair inflation within the automotive CPI bucket offer a stark reminder of tight labor and skill needs in automotive where diagnostics and software rule so much of the vehicle’s operations.
The Medical CPI tallies were mixed but the overall Medical Care Services line was more deflationary YoY even if Physicians and Hospitals services ticked higher. Medical Care Commodities ticked slightly higher.
The above chart reflects our grab bag of household items that show 4 lower and 2 higher with Recreation Services up slightly and Internet CPI a few ticks higher. Airline fares show the benefits of materially lower aviation fuel costs.
Our bottom line on CPI for this month is that the news is very good, but we don’t see why the FOMC would not stay locked in on the higher Services inflation number and tight job market to press its advantage at this point with growth a question mark into the fall. The fed funds rate is now only slightly above both CPI and PCE rates, in line with historical norms. That comes after a protracted period that differed markedly from the Volcker and Greenspan years as the inflation wars carried over into the 1980s expansion periods (see Fed Funds – Inflation Differentials: Strange History 7-1-23).
See also:
Good (Mixed) News: Sub-4% PCE Wins 6-30-23
FOMC: Hit Squad or Suicide Squad 6-14-23


