Footnotes & Flashbacks: Asset Returns 7-23-23
We look at a range of asset classes and industry groups for returns in what was a positive week for risk.
We run through a cross-section of returns on the week across broad benchmarks, asset class proxies, subsectors, and industry ETFs to capture the top-down and bottom-up flavor.
Equities have had a very good run and bonds overall have been treading water with mixed bouts of duration strain but credit spreads at least delivering positive excess returns so far in July.
The UST bond market has underperformed cash and credit assets as the UST curve remains in a mild state of confusion on where we go from here.
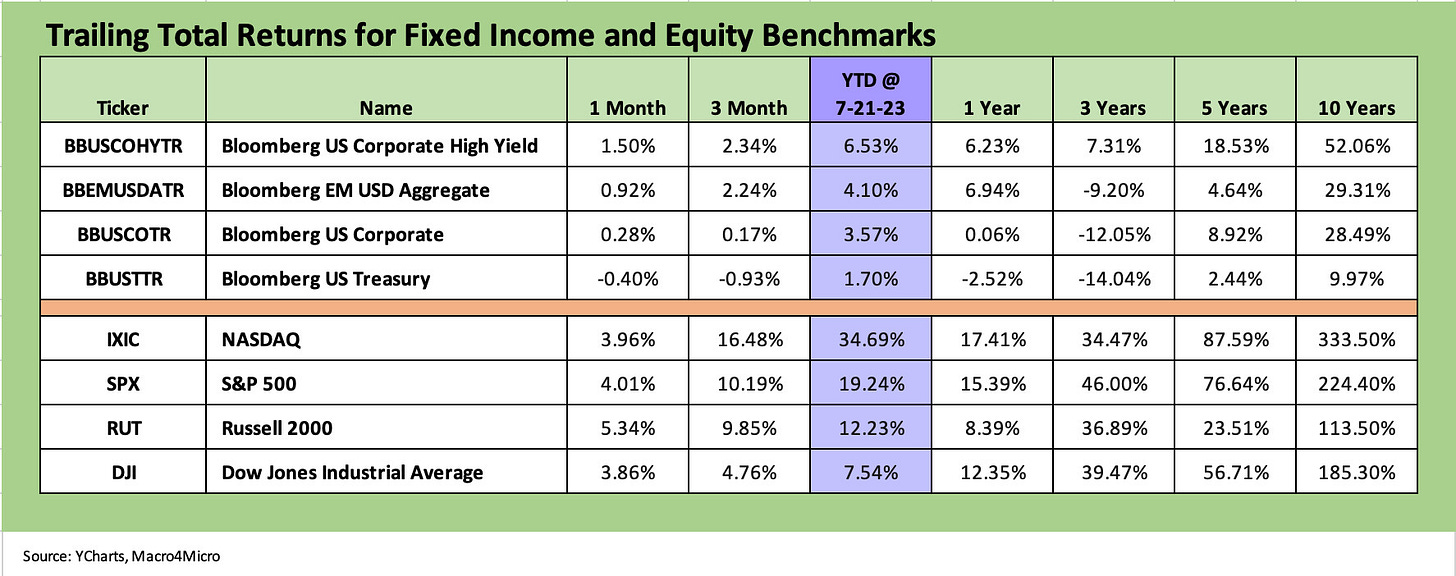
The above chart breaks out our usual collection of returns across bond and equity benchmarks. We line up the respective asset class returns in descending order of total returns for the YTD period.
We see only one fixed income class above 1% for the trailing one month period as coupon income and tighter HY spreads kept US HY in the lead. Quality fixed income and duration has struggled with the UST bringing up the rear for 1-month, and 3-month returns with modest positive YTD.
Equities keep the beat going with the broad market benchmarks turning in solid numbers with even the Russell 2000 in double digits YTD. Small cap strength is a good sign for the long tail of issuers that have more in common with the HY credit universe and small to midcap loan only market. The small caps have in fact taken the total return lead for the trailing 1 month.
The above chart updates the 1500 and 3000 series as Industrials and Value mount a comeback and the out-of-favor names in Financial and Real Estate are moving up the rankings for the 1-month period. Also rallying is the Energy sector as oil took on a better tone this week with some help from Middle East jawboning.
Major Banks and Regional Banks came through earnings season in solid enough fashion in terms of the market reaction. The deal flow and margin pressure for banks was already embraced as a fact of life for many, and perhaps the markets voted on the absence of major negative surprises.
Morgan Stanley received headline accolades and Goldman rallied despite a weak quarter. Consumer-oriented finance operations were more mixed. The Regional Bank ETF (KRE) performance for the week and the month helped pull KRE back toward the middle of the pack for the rolling 3-month period. We see that effect above also.
Real Estate has been getting fresh legs as the market has been more discriminating in its view of the sector. Real estate turned in a solid month that comprises most of its YTD returns, but the trailing 1-year return is still the only one on the list that is negative. While there is ample reason to be concerned about some parts of the CRE market (notably the office sector), debates around how real estate credit contraction will play out and the degree of tenant stress have not been easy for the REIT sector to counter.
Higher rates shorten the real estate cycle and hurt income stocks by definition, and it is hard to argue against the idea rates are working against the sector. If the UST curve does in fact move much lower, that gets back to the other side of the debate on what drives the curve lower and how that plays out for tenants and credit lines.
The only YTD return line that is in the red on the above list of 1500 and 3000 benchmarks is Energy at -1.7 YTD despite the +22.2% trailing 1Y. Energy returns are much higher if we go back to the mid-2020 start date for 3Y when oil was in the tank during COVID. Energy is always volatile, and the period ahead will be no different as China downturn risks get kicked around (as always), cartel behavior gets its usual prominent role every few months, and the growing US energy dependence (whether fact or fiction and whether that includes Canada as an enemy) gets into the election dialogue. Energy and E&P have been bouncing back the past week and month as covered in the ETF section below, but we are not where the market expected Energy pricing to be about this time last year.
ETF returns across time horizons…
In our next three asset return charts, we cover 1-week, 1-month and 3-month time horizons. We look at 26 different benchmarks and ETFs. We recently added equal-weighed ETFs for the S&P 500 (RSP) and NASDAQ 100 (QQEW) given the market cap weighted distortions in the total returns for those benchmarks driven by the mega-names.
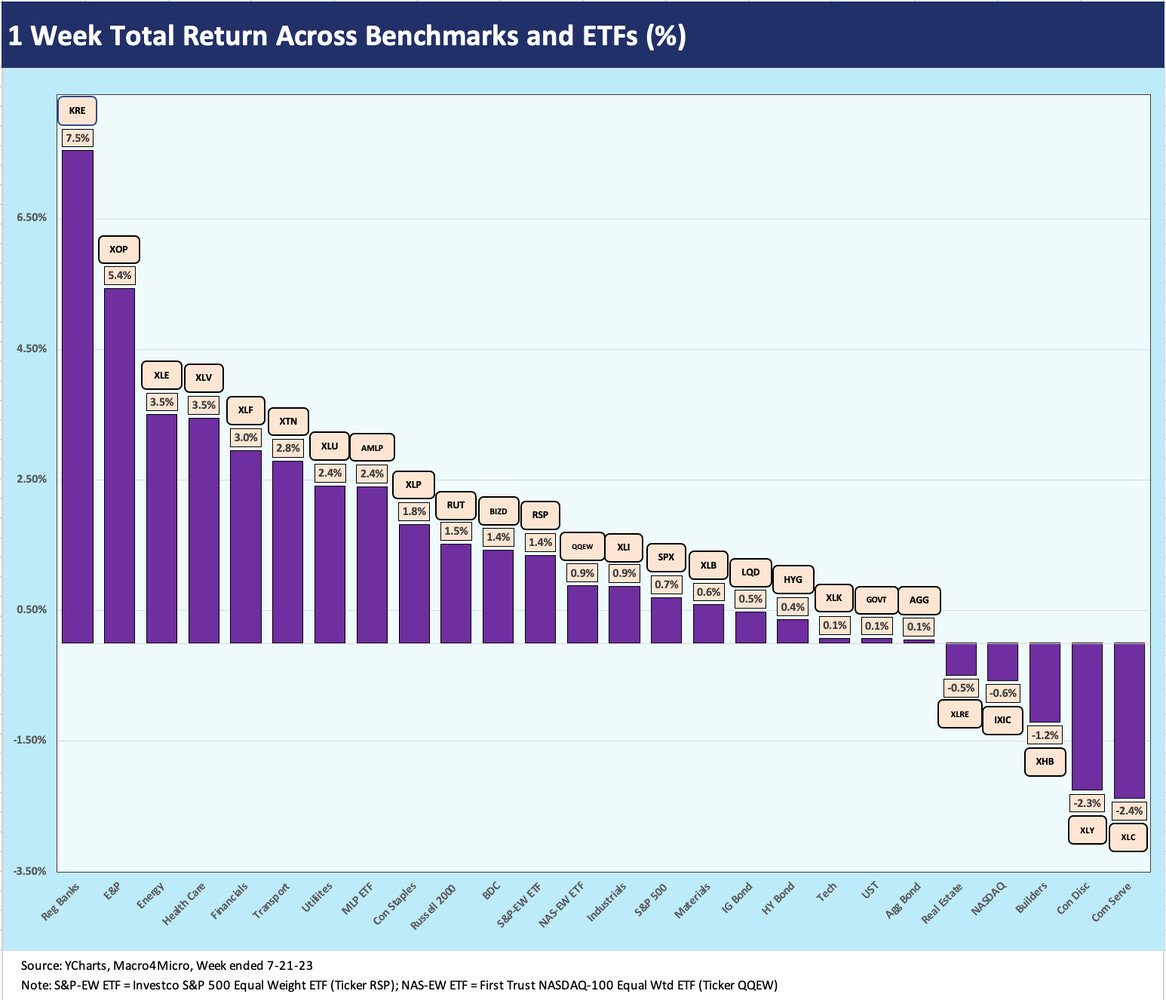
The ETF and benchmark collection above posts 21-5 on the positive side after an all-positive win last week (see Footnotes & Flashbacks: Asset Returns 7-16-23). It was an unusual month with no ETF in the Top 10 being anchored by a Magnificent 7 member (such as we see in XLC, XLY, XLK who are over on the right side this week)
Perhaps the most important bar on the chart is the KRE return of +7.5% on the week as the market seems to be buying the story line from the regionals after a disastrous spring. KRE also ranks #1 for the trailing 1-month period in the next chart. The overall Financials ETF weighs in at #5 behind Healthcare (XLV).
The Energy rebound is showing up in the Top 5 with E&P (XOP) and the diversified Energy ETF (XLE) at #2 and #3. The Midstream ETF (AMLP) with its lower risk and higher income returns is back in the Top 10. These three show up in the Top 10 for the trailing 1-month period as well.
NOTE TO READERS: We recently added our LinkedIn content to the Substack platform. For those looking for an easier way to access all archives and links and get preset emails, we recommend signing up.
The 1-month time horizon remains heavily positive in the strong equity market run with 24-2 positive. Only high quality fixed income was in the red with GOVT and AGG while LQD and HYG round out the Bottom 4. The Top 10 across the past month show a good balance of sectors in cyclicals and financials with Energy, Builders, and Transports as a group not sending signals of economic weakness.
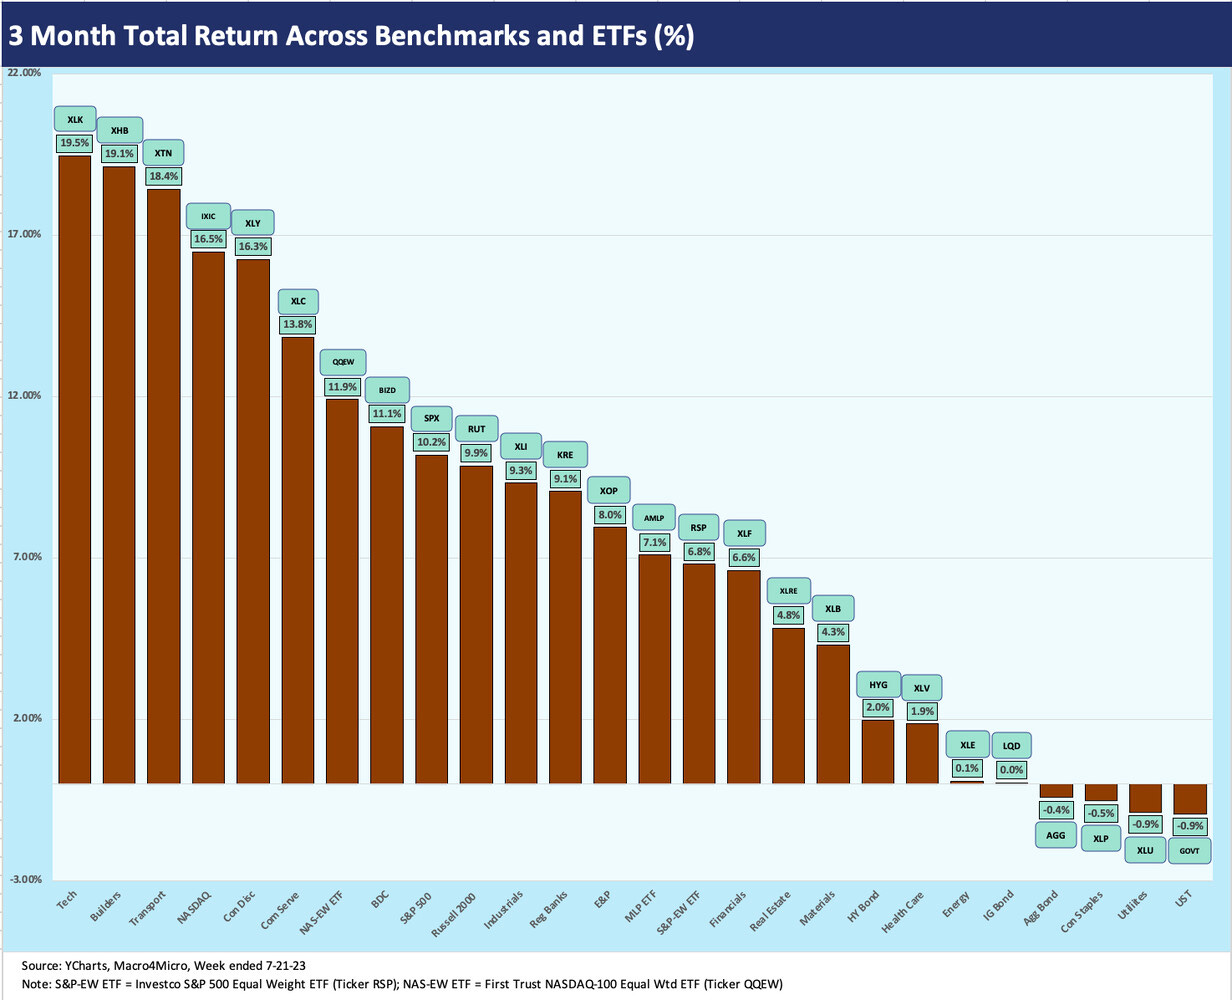
Rounding out the ETF time horizons, the 3-month period comes up with 22-4 positive including 2 of the 4 bottom in high quality fixed income. IG bonds (LQD) round out the Bottom 5. So much for bond diversification during this time period. We see the NASDAQ, the NASDAQ 100 equal weighted ETF (QQEW), the S&P 500, and Russell 2000 all in the Top 10.
We see some big winners in Tech and tech-centric exposure as well as in Transport at #2 and Homebuilders at #3. Among interesting names in the Top 10 is the BDC ETF (BIZD) with its heavy dividend yield and mix of exposures that have more in common with the Russell 2000, who sits just behind it at #10.
Our main takeaway from the winners and losers across these time horizons is that there is very good diversity of industries and exposures in the Top 10 across these periods with the laggards chasing the early winners and the winners in large measure holding up. We see more cyclicals closing the gap, financials calming down, and energy making a small push from the out of favor bucket.
See also:


