Good (Mixed) News: Sub-4% PCE Wins
We look at the latest release for PCE inflation and Personal Income and Outlays as the mixture of parts bring net good news.
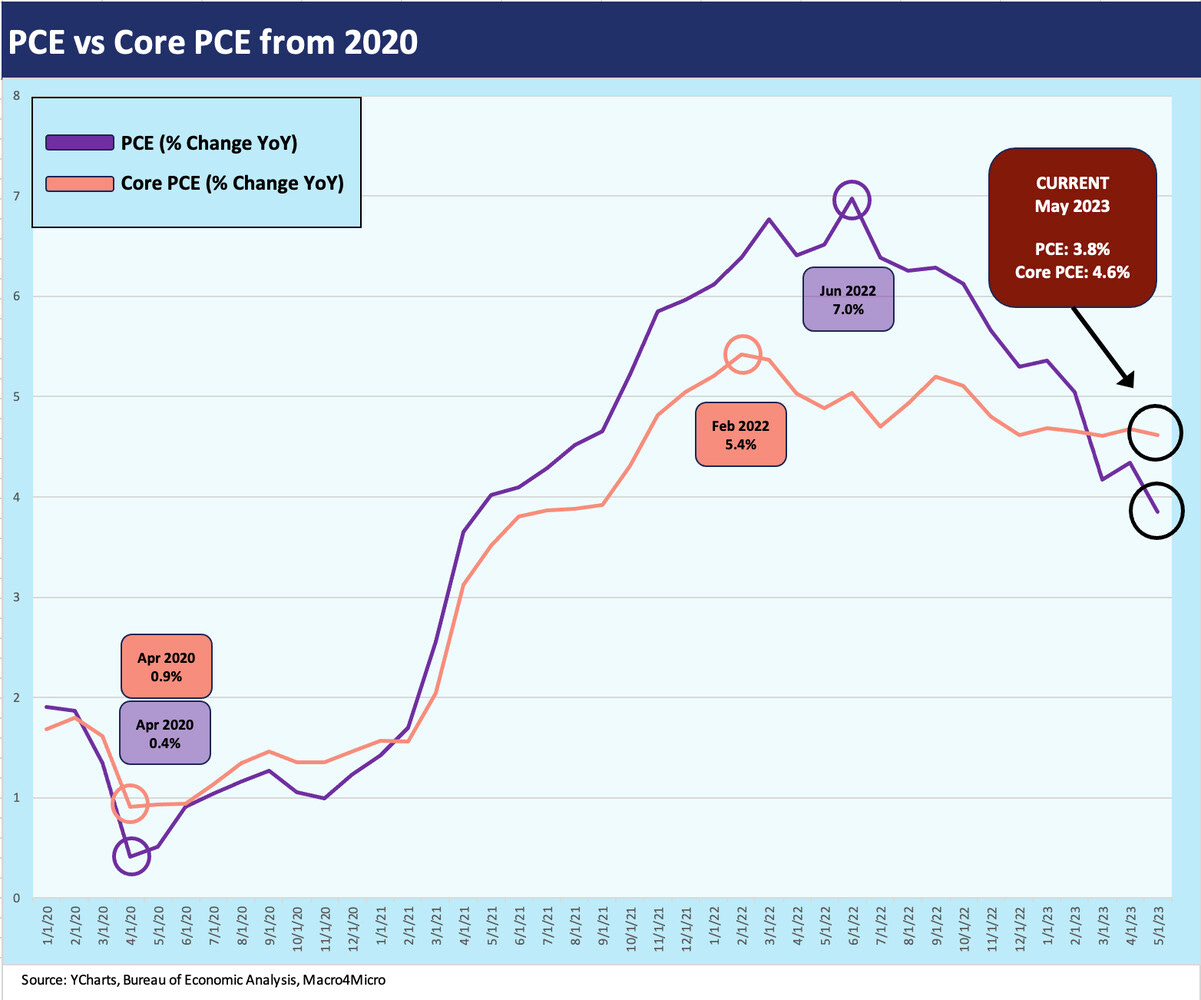
The Personal Income and Outlays report is a Fed favorite for its PCE inflation gauge, and the headline PCE number of 3.8% for May brings the good news of a sub-4% inflation measure.
The constructive news for the equity market is that the consumer stays solid, but the balancing act is always tricky with the stubborn inflation in Services and Core PCE sticky at around 4.6%.
PCE and Core PCE inflation metrics are the most immediate focal points in the dozen pages of text and tables in the Personal Income and Outlays report. The Personal Income and Disposable Income data and how that frames up vs. Personal Consumption Expenditures is the economic drill-down part of the release.
The decline in YoY PCE Price index trends to +3.8% is still the main event for most while Core PCE YoY of 4.6% is like the stubborn metric we saw last month (see Personal Income and PCE: Inflation Stickier 5-26-23). The net takeaway on inflation is net good news but that 4.6% core number is like the Core CPI (5.3%) in being less than helpful for the FOMC.
The trend line of higher fed funds and sharply declining inflation in 2023 has resulted in a more rational and conceptually appropriate relationship between fed funds and inflation. With fed funds targeted in the 5% to 5.25% range, we now see positive fed funds rates with fed funds in excess of headline PCE (3.8%) and core PCE (4.6%). The CPI situation is on the cusp with fed funds above headline CPI but just short of Core CPI (see May CPI: The Big 5 Buckets and Add-Ons 6-13-23).
That fed funds relationship with CPI and PCE metrics was always a worry and something had to give in the form of lower inflation and/or higher fed funds (see Fed Funds vs. PCE Price Index: What is Normal? 10-31-22, Fed Funds-CPI Differentials: Reversion Time? 10-11-22). The Volcker history in his battle with inflation was that you needed a protracted period of fed funds in excess of inflation to break it.
There has not been an inflation threat like the current one since Volcker, so there are not lot of data points to work with other than the failures of the 1970s (pre-Volcker) and the later successes of Volcker as he kept the hammer down all the way into the early 1980s recovery on the fed funds relationships with inflation. I fondly remember (not really) my “prime plus” loan in 1980-1981 that weighed in at a cool 23% at one point. That inflation took sustained positive fed funds vs. inflation, and the jury (i.e., the FOMC) is still out on that approach.
What worries market watchers on Fed policy is that we are only now getting there on positive fed funds vs. CPI and PCE. In the end, the PCE move to 3.8% is good news, but the sticky core PCE number of 4.6% gets tied back into Services inflation, which weighed in at 5.3% for May YoY. In contrast, Goods PCE price inflation was only 1.1% (Durables 0.7%).
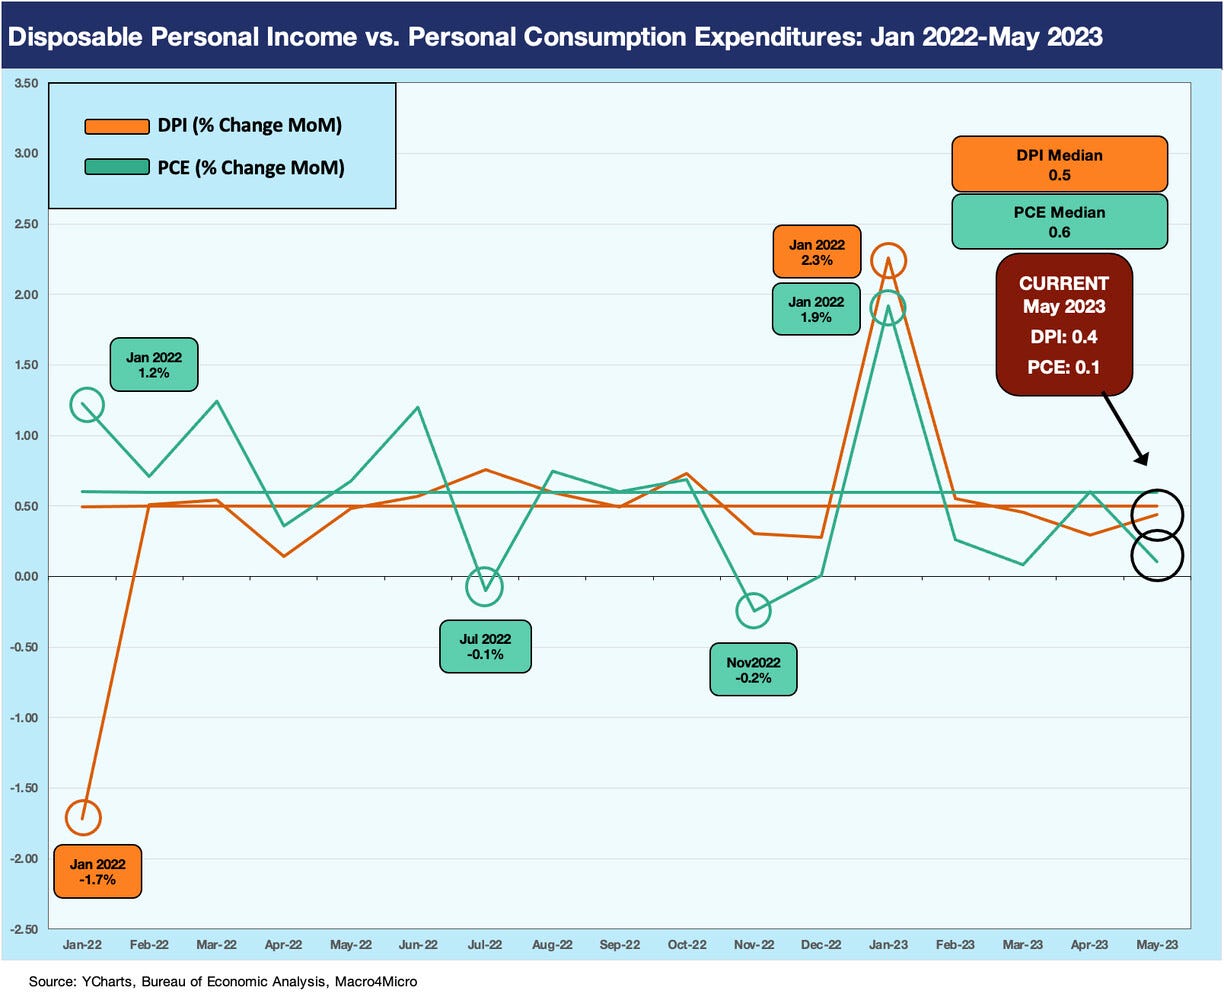
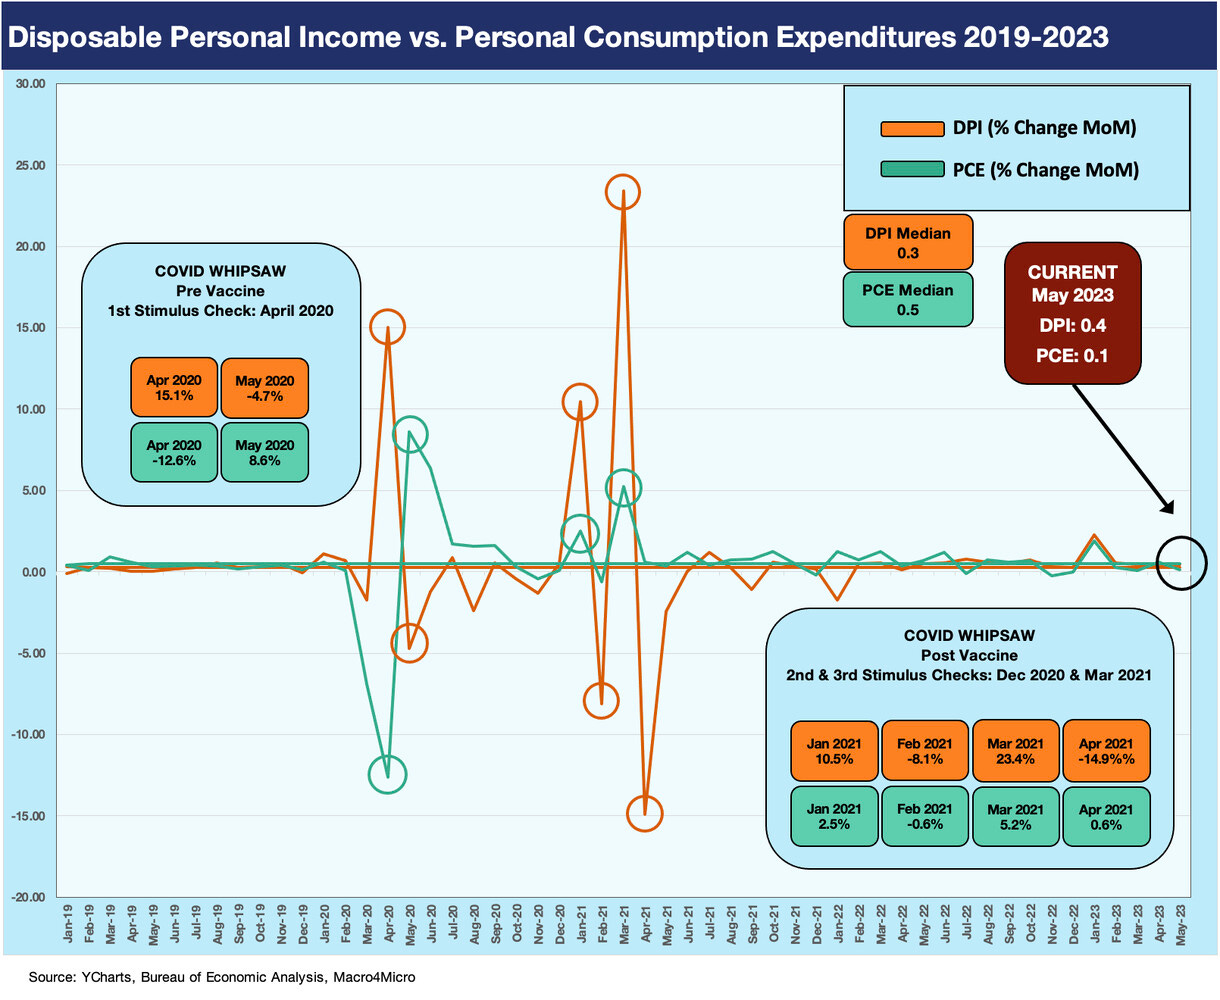
The above chart looks at the DPI vs. PCE time horizon since just before the Fed embarked on a tightening cycle. We had to use a stand-alone chart for these metrics from 2022 for visual effects alone. As we show in the next chart, once you drop in the periods of COVID impact and fiscal response, the scale of the charts makes the 2022-2023 time series hard to read. A 2% monthly number above is a big move. Looking back into the COVID peaks and related responses, the normal monthly numbers get dwarfed.
Real Disposable Income (Personal Income less taxes) was 4.0% in May YoY and was the best number of 2023 so far. Inflation is moving lower, and income is moving higher. The trick for the Fed is to manage any perceived risk of a wage-price spiral, and that gets challenging when employment is bullish and pricing power a reality in the markets. The tough talk on fed funds in the recent FOMC “hawkish pause” is likely part of the inflation expectations management (see FOMC: Hit Squad or Suicide Squad 6-14-23).
Sequentially, the consumer spent less on Goods in real terms but more on Services. In current dollar terms, Goods spending contracted while Services spending rose. Positive personal consumption expenditures sequentially in current dollars were lower than the April increase and in line with March.
The above chart looks back across some very wild times during COVID and the distortions created not only on the PCE consumption trends but also in the income line given the very aggressive and very supportive fiscal responses. The fiscal actions have led to a lot of finger-pointing on what exactly were the underlying causes of inflation. The layers of the inflation and supply-demand picture are very complex, and the reality is that anything that promotes demand can be framed as inflationary. The supply piece is usually ignored for political purposes.
We have discussed the topic of Biden’s stimulus in a prior commentary on the need to be objective in framing the role of what stimulus legislation actually meant in the bigger picture (see Inflation Rorschach Test: Looking at Relief and Stimulus 2-7-23). Our view is that the Build Back Better plan would have certainly been more inflationary, but the stimulus of early 2021 does not stack up as over-the-top demand distortion when plotted against PCE trends.
Our angle on COVID related stimulus and relief was that “Filling in a hole is not building a hill.” We don’t need to revisit all that here. The main point in the relief was one fiscal stimulus package under the GOP was less focused on households and the next one from the Democrats was more focused on households. That was fairly predictable behavior practice across the two parties. It just happened to straddle an election and made for compressed timing. We viewed both moves in fiscal support as old school “buying love.” That is not a new approach to politics. Supporting demand with a fiscal pile-on and the Fed freely using ZIRP and QE in the face of a supplier chain collapse does not lend itself to soundbite analysis. But such is politics.
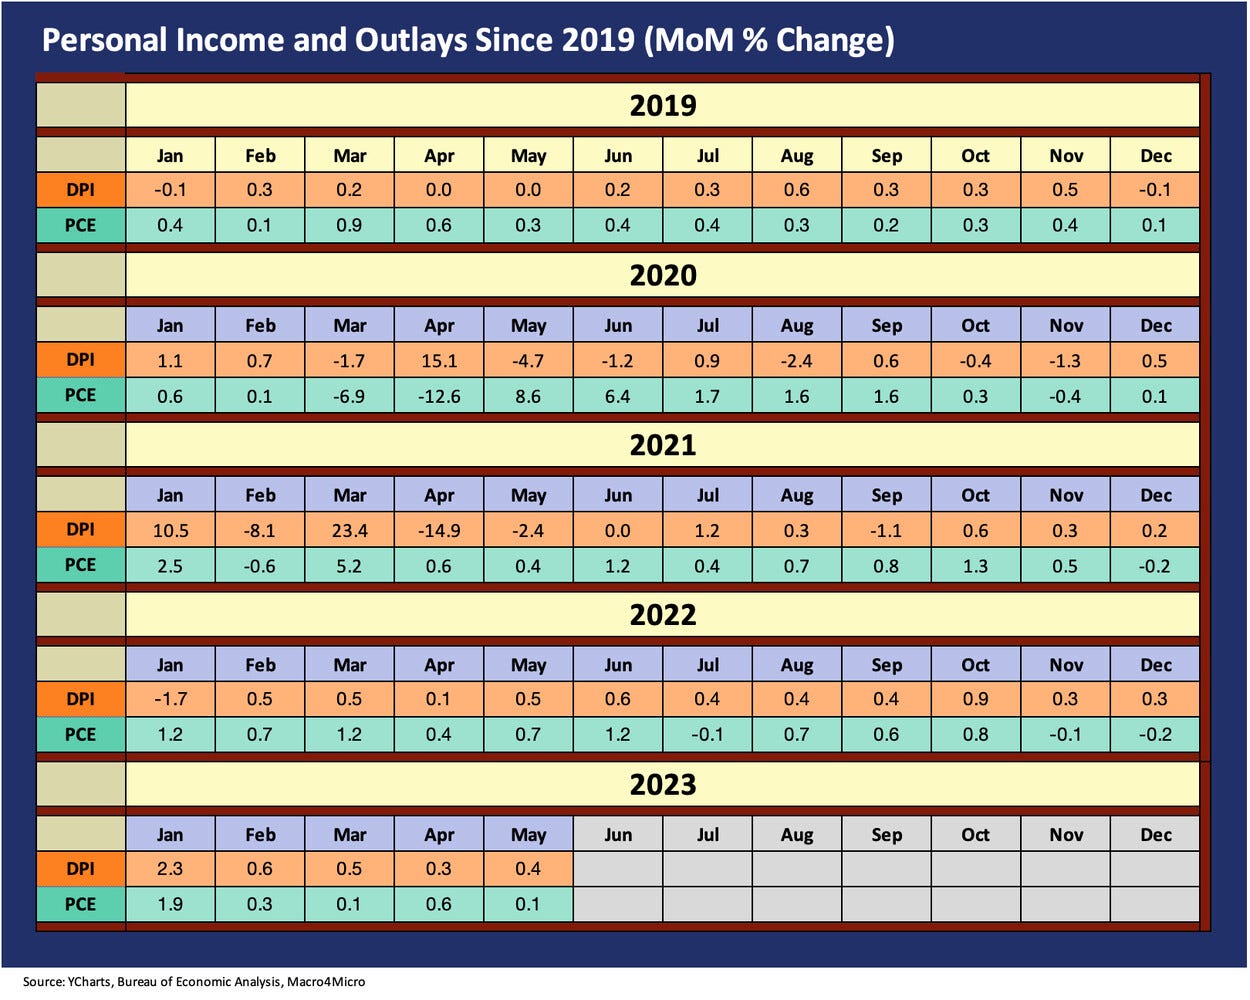
The above chart updates the monthly Disposable Personal Income and PCE histories since 2019. It is not hard to find the outliers. Each month has more than its share of revisions. The good news for equities is PCE is still positive, and DPI is still positive. That said, the yield curve needs to stay on alert.


