Employment: BLS Gongs ADP
We do a deep dive on the June payroll deltas across occupations for a range of trailing time horizons.
The big 24-hour swing in job headlines from ADP to the BLS data gets the market back to the simple reality that the payroll count ticks higher to a new record each month.
We look at the headline trends and then dive into the June private sector occupational deltas for a range of trailing time horizons back to the pre-covid period.
The bears still face the challenge of specifically citing which subsector lines might be exposed to sharp cuts in the quarters ahead.
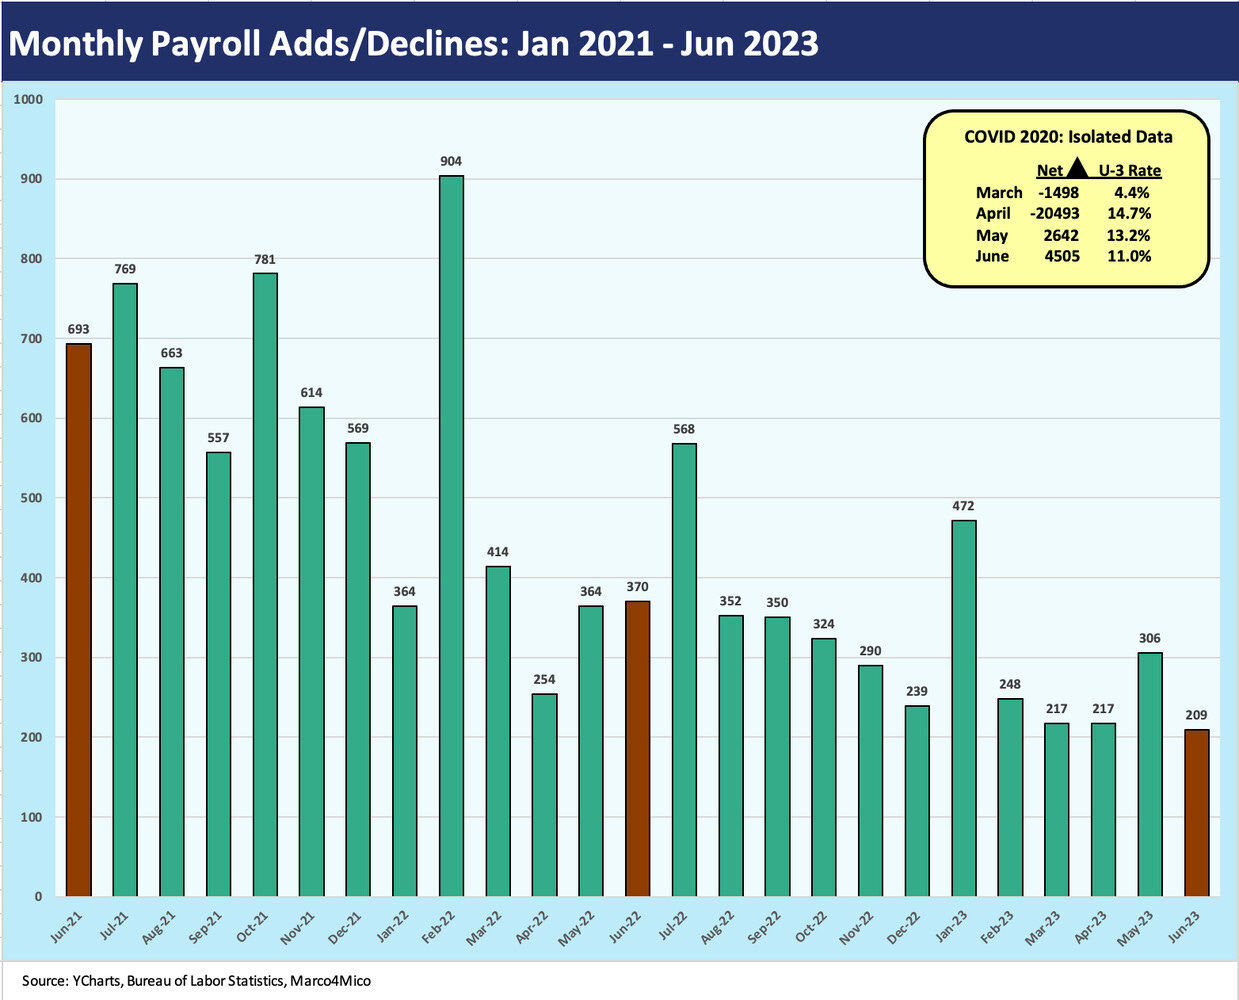
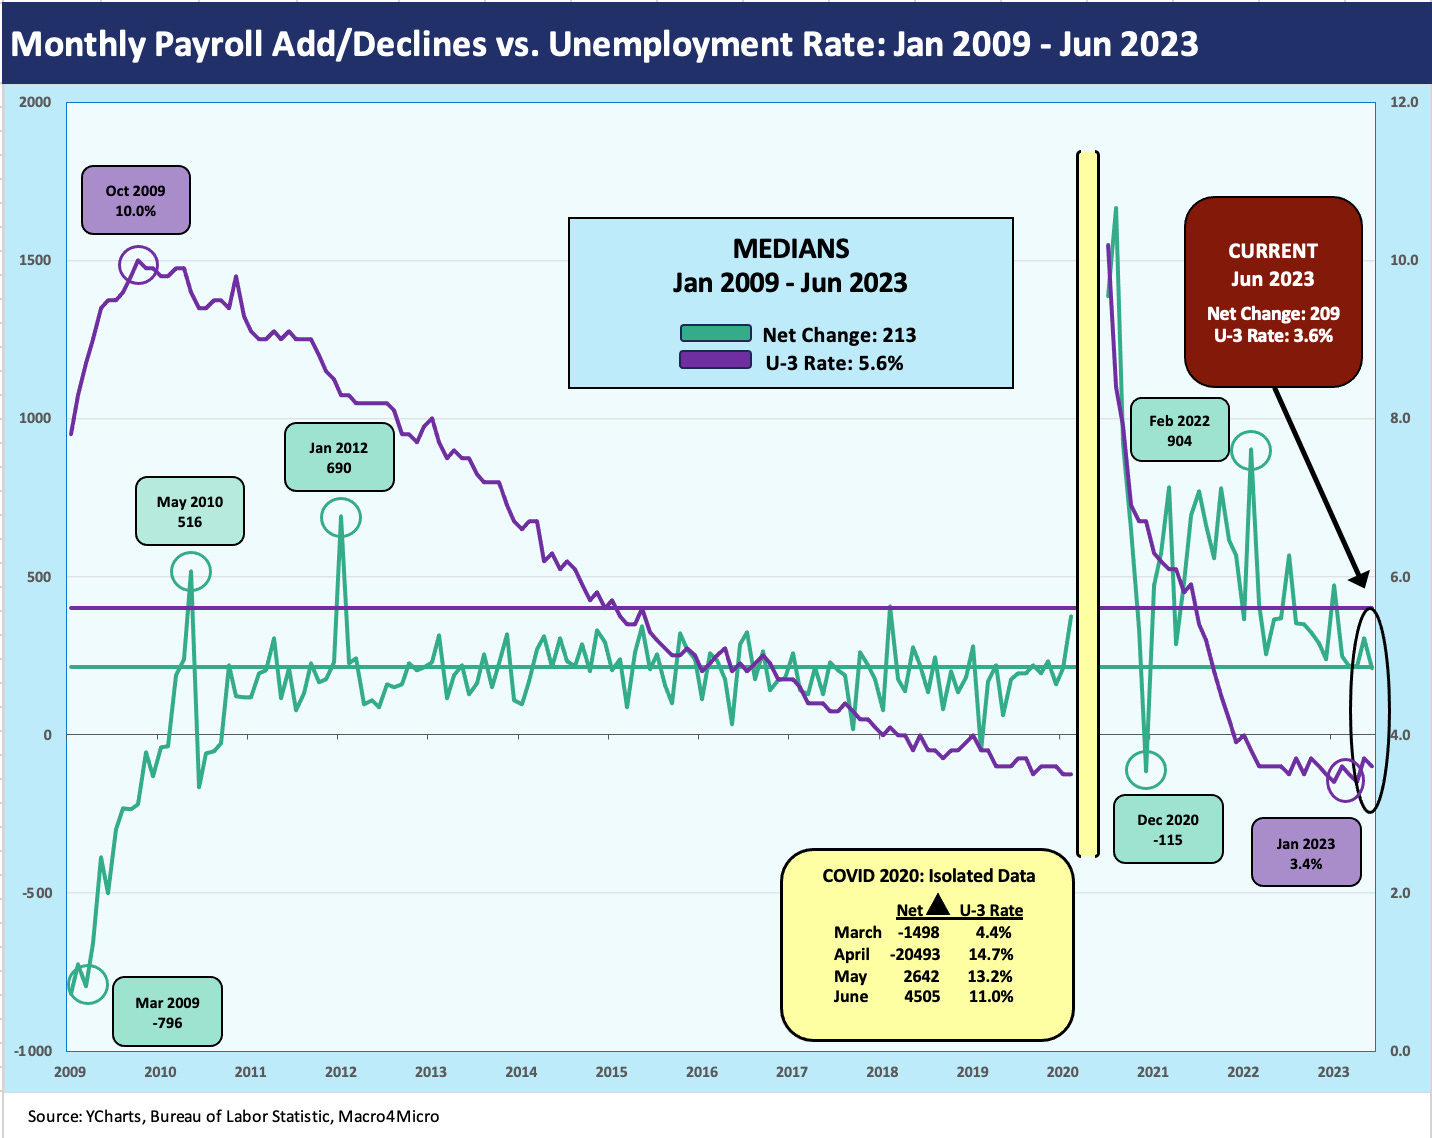
As highlighted in the chart above, the job adds just keep rolling in even if the headline numbers show some easing of the recent pace. The report today was certainly well below what was signaled by the ADP data yesterday at close to 500K. That came on the same day as JOLTS (see Jobs: Mild JOLT for May Trumped by June ADP Shock 7-6-23), which showed some easing in the data delivered at a 1-month lag. Job openings of over 9.8 million remain well in excess of the 6.0 million unemployed in today’s release. A 209K increase in the BLS data brought a decline from 3.7% to a 3.6% unemployment rate, which stays in the narrow band of 3.4% to 3.7% since ZIRP ended in March 2022.
Below we plot the timeline for total nonfarm payroll across the decades from 1972. We plot that alongside the unemployment rates. History shows that 3% handle unemployment rates (U-3) are rare. The April 2000 jobs number after the TMT cycle peaked was a date that saw a lot of market turmoil in the time that followed but with a very muted economic downturn. The February 2020 lows at 3.5% rolled into a brutal pandemic.
Those dates are easily lumped into the “very unusual” category with a few asterisks attached. The same is true of this current cycle with an inflation spike not seen in over four decades. That should promote humility on making too many assumptions based on the past. There are a considerable number of secular changes underway in trade (back to protectionism, geopolitical risk, etc.), in well-funded and incentivized mega-projects, and in supplier chain pressures to name a few.
In the tables further below in this commentary, we look across the broad occupational categories from goods to services and the narrow industry mix for the job changes this month, YTD, LTM, and back since January 2020, or just before the COVID onset. As a reminder, COVID brought a Feb 2020 cyclical peak and a two-month recession that troughed in April 2020.
We routinely detail the jobs side of the pandemic period in our monthly JOLTS updates, but it is always a useful exercise to drill down into the occupation totals every now and then. The last time we did a deep dive into the occupational histories was for the April 2023 employment report (see Employment April 2023: Post-COVID Deep Dive by Occupation 5-5-23). We plan to do these deep dive recaps at least quarterly as well as the usual monthly updates.
In the midst of all the bear and bull debates on the cycle, the ultimate challenge to the bears is to ask “Ok, which occupation lines will see jobs materially reduced and why?” The contraction themes are usually well defended at 20,000 feet, but pointing at the jobs lines in the tables below is where it gets real.
That part of the exercise is where the next level of drill down specifics requires a transmission mechanism to explain large scale layoffs or steady, slow decline in headcount. Check them off…Construction? Durables? Nondurables? Which manufacturing line? Autos? Aerospace? Defense? Capital Goods? Supplier chains? Which services subsectors? Lower paid services jobs only? Which payroll counts will remain sticky? What about skilled or semi-skilled labor needs? How does the labor hoarding theme size up? Which sectors? There are no shortage of job themes and cyclical scenarios to spin.
The June BLS numbers show a mild slowing of jobs growth, but records keep falling…
The simple view is that total nonfarm payrolls keep reaching new highs. The above chart frames payrolls and job openings. That is a very constructive backdrop that the Fed is watching closely. More payroll means more paychecks, and that in turn feeds consumer/household spending even if purchasing power per capita has faded during the inflationary spike of late 2021 through 2023. The consumer bears see the credit lines and the cash reserve depletion as headwinds in 2H03.
The affordability challenges for consumers did not suddenly go away even if the June wage growth number from today’s release (+4.4%) beat headline CPI and PCE. On the downside, the reality is that the hourly growth lagged Core CPI and Core PCE (see Good (Mixed) News: Sub-4% PCE Wins 6-30-23, May CPI: The Big 5 Buckets and Add-Ons 6-13-23). Either way, we still use the Big Mac theory (i.e., more payroll, more spending…3 Big Macs is more GDP than 2 Big Macs).
Spending and the impulse to spend matters, and key industries such as automotive are on the rise. We know consumer credit quality is eroding and will get worse, but that is a balancing act with more consumers employed than ever. Those monthly job adds as framed below have a very tangible effect on the economy and the demand for bodies in the real economy to serve those customers.
Layers of employment…
In the following series of tables, we frame the various payroll lines for a few trailing time horizons (post-Jan 2020, LTM, YTD, MoM). We detail the Private Sector payroll line of 133.5 million. We leave the 22.7 mn government jobs out of this deep dive exercise but summarize it in the high-level chart below.
The two (private sector + government) combined for a total of 156.2 mn. For June, Government jobs had another big month at +60K, which is in line with the YTD average of 63K per month. The total Government employed is still below the pre-pandemic government payroll. The differential from Jan 2020 is -73K. If we used the Feb 2020 date immediately ahead of COVID, the Government payroll is -161K lower as of June 2023.
For the June payroll count looking back to the Jan 2020 start before COVID, we only see two of the lines above in the red: Government and Mining/Logging. Mining/Logging in the Private Sector is making a comeback LTM at +35K and +14K YTD.
The increase of +4.2 million jobs since Jan 2020 in total Private Sector payroll tells a good story as does the 3.19 million LTM and 1.29 million YTD gains. On a YTD basis, the only decliner in the chart is Nondurables Manufacturing at -13K in contrast to durables at +28K. As always, the big numbers are in Services as the US has been a Services economy for decades. Services accounted for just under 84% of June Private Sector payroll. We get into the weeds on the Services categories later in the piece.
Construction is in a very interesting secular period…
Construction is one of those sectors that rolls up in the employment report under “Goods” along with Manufacturing and Mining (which includes the E&P sector and directly supporting industries). Construction has been a steady growth story in payrolls broken into the categories noted. The small YTD decline in the Residential Building line of -5K is more than offset by the increase in Residential specialty trade contractors of +18K.
We looked at some of the construction issues in a recent commentary (see Construction Spending: Demystifying Nonresidential Mix 5-9-23). The news from the mega-project front is a key positive factor (see Signals and Soundbites: Ashtead 4Q23/FY 2023 6-14-23, United Rentals: Investor Day Backs Up Bulls 6-11-23)
Manufacturing is in a new phase of uncertain timing…
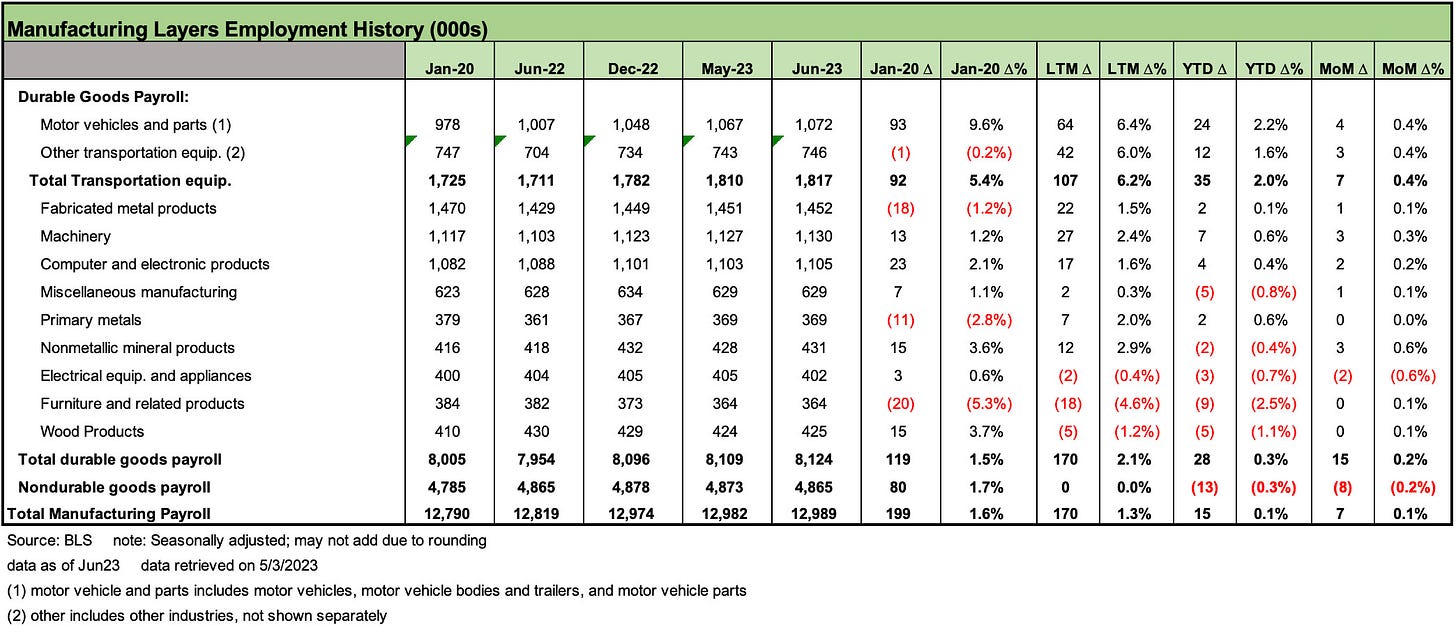
In the next two charts, we look at Durables and Nondurables in payroll context. Durables is 63% of the combined tally of the two. Transportation equipment leads the pack in Durables payroll share for June totals and also added the most jobs since Jan 2020, LTM, and YTD.
Durables have the biggest multiplier effect in economic terms and will remain a focal point of the reshoring and onshoring programs that have been in the headlines since the Trump tariffs and into the new versions of the Biden tariffs and various economic incentive programs.
The evolution of trade and increased protectionism will be a hot topic in the 2024 election with both sides of the aisle in Washington jockeying to show how they are the best friend of the working man and will be tougher on China supplier chain dependence after the pandemic disruptions and economic fallout. The problem is that the reality of supplier chains is not as flexible as the story lines of politicians. Those topics are for another day.
In terms of the job prospects and payroll impact that might be seen in a soft landing, the theories around labor hoarding abound. If supplier chains are in fact going to be a core part of manufacturer strategy and capex programs, that could be one more factor that supports resilient payrolls in many trades and services occupations. That is especially the case in manufacturing. Skilled and semi-skilled employees do not grow on trees and the need for technical capability and software friendly employees is pervasive across manufacturing and services. That includes a range of industries from auto dealers to manufacturers to E&P among many subsectors where skill sets and supply-demand imbalances are taking wages higher.
The above chart frames Nondurables where we continue to see slow and steady erosion of Nondurables jobs across many categories since Jan 2020. Chemicals and Food Manufacturing offset those in the total Nondurables payroll number since Jan 2020. Unsurprisingly, the biggest loser was printing and related activities.
In prior lives, we used to generate these charts from Dec 2007 to highlight what jobs might never be coming back after the deep restructuring actions of the credit crisis period. The biggest victims of the secular offshoring (and disappearance of some jobs entirely) were on this Nondurables list. Since Jan 2020, most of the payroll deltas are negative. The same is true for the LTM period. The total is negative YTD.
In some cases, job migration was south of the border for the labor arbitrage to protect margins, but there was no shortage of supplier chain relocations to China. As an aside, Vietnam is now a major trading partner (dominated by imports of course). Tariffs on China do not necessarily bring jobs home. They often just relocate to a different offshore source.
The Services sector drives the top line as well as current inflation worries…
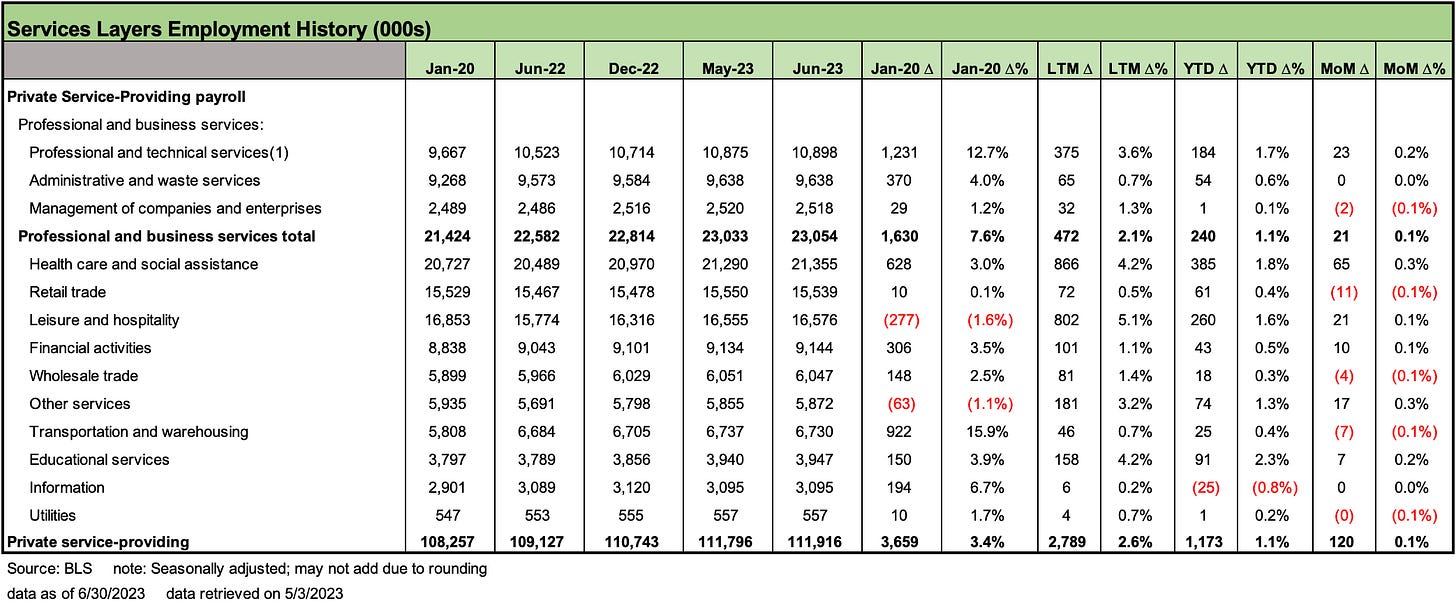
The Services lines run the gamut from low pay to very high pay, but the biggest movers each month in the JOLTS and in the BLS monthly report are in occupations such as Leisure and Hospitality, Healthcare and Social Services, Retail, and the catch-all bucket of Professional and Business Services. It is easy to see why Services inflation is a problem with so many bodies looking for a pay raise and the labor market tight.
Since January 2020, the total Services sector is +3.66 million in payroll and +2.79 million on an LTM basis even with inflation and the Fed tightening. The biggest net loser of jobs is still Leisure and Hospitality at -277K since Jan 2020. That is despite the addition of 802K jobs LTM. The highest LTM jobs line was Health Care and Social Assistance at +866K. That category cuts across a wide range of jobs and is consistent with demographic trends. The YTD gain of 1.17 million is around 42% of the LTM adds.
As we look at the scale of these numbers, we are reminded that it takes a lot to move PCE lower and drive a true recession from the PCE and Fixed Investment lines. We ducked one self-inflicted wound in the debt ceiling insanity. The question now turns back to the consumer sector, the Fed, the relative exposure to global cycle interdependence (energy, commodities, China), and how economically destructive Congress might prove to be in their battling.
We have a very hard time seeing a recession in 2023. People were calling the fall of 2022 a recession, so there will be plenty more of the same. The 2Q23 earning season is dead ahead and a fresh round of guidance and capex planning should offer some useful color.


